Analysis Summary
Notes:
- 1) No attempt has been made to eliminate the non-significant decimal places.
- 2) This batgrbproduct analysis is done using the HEASARC data.
- 3) This batgrbproduct analysis is using the flight position for the mask-weighting calculation.
======================================================================
BAT GRB EVENT DATA PROCESSING REPORT
Process Script Ver: batgrbproduct v2.46
Process Start Time: Mon Jan 13 22:00:48 EST 2014
Host Name: batevent1
Current Working Dir: /local/data/batevent/batevent_reproc/trigger456939
======================================================================
Trigger: 00456939 Segment: 000
BAT Trigger Time: 331917876.288 [s; MET]
Trigger Stop: 331917877.312 [s; MET]
UTC: 2011-07-09T15:24:29.148680 [includes UTCF correction]
Where From?: TDRSS position message
BAT
RA: 238.89550647638 Dec: 40.8976448151732 [deg; J2000]
Catalogged Source?: NO
Point Source?: YES
GRB Indicated?: YES [ by BAT flight software ]
Image S/N Ratio: 18.12
Image Trigger?: NO
Rate S/N Ratio: 108.52649446103 [ if not an image trigger ]
Image S/N Ratio: 18.12
Analysis Position: [ source = BAT ]
RA: 238.89550647638 Dec: 40.8976448151732 [deg; J2000]
Refined Position: [ source = BAT pre-slew burst ]
RA: 238.894804457077 Dec: 40.9184617549466 [deg; J2000]
{ 15h 55m 34.8s , +40d 55' 06.5" }
+/- 0.518533347412532 [arcmin] (estimated 90% radius based on SNR)
+/- 0.138303340410033 [arcmin] (formal 1-sigma fit error)
SNR: 77.7284932717575
Angular difference between the analysis and refined position is 1.249422 arcmin
Partial Coding Fraction: 0.9140625 [ including projection effects ]
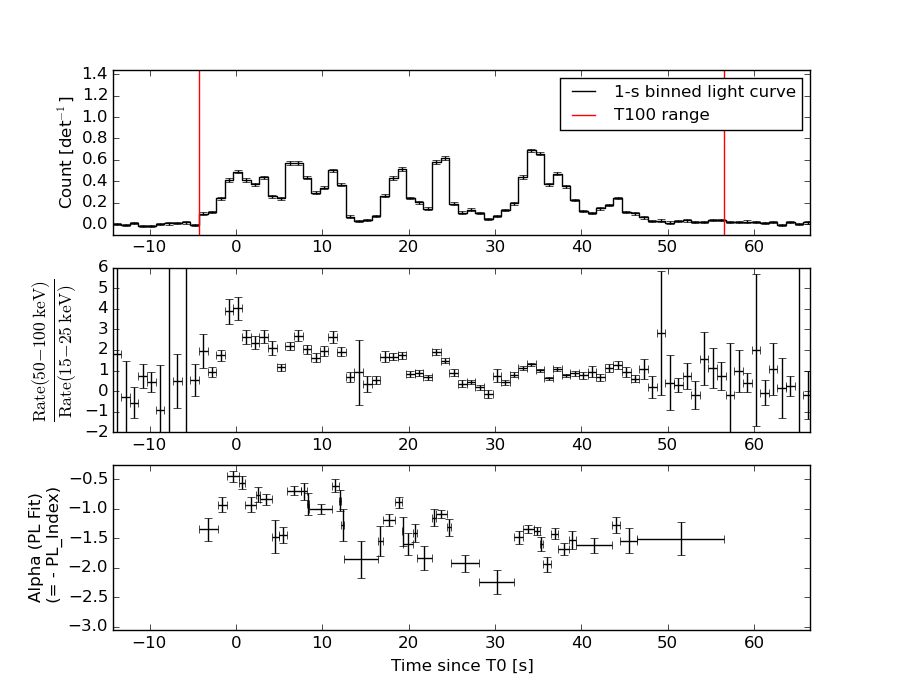
Duration
T90: 44.3279999494553 +/- 0.542070084896921
Measured from: -0.564000010490417
to: 43.7639999389648 [s; relative to TRIGTIME]
T50: 27.4439999461174 +/- 0.229120056090684
Measured from: 6.82400000095367
to: 34.2679999470711 [s; relative to TRIGTIME]
Fluence
Peak Flux (peak 1 second)
Measured from: 34.2480000257492
to: 35.2480000257492 [s; relative to TRIGTIME]
Total Fluence
Measured from: -4.2960000038147
to: 56.4760000109673 [s; relative to TRIGTIME]
Band 1 Band 2 Band 3 Band 4
15-25 25-50 50-100 100-350 keV
Total 3.379927 5.342922 4.724045 1.407962
0.051547 0.056836 0.053606 0.042741 [error]
Peak 0.184746 0.303154 0.222671 0.051087
0.008238 0.009785 0.008983 0.006040 [error]
[ fluence units of on-axis counts / fully illuminated detector ]
======================================================================
====== Table of the duration information =============================
Value tstart tstop
T100 60.772 -4.296 56.476
T90 44.328 -0.564 43.764
T50 27.444 6.824 34.268
Peak 1.000 34.248 35.248
====== Spectral Analysis Summary =====================================
Model : spectral model: simple power-law (PL) and cutoff power-law (CPL)
Ph_index : photon index: E^{Ph_index}
Ph_90err : 90% error of the photon index
Epeak : Epeak in keV
Epeak_90err: 90% error of Epeak
Norm : normalization at 50 keV in both the PL model and CPL model
Nomr_90err : 90% error of the normalization
chi2 : Chi-Squared
dof : degree of freedo
=== Time-averaged spectral analysis ===
(Best model with acceptable fit: PL)
Model Ph_index Ph_90err_low Ph_90err_hi Epeak Epeak_90err_low Epeak_90err_hi Norm Nomr_90err_low Norm_90err_hi chi2 dof
PL -1.232 -0.031 0.031 - - - 1.63e-02 -2.71e-04 2.70e-04 41.680 57
CPL -1.180 -0.063 0.086 966.079 -966.079 -966.079 1.71e-02 -1.02e-03 1.21e-03 42.100 56
=== 1-s peak spectral analysis ===
(Best model with acceptable fit: CPL)
Model Ph_index Ph_90err_low Ph_90err_hi Epeak Epeak_90err_low Epeak_90err_hi Norm Nomr_90err_low Norm_90err_hi chi2 dof
PL -1.374 -0.069 0.069 - - - 4.92e-02 -1.94e-03 1.94e-03 61.260 57
CPL -0.985 -0.272 0.291 136.545 -37.542 179.793 7.60e-02 -1.95e-02 2.85e-02 55.140 56
=== Fluence/Peak Flux Summary ===
Model Band1 Band2 Band3 Band4 Band5 Total
15-25 25-50 50-100 100-350 15-150 15-350 keV
Fluence PL 9.85e-07 2.13e-06 3.63e-06 1.42e-05 9.97e-06 2.10e-05 erg/cm2
90%_error_low -3.68e-08 -4.63e-08 -6.30e-08 -5.99e-07 -1.62e-07 -6.14e-07 erg/cm2
90%_error_hi 3.74e-08 4.62e-08 6.29e-08 6.18e-07 1.62e-07 6.30e-07 erg/cm2
Peak flux PL 1.79e+00 1.95e+00 1.50e+00 1.90e+00 5.96e+00 7.14e+00 ph/cm2/s
90%_error_low -1.27e-01 -8.50e-02 -7.25e-02 -1.85e-01 -2.39e-01 -2.88e-01 ph/cm2/s
90%_error_hi 1.30e-01 8.47e-02 7.22e-02 1.97e-01 2.39e-01 2.89e-01 ph/cm2/s
Fluence CPL 9.84e-07 2.13e-06 3.64e-06 1.42e-05 9.97e-06 2.02e-05 erg/cm2
90%_error_low -3.67e-08 -4.31e-08 -6.23e-08 -1.92e-06 -1.58e-07 -1.18e-06 erg/cm2
90%_error_hi 2.64e-08 3.36e-08 6.22e-08 3.72e-07 1.61e-07 8.22e-07 erg/cm2
Peak flux CPL 1.66e+00 2.01e+00 1.56e+00 1.25e+00 5.85e+00 6.47e+00 ph/cm2/s
90%_error_low -1.56e-01 -9.62e-02 -8.30e-02 -3.07e-01 -2.50e-01 -4.06e-01 ph/cm2/s
90%_error_hi 1.59e-01 9.73e-02 8.40e-02 4.24e-01 2.50e-01 4.85e-01 ph/cm2/s
======================================================================
Image
Pre-slew 15.0-350.0 keV image (Event data)
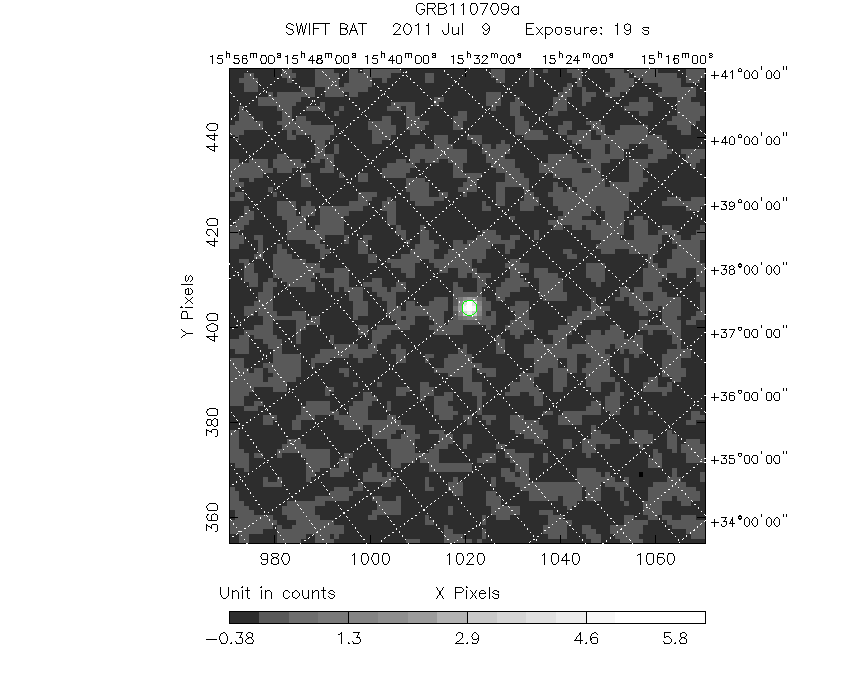
#   RAcent    DECcent   POSerr    Theta     Phi              Peak Cts       SNR   Name
  238.8948    40.9185   0.0025    18.4520   152.8293         6.4504576     77.728 TRIG_00456939

Foreground time interval of the image:
 -4.296  14.813 (delta_t =  19.109 [sec])
Background time interval of the image:
-239.288  -4.296 (delta_t = 234.992 [sec])
Light Curves
Note: The mask-weighted lightcurves have units of either count/det or counts/sec/det, where a det is 0.4 x 0.4 = 0.16 sq cm.
Full-time range; 1 s binning
Other quick-look light curves:
- 64 ms binning (zoomed)
- 16 ms binning (zoomed)
- 8 ms binning (zoomed)
- 2 ms binning (zoomed)
- SN=5 or 10 s binning (full-time range)
- Raw light curve
Spectra
- 64 ms binning (zoomed)
- 16 ms binning (zoomed)
- 8 ms binning (zoomed)
- 2 ms binning (zoomed)
- SN=5 or 10 s binning (full-time range)
- Raw light curve
Spectra
Notes:
- 1) The fitting includes the systematic errors.
- 2) When the burst includes telescope slew time periods, the fitting uses an average response file made from multiple 5-s response files through out the slew time plus single time preiod for the non-slew times, and weighted by the total counts in the corresponding time period using addrmf. An average response file is needed becuase a spectral fit using the pre-slew DRM will introduce some errors in both a spectral shape and a normalization if the PHA file contains a lot of the slew/post-slew time interval.
- 3) For fits to more complicated models (e.g. a power-law over a cutoff power-law), the BAT team has decided to require a chi-square improvement of more than 6 for each extra dof.
Time averaged spectrum fit using the average DRM
Power-law model
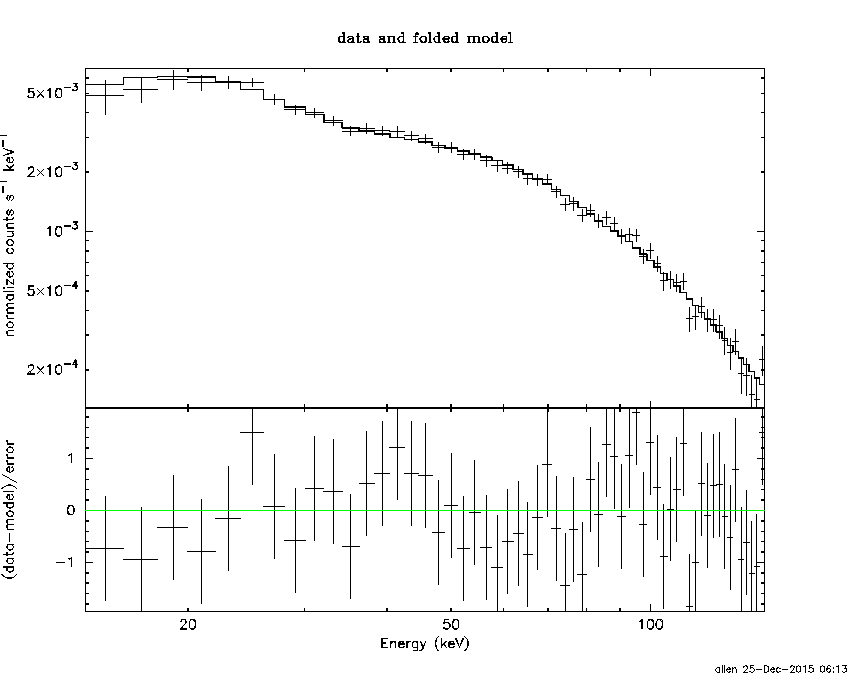
Time interval is from   -4.296 sec. to   56.476 sec.

Spectral model in power-law:
------------------------------------------------------------
Parameters  : value       lower 90%   higher 90%
Photon index: -1.23213     ( -0.0313679   0.0314518 )
Norm@50keV  : 1.63131E-02    ( -0.000270926   0.000270348 )
------------------------------------------------------------
#Fit statistic : Chi-Squared =          41.68 using 59 PHA bins.
# Reduced chi-squared =         0.7312 for     57 degrees of freedom
# Null hypothesis probability =   9.363271e-01

Photon flux (15-150 keV)    in 60.77 sec: 1.92396 ( -0.03573  0.03588 ) ph/cm2/s
Energy fluence (15-150 keV)             : 9.96987e-06 ( -1.62119e-07  1.62229e-07 ) ergs/cm2
Cutoff power-law model

Time interval is from   -4.296 sec. to   56.476 sec.
Spectral model in the cutoff power-law:
------------------------------------------------------------
Parameters  : value       lower 90%   higher 90%
Photon index: -1.17987     ( -0.0153941   0.133283 )
Epeak [keV] : 966.079      ( -9680.9 -9680.9 )
Norm@50keV  : 1.71354E-02    ( -0.000270049   0.00195393 )
------------------------------------------------------------
#Fit statistic : Chi-Squared =          42.10 using 59 PHA bins.
# Reduced chi-squared =         0.7519 for     56 degrees of freedom
# Null hypothesis probability =   9.156233e-01

Photon flux (15-150 keV)    in 60.77 sec: 1.92315 ( -0.0403  0.03558 ) ph/cm2/s
Energy fluence (15-150 keV)             : 9.96756e-06 ( -1.58003e-07  1.61273e-07 ) ergs/cm2
1-s peak spectrum fit
Power-law model
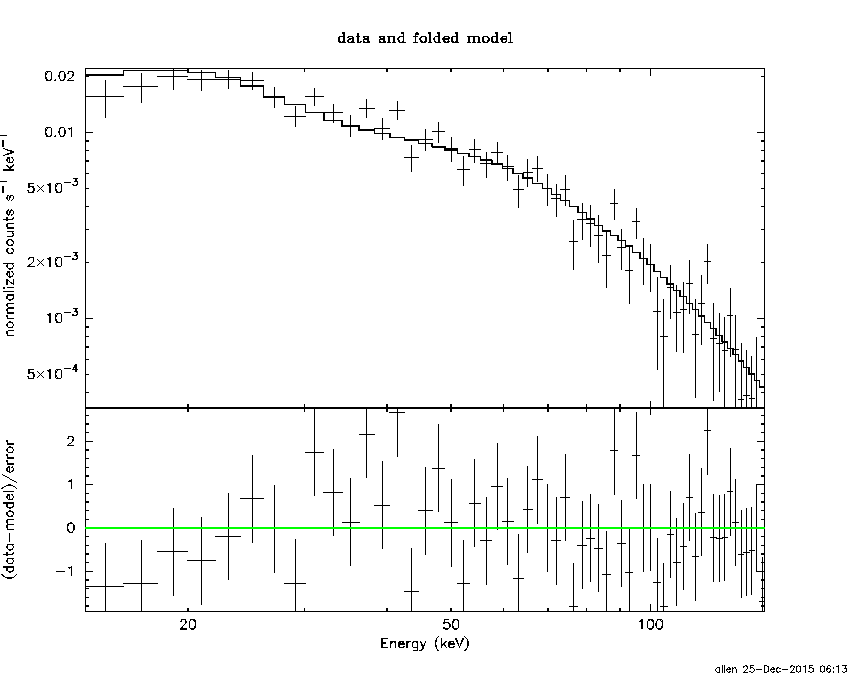
Time interval is from   34.248 sec. to   35.248 sec.

Spectral model in power-law:
------------------------------------------------------------
Parameters  : value       lower 90%   higher 90%
Photon index: -1.37432     ( -0.068865   0.0686606 )
Norm@50keV  : 4.91931E-02    ( -0.00194014   0.00193873 )
------------------------------------------------------------
#Fit statistic : Chi-Squared =          61.26 using 59 PHA bins.
# Reduced chi-squared =          1.075 for     57 degrees of freedom
# Null hypothesis probability =   3.258511e-01

Photon flux (15-150 keV)    in 1 sec: 5.95692 ( -0.23913  0.23933 ) ph/cm2/s
Energy fluence (15-150 keV)             : 4.77958e-07 ( -2.09645e-08  2.10414e-08 ) ergs/cm2
Cutoff power-law model
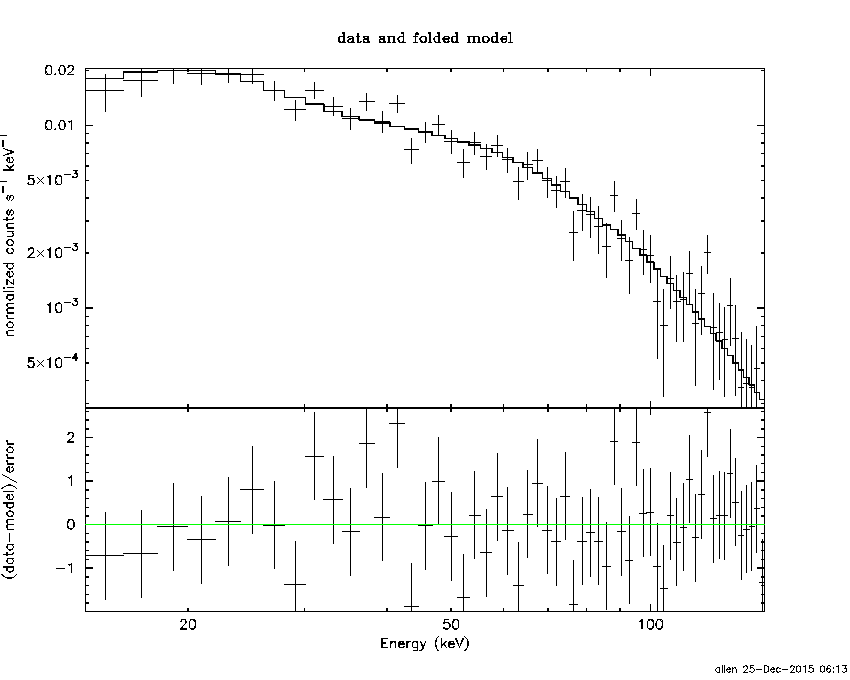
Time interval is from   34.248 sec. to   35.248 sec.
Spectral model in the cutoff power-law:
------------------------------------------------------------
Parameters  : value       lower 90%   higher 90%
Photon index: -0.985497     ( -0.272135   0.290851 )
Epeak [keV] : 136.545      ( -37.5421 179.793 )
Norm@50keV  : 7.60110E-02    ( -0.0195129   0.0284675 )
------------------------------------------------------------
#Fit statistic : Chi-Squared =          55.14 using 59 PHA bins.
# Reduced chi-squared =         0.9846 for     56 degrees of freedom
# Null hypothesis probability =   5.074148e-01

Photon flux (15-150 keV)    in 1 sec: 5.84869 ( -0.25022  0.25025 ) ph/cm2/s
Energy fluence (15-150 keV)             : 4.655e-07 ( -2.30543e-08  2.29274e-08 ) ergs/cm2
Time-resolved spectra
Distribution
T90 vs. Hardness ratio plot
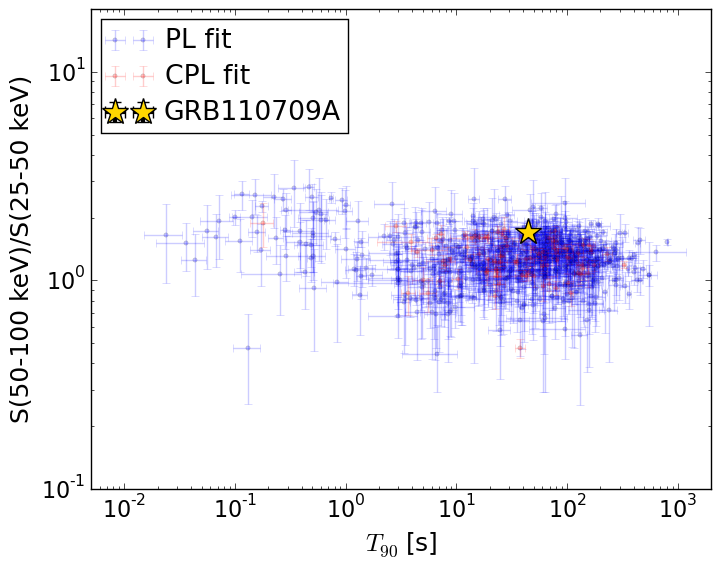
T90                                   = 44.328 sec.
Hardness ratio (energy fluence ratio) = 1.70278523171
S(15-50 keV) vs. S(50-150 keV) plot
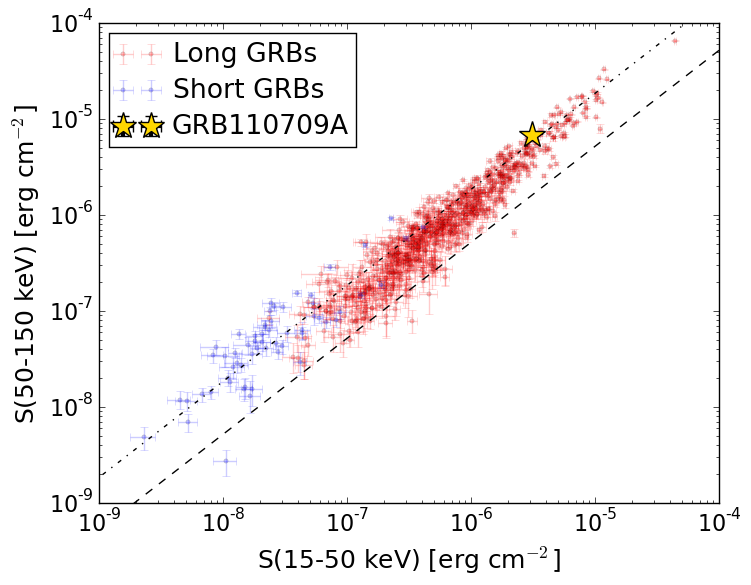
S(15-50 keV)  = 3.1196588e-06
S(50-150 keV) = 6.850218e-06
The dash-dotted line and the dashed line traces the fluences calculated from the Band function with Epeak = 15 and 150 keV, respectively. Both lines assume a canonical values of alpha = -1 and beta = -2.5.
Mask shadow pattern
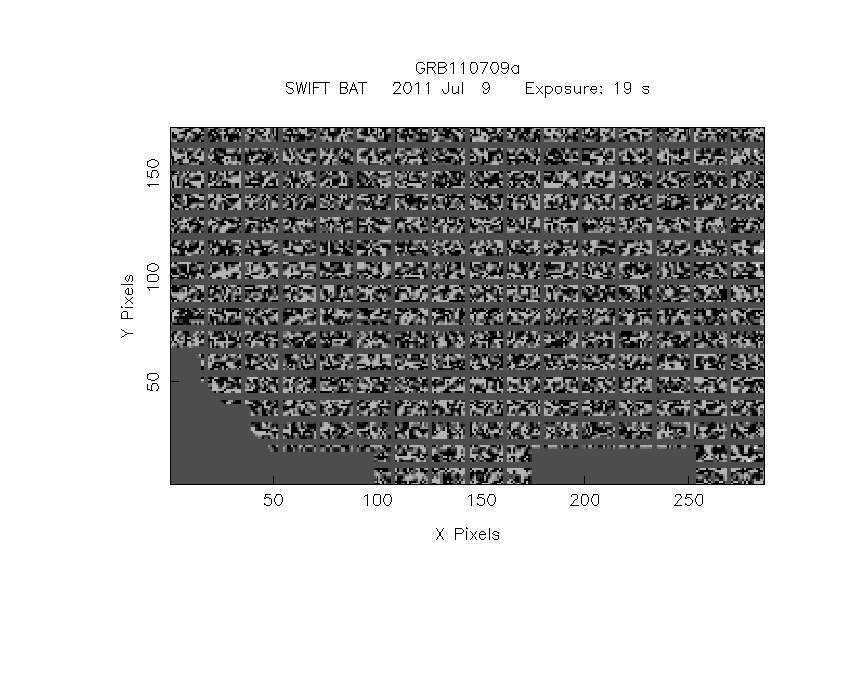
IMX = -2.968442908855459E-01, IMY = -1.523657199714717E-01
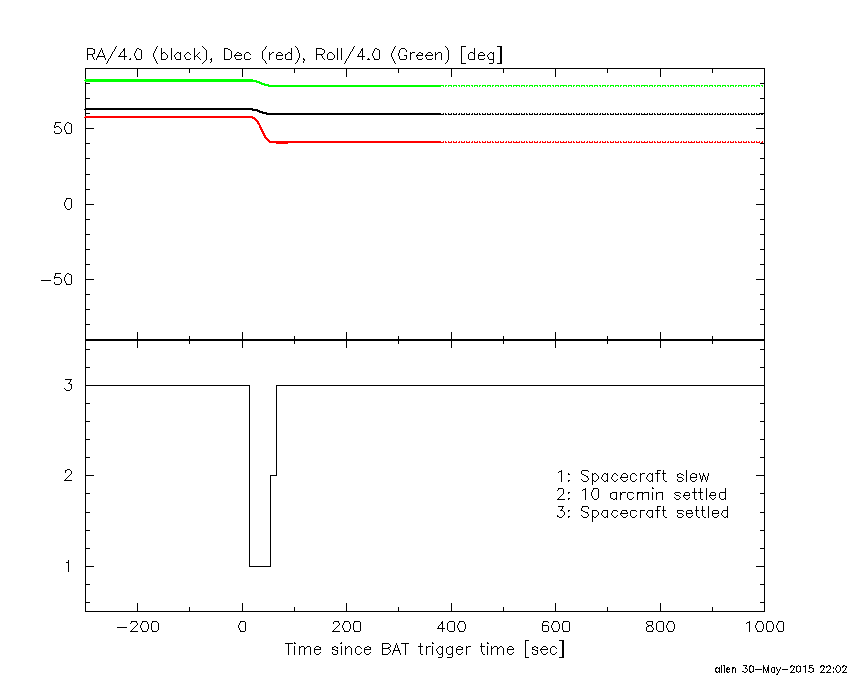
Spacecraft aspect plot
Bright source in the pre-burst/pre-slew/post-slew images
Pre-burst image of 15-350 keV band
Time interval of the image:
-239.288000 -4.296000

# RAcent  DECcent POSerr Theta    Phi  PeakCts   SNR AngSep     Name
#  [deg]    [deg]    ['] [deg]  [deg]                   [']
254.4008  35.1497    0.0  22.6  115.4   0.2410   0.9   11.9	Her X-1
299.5969  35.2031    0.8  39.0   46.0   6.6043  13.9    0.3	Cyg X-1
308.0989  40.9346    1.8  39.3   32.0   2.7656   6.4    1.2	Cyg X-3
326.2124  38.2033    7.4  50.9   20.4  -1.3216  -1.5    7.4	Cyg X-2
308.0802  37.6296    2.7  41.6   35.6   2.1345   4.3 ------	UNKNOWN
326.7368  38.5848    2.4  50.9   19.7   3.7634   4.9 ------	UNKNOWN
329.0776  47.4862    2.6  45.7    9.7   1.8390   4.4 ------	UNKNOWN
211.3116  18.5831    2.6  48.8  176.2   2.1538   4.4 ------	UNKNOWN
Pre-slew background subtracted image of 15-350 keV band
Time interval of the image:
-4.296000 14.812600

# RAcent  DECcent POSerr Theta    Phi  PeakCts   SNR AngSep     Name
#  [deg]    [deg]    ['] [deg]  [deg]                   [']
254.4854  35.3837    5.5  22.3  115.2  -0.2211  -2.1    2.8	Her X-1
299.7436  35.1473    3.9  39.1   45.9   0.6445   3.0    8.2	Cyg X-1
307.9546  41.0458    5.7  39.1   32.0   0.3465   2.0    9.0	Cyg X-3
326.0400  38.4117   11.9  50.6   20.3   0.3444   1.0    8.2	Cyg X-2
238.8948  40.9185    0.1  18.5  152.8   6.4504  77.7 ------	UNKNOWN
206.2733  16.0201    2.4  53.3 -179.9   1.2543   4.8 ------	UNKNOWN
223.6866  77.2703    2.4  21.8  -73.6   0.4871   4.8 ------	UNKNOWN
183.9462  23.7524    2.3  58.0 -153.4   2.6099   4.9 ------	UNKNOWN
Post-slew image of 15-350 keV band
Time interval of the image:
54.812590 962.782600

# RAcent  DECcent POSerr Theta    Phi  PeakCts   SNR AngSep     Name
#  [deg]    [deg]    ['] [deg]  [deg]                   [']
254.3885  35.2787    9.1  13.4   66.1  -0.6119  -1.3    5.1	Her X-1
299.5975  35.1909    1.0  47.2   32.5  20.1313  11.3    0.7	Cyg X-1
308.1098  40.9141    3.7  50.8   21.9   6.9092   3.1    2.3	Cyg X-3
246.2499   3.6712    2.7  37.8  124.2   6.1216   4.5 ------	UNKNOWN
246.4043   4.0113    3.6  37.5  123.9   4.9918   3.8 ------	UNKNOWN
225.6690  12.2812    2.6  30.9  162.0   3.0940   4.5 ------	UNKNOWN
308.7316  54.6298    3.1  46.8    4.5   3.4591   3.7 ------	UNKNOWN
285.6322  60.6654    2.9  34.4   -4.7   2.5246   4.0 ------	UNKNOWN
196.5306  -1.5636    4.4  57.3 -170.6   6.3134   2.6 ------	UNKNOWN
339.0686  65.0186    2.5  57.5  -14.2  12.2795   4.6 ------	UNKNOWN
182.5968  14.4678    3.8  55.3 -145.2  12.6468   3.0 ------	UNKNOWN