Analysis Summary
Notes:
- 1) No attempt has been made to eliminate the non-significant decimal places.
- 2) This batgrbproduct analysis is done using the HEASARC data.
- 3) This batgrbproduct analysis is using the flight position for the mask-weighting calculation.
======================================================================
BAT GRB EVENT DATA PROCESSING REPORT
Process Script Ver: batgrbproduct v2.46
Process Start Time: Tue May 26 22:38:36 EDT 2015
Host Name: bat1
Current Working Dir: /local/data/bat1/alien/Swift_3rdBATcatalog/event/batevent_reproc/trigger456967
======================================================================
Trigger: 00456967 Segment: 000
BAT Trigger Time: 331939966.976 [s; MET]
Trigger Stop: 331939968 [s; MET]
UTC: 2011-07-09T21:32:39.835840 [includes UTCF correction]
Where From?: TDRSS position message
BAT
RA: 164.614495443872 Dec: -23.4839881602794 [deg; J2000]
Catalogged Source?: NO
Point Source?: YES
GRB Indicated?: YES [ by BAT flight software ]
Image S/N Ratio: 7.39
Image Trigger?: NO
Rate S/N Ratio: 12.4899959967968 [ if not an image trigger ]
Image S/N Ratio: 7.39
Analysis Position: [ source = BAT ]
RA: 164.614495443872 Dec: -23.4839881602794 [deg; J2000]
Refined Position: [ source = BAT pre-slew burst ]
RA: 164.668326775659 Dec: -23.4698929670294 [deg; J2000]
{ 10h 58m 40.4s , -23d 28' 11.6" }
+/- 1.05926852212273 [arcmin] (estimated 90% radius based on SNR)
+/- 0.346104897152091 [arcmin] (formal 1-sigma fit error)
SNR: 28.0153096825351
Angular difference between the analysis and refined position is 3.080861 arcmin
Partial Coding Fraction: 0.578125 [ including projection effects ]
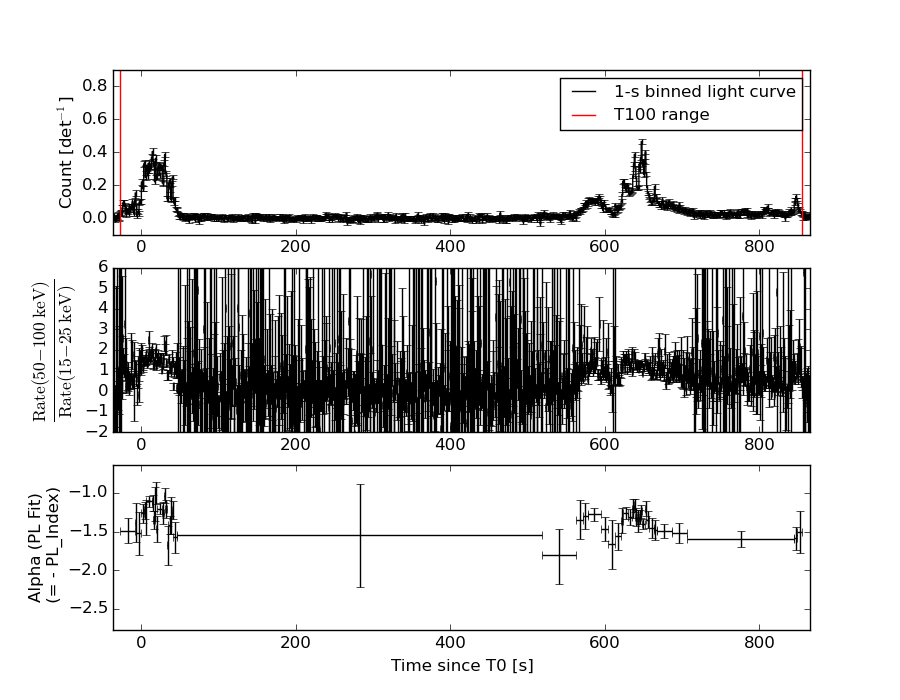
Duration
T90: 810.471999943256 +/- 10.4116434855617
Measured from: 0.108000099658966
to: 810.580000042915 [s; relative to TRIGTIME]
T50: 629.391999959946 +/- 2.30903963424052
Measured from: 24.8720000982285
to: 654.264000058174 [s; relative to TRIGTIME]
Fluence
Peak Flux (peak 1 second)
Measured from: 646.611999988556
to: 647.611999988556 [s; relative to TRIGTIME]
Total Fluence
Measured from: -27.3600000143051
to: 855.487999975681 [s; relative to TRIGTIME]
Band 1 Band 2 Band 3 Band 4
15-25 25-50 50-100 100-350 keV
Total 9.382273 13.282414 11.081025 2.977319
0.178073 0.185981 0.168073 0.149592 [error]
Peak 0.118890 0.175016 0.160770 0.047459
0.007545 0.008589 0.008161 0.006287 [error]
[ fluence units of on-axis counts / fully illuminated detector ]
======================================================================
====== Table of the duration information =============================
Value tstart tstop
T100 882.848 -27.360 855.488
T90 810.472 0.108 810.580
T50 629.392 24.872 654.264
Peak 1.000 646.612 647.612
====== Spectral Analysis Summary =====================================
Model : spectral model: simple power-law (PL) and cutoff power-law (CPL)
Ph_index : photon index: E^{Ph_index}
Ph_90err : 90% error of the photon index
Epeak : Epeak in keV
Epeak_90err: 90% error of Epeak
Norm : normalization at 50 keV in both the PL model and CPL model
Nomr_90err : 90% error of the normalization
chi2 : Chi-Squared
dof : degree of freedo
=== Time-averaged spectral analysis ===
(Best model with acceptable fit: PL)
Model Ph_index Ph_90err_low Ph_90err_hi Epeak Epeak_90err_low Epeak_90err_hi Norm Nomr_90err_low Norm_90err_hi chi2 dof
PL -1.389 -0.038 0.038 - - - 2.74e-03 -5.29e-05 5.29e-05 41.140 57
CPL -1.252 -0.067 0.152 315.802 -134.434 -315.802 3.14e-03 -4.09e-04 4.98e-04 38.620 56
=== 1-s peak spectral analysis ===
(Best model with acceptable fit: PL)
Model Ph_index Ph_90err_low Ph_90err_hi Epeak Epeak_90err_low Epeak_90err_hi Norm Nomr_90err_low Norm_90err_hi chi2 dof
PL -1.262 -0.092 0.092 - - - 3.20e-02 -1.69e-03 1.69e-03 58.480 57
CPL -0.946 -0.344 0.378 175.264 -68.290 -175.264 4.55e-02 -1.40e-02 2.31e-02 56.070 56
=== Fluence/Peak Flux Summary ===
Model Band1 Band2 Band3 Band4 Band5 Total
15-25 25-50 50-100 100-350 15-150 15-350 keV
Fluence PL 2.78e-06 5.47e-06 8.36e-06 2.78e-05 2.34e-05 4.44e-05 erg/cm2
90%_error_low -1.17e-07 -1.32e-07 -1.86e-07 -1.47e-06 -4.64e-07 -1.54e-06 erg/cm2
90%_error_hi 1.19e-07 1.32e-07 1.86e-07 1.52e-06 4.65e-07 1.58e-06 erg/cm2
Peak flux PL 1.05e+00 1.21e+00 1.01e+00 1.42e+00 3.79e+00 4.70e+00 ph/cm2/s
90%_error_low -1.00e-01 -7.18e-02 -6.50e-02 -1.83e-01 -2.02e-01 -2.63e-01 ph/cm2/s
90%_error_hi 1.03e-01 7.14e-02 6.47e-02 2.00e-01 2.02e-01 2.65e-01 ph/cm2/s
Fluence CPL 2.68e-06 5.50e-06 8.46e-06 2.34e-05 2.32e-05 4.00e-05 erg/cm2
90%_error_low -1.59e-07 -1.36e-07 -2.16e-07 -3.90e-06 -5.14e-07 -3.91e-06 erg/cm2
90%_error_hi 1.62e-07 1.36e-07 2.17e-07 2.30e-06 5.13e-07 4.79e-06 erg/cm2
Peak flux CPL 9.81e-01 1.25e+00 1.04e+00 9.96e-01 3.73e+00 4.27e+00 ph/cm2/s
90%_error_low -1.22e-01 -8.04e-02 -7.39e-02 -3.13e-01 -2.10e-01 -3.85e-01 ph/cm2/s
90%_error_hi 1.25e-01 8.16e-02 7.51e-02 4.41e-01 2.10e-01 5.02e-01 ph/cm2/s
======================================================================
Image
Pre-slew 15.0-350.0 keV image (Event data)
#   RAcent    DECcent   POSerr    Theta     Phi              Peak Cts       SNR   Name
  164.6683   -23.4699   0.0069    28.6593   147.1709         5.8734534     28.015 TRIG_00456967

Foreground time interval of the image:
-27.360  12.925 (delta_t =  40.285 [sec])
Background time interval of the image:
-36.875 -27.360 (delta_t =   9.515 [sec])
Light Curves
Note: The mask-weighted lightcurves have units of either count/det or counts/sec/det, where a det is 0.4 x 0.4 = 0.16 sq cm.
Full-time range; 1 s binning
Other quick-look light curves:
- 64 ms binning (zoomed)
- 16 ms binning (zoomed)
- 8 ms binning (zoomed)
- 2 ms binning (zoomed)
- SN=5 or 10 s binning (full-time range)
- Raw light curve
Spectra
- 64 ms binning (zoomed)
- 16 ms binning (zoomed)
- 8 ms binning (zoomed)
- 2 ms binning (zoomed)
- SN=5 or 10 s binning (full-time range)
- Raw light curve
Spectra
Notes:
- 1) The fitting includes the systematic errors.
- 2) When the burst includes telescope slew time periods, the fitting uses an average response file made from multiple 5-s response files through out the slew time plus single time preiod for the non-slew times, and weighted by the total counts in the corresponding time period using addrmf. An average response file is needed becuase a spectral fit using the pre-slew DRM will introduce some errors in both a spectral shape and a normalization if the PHA file contains a lot of the slew/post-slew time interval.
- 3) For fits to more complicated models (e.g. a power-law over a cutoff power-law), the BAT team has decided to require a chi-square improvement of more than 6 for each extra dof.
Time averaged spectrum fit using the average DRM
Power-law model
Multiple GTIs in the spectrum
tstart tstop
-27.360000 233.744000
235.024000 855.488000

Spectral model in power-law:
------------------------------------------------------------
Parameters  : value       lower 90%   higher 90%
Photon index: -1.38916     ( -0.0376513   0.0377154 )
Norm@50keV  : 2.74202E-03    ( -5.28932e-05   5.28642e-05 )
------------------------------------------------------------
#Fit statistic : Chi-Squared =          41.14 using 59 PHA bins.
# Reduced chi-squared =         0.7217 for     57 degrees of freedom
# Null hypothesis probability =   9.437783e-01

Photon flux (15-150 keV)    in 881.6 sec: 0.333120 ( -0.007318  0.007344 ) ph/cm2/s
Energy fluence (15-150 keV)             : 2.34133e-05 ( -4.64384e-07  4.64931e-07 ) ergs/cm2
Cutoff power-law model
Multiple GTIs in the spectrum
tstart tstop
-27.360000 233.744000
235.024000 855.488000
Spectral model in the cutoff power-law:
------------------------------------------------------------
Parameters  : value       lower 90%   higher 90%
Photon index: -1.25175     ( -0.0671064   0.152262 )
Epeak [keV] : 315.802      ( -134.431 -315.799 )
Norm@50keV  : 3.14271E-03    ( -0.000408901   0.000497663 )
------------------------------------------------------------
#Fit statistic : Chi-Squared =          38.62 using 59 PHA bins.
# Reduced chi-squared =         0.6896 for     56 degrees of freedom
# Null hypothesis probability =   9.630203e-01

Photon flux (15-150 keV)    in 881.6 sec: 0.329218 ( -0.008326  0.008371 ) ph/cm2/s
Energy fluence (15-150 keV)             : 2.32082e-05 ( -5.13658e-07  5.12715e-07 ) ergs/cm2
1-s peak spectrum fit
Power-law model
Time interval is from  646.612 sec. to  647.612 sec.

Spectral model in power-law:
------------------------------------------------------------
Parameters  : value       lower 90%   higher 90%
Photon index: -1.26216     ( -0.0918243   0.0918341 )
Norm@50keV  : 3.19602E-02    ( -0.001688   0.00168611 )
------------------------------------------------------------
#Fit statistic : Chi-Squared =          58.48 using 59 PHA bins.
# Reduced chi-squared =          1.026 for     57 degrees of freedom
# Null hypothesis probability =   4.209157e-01

Photon flux (15-150 keV)    in 1 sec: 3.78766 ( -0.2018  0.2019 ) ph/cm2/s
Energy fluence (15-150 keV)             : 3.18882e-07 ( -1.91452e-08  1.92529e-08 ) ergs/cm2
Cutoff power-law model
Time interval is from  646.612 sec. to  647.612 sec.
Spectral model in the cutoff power-law:
------------------------------------------------------------
Parameters  : value       lower 90%   higher 90%
Photon index: -0.945692     ( -0.343957   0.378414 )
Epeak [keV] : 175.264      ( -68.2901 -175.264 )
Norm@50keV  : 4.55089E-02    ( -0.0140209   0.0230671 )
------------------------------------------------------------
#Fit statistic : Chi-Squared =          56.07 using 59 PHA bins.
# Reduced chi-squared =          1.001 for     56 degrees of freedom
# Null hypothesis probability =   4.720617e-01

Photon flux (15-150 keV)    in 1 sec: 3.73494 ( -0.21013  0.20989 ) ph/cm2/s
Energy fluence (15-150 keV)             : 3.11774e-07 ( -2.09234e-08  2.08396e-08 ) ergs/cm2
Time-resolved spectra
Distribution
T90 vs. Hardness ratio plot
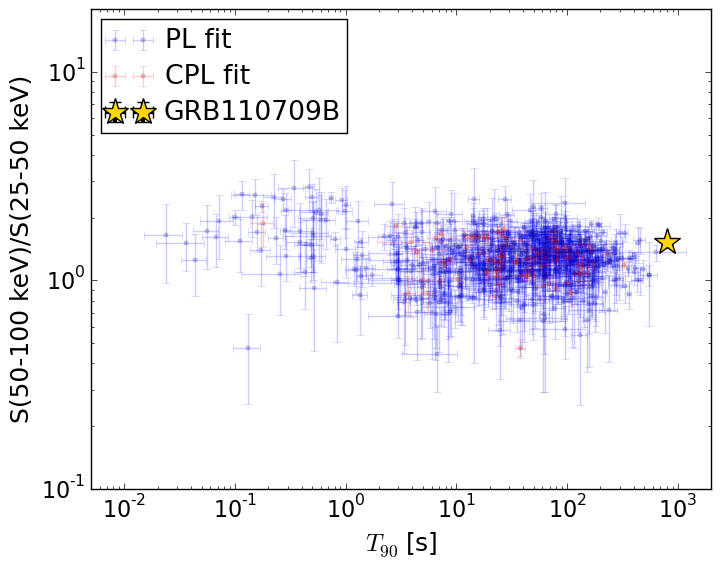
T90                                   = 810.472 sec.
Hardness ratio (energy fluence ratio) = 1.52717925775
S(15-50 keV) vs. S(50-150 keV) plot
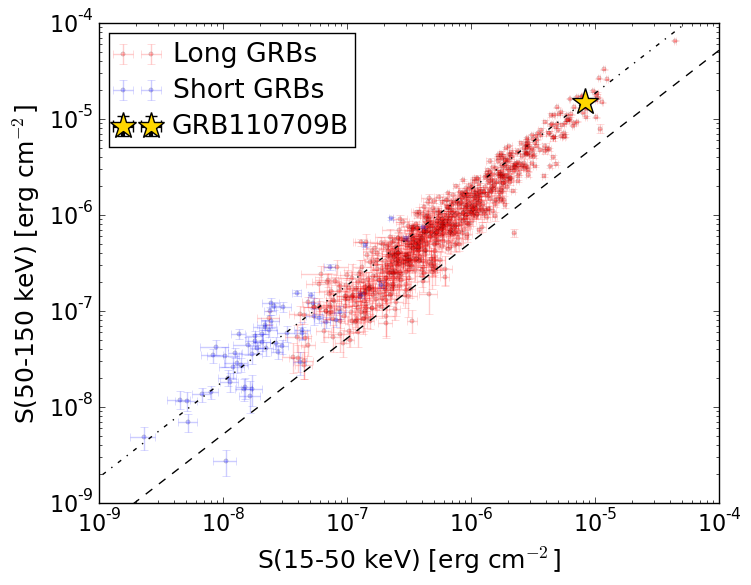
S(15-50 keV)  = 8.25404e-06
S(50-150 keV) = 1.5159427e-05
The dash-dotted line and the dashed line traces the fluences calculated from the Band function with Epeak = 15 and 150 keV, respectively. Both lines assume a canonical values of alpha = -1 and beta = -2.5.
Mask shadow pattern
IMX = -4.592707663994564E-01, IMY = -2.963102109446565E-01
Spacecraft aspect plot
Bright source in the pre-burst/pre-slew/post-slew images
Pre-burst image of 15-350 keV band
Time interval of the image:
-36.875410 -27.360000

# RAcent  DECcent POSerr Theta    Phi  PeakCts   SNR AngSep     Name
#  [deg]    [deg]    ['] [deg]  [deg]                   [']
135.3939 -40.5401    5.9  47.6 -173.9  -0.1258  -1.9    6.2	Vela X-1
187.5270   6.3924    2.3  32.5   69.6   0.3200   5.0 ------	UNKNOWN
175.0257  14.6479    2.5  22.6   45.4   0.1740   4.6 ------	UNKNOWN
168.5738  34.9461    2.2  33.8    6.2   0.2213   5.2 ------	UNKNOWN
115.4555  19.5574    2.4  41.7  -78.3   0.6203   4.9 ------	UNKNOWN
Pre-slew background subtracted image of 15-350 keV band
Time interval of the image:
-27.360000 12.924600

# RAcent  DECcent POSerr Theta    Phi  PeakCts   SNR AngSep     Name
#  [deg]    [deg]    ['] [deg]  [deg]                   [']
135.4067 -40.5104    4.0  47.6 -173.9   0.8632   2.9    6.2	Vela X-1
190.0436   0.8073    2.3  35.1   79.6   1.9783   5.1 ------	UNKNOWN
164.6683 -23.4699    0.4  28.7  147.2   5.8732  28.0 ------	UNKNOWN
170.0483  34.0713    2.4  33.5    8.8   0.9487   4.8 ------	UNKNOWN
158.0200  15.2050    2.0  12.0   -0.0   0.8513   5.7 ------	UNKNOWN
133.8211 -41.9418    2.1  49.4 -173.4   1.8449   5.5 ------	UNKNOWN
148.6812  32.4947    2.8  29.5  -25.0   0.7091   4.2 ------	UNKNOWN
117.9939 -41.2975    2.4  56.1 -161.1   2.9372   4.7 ------	UNKNOWN
114.2589 -41.2543    2.2  58.2 -158.9   4.6951   5.3 ------	UNKNOWN
Post-slew image of 15-350 keV band
Time interval of the image:
68.924600 233.744000
235.024000 1285.694000
1287.024000 1548.096500

# RAcent  DECcent POSerr Theta    Phi  PeakCts   SNR AngSep     Name
#  [deg]    [deg]    ['] [deg]  [deg]                   [']
135.5647 -40.5695    0.9  29.8 -167.7  11.7935  12.4    1.9	Vela X-1
170.3688 -60.6139    1.8  37.3  139.6  11.8388   6.4    1.7	Cen X-3
186.7993 -62.7497    6.0  42.0  129.3   6.4736   1.9    4.1	GX 301-2
187.6919 -57.1223    3.4  37.5  123.9   7.8697   3.4 ------	UNKNOWN
204.8978 -13.1763    2.6  39.4   46.4   9.5855   4.4 ------	UNKNOWN
175.6448 -41.7341    3.0  20.4  120.2   3.9572   3.8 ------	UNKNOWN
193.7043   4.5495    3.6  39.9   13.3   4.6763   3.2 ------	UNKNOWN
154.5777 -39.6382    2.7  18.3  169.7   3.9454   4.2 ------	UNKNOWN
197.2291  21.8431    3.2  55.3    1.7  14.5867   3.6 ------	UNKNOWN
164.6585 -23.4562    0.4   0.0   -2.5  25.1609  26.0 ------	UNKNOWN
110.8739 -30.5827    2.7  48.0 -146.5   8.3652   4.3 ------	UNKNOWN
102.7020 -28.5964    6.7  55.3 -145.2  12.4943   1.7 ------	UNKNOWN
112.6008 -18.6085    3.0  48.6 -130.3  16.6039   3.9 ------	UNKNOWN