Analysis Summary
Notes:
- 1) No attempt has been made to eliminate the non-significant decimal places.
- 2) This batgrbproduct analysis is done using the HEASARC data.
- 3) This batgrbproduct analysis is using the flight position for the mask-weighting calculation.
======================================================================
                  BAT GRB EVENT DATA PROCESSING REPORT
    Process Script Ver: batgrbproduct v2.46
    Process Start Time: Mon Jan 13 21:47:13 EST 2014
             Host Name: batevent1
   Current Working Dir: /local/data/batevent/batevent_reproc/trigger457330
======================================================================

  Trigger: 00457330      Segment: 000

  BAT Trigger Time: 332428438.144   [s; MET]
      Trigger Stop: 332428438.272   [s; MET]
               UTC: 2011-07-15T13:13:50.984920    [includes UTCF correction]
       Where From?: TDRSS position message

  BAT
    RA: 237.659654001492   Dec: -46.2333229577073  [deg; J2000]

     Catalogged Source?: NO
     Point Source?:      YES
     GRB Indicated?:     YES    [ by BAT flight software ]
     Image S/N Ratio:    11.86
     Image Trigger?:     NO
     Rate S/N Ratio:     31.3368792319848  [ if not an image trigger ]
     Image S/N Ratio:    11.86

  Analysis Position:   [ source = BAT ]
    RA: 237.659654001492   Dec: -46.2333229577073  [deg; J2000]

  Refined Position:   [ source = BAT pre-slew burst ]
    RA: 237.665769488008   Dec: -46.2375908016376  [deg; J2000]
        { 15h 50m 39.8s , -46d 14' 15.3" }
         +/- 0.450268743488261 [arcmin] (estimated 90% radius based on SNR)
         +/- 0.10565224314534 [arcmin] (formal 1-sigma fit error)
    SNR: 95.0952151054125

  Angular difference between the analysis and refined position is 0.360539 arcmin

  Partial Coding Fraction: 0.6953125    [ including projection effects ]

  Duration
     T90: 13 +/- 4
        Measured from: -0.143999993801117
                   to: 12.8560000061989     [s; relative to TRIGTIME]
     T50: 2 +/- 1
        Measured from: 0.856000006198883
                   to: 2.85600000619888     [s; relative to TRIGTIME]


  Fluence
     Peak Flux  (peak 1 second)
        Measured from: 1.85600000619888
                   to: 2.85600000619888     [s; relative to TRIGTIME]
     Total Fluence
        Measured from: -3.14399999380112
                   to: 20.8560000061989     [s; relative to TRIGTIME]

             Band 1     Band 2     Band 3     Band 4
              15-25      25-50     50-100    100-350     keV
 Total     4.799154   7.256515   5.410025   1.234916
           0.058570   0.061121   0.054070   0.036898 [error]
 Peak      1.381682   2.335981   2.072765   0.546849
           0.022660   0.028406   0.027690   0.016639 [error]

     [ fluence units of on-axis counts / fully illuminated detector ]

======================================================================


====== Table of the duration information =============================

        Value   tstart    tstop
T100   24.000   -3.144   20.856
T90    13.000   -0.144   12.856
T50     2.000    0.856    2.856
Peak    1.000    1.856    2.856


====== Spectral Analysis Summary =====================================

Model      : spectral model: simple power-law (PL) and cutoff power-law (CPL)
Ph_index   : photon index: E^{Ph_index}
Ph_90err   : 90% error of the photon index
Epeak      : Epeak in keV
Epeak_90err: 90% error of Epeak
Norm       : normalization at 50 keV in both the PL model and CPL model
Nomr_90err : 90% error of the normalization
chi2       : Chi-Squared
dof        : degree of freedo

=== Time-averaged spectral analysis ===
(Best model with acceptable fit: N/A)

Model Ph_index Ph_90err_low Ph_90err_hi  Epeak  Epeak_90err_low  Epeak_90err_hi  Norm       Nomr_90err_low    Norm_90err_hi    chi2    dof
PL      -1.626    -0.027      0.027       -           -               -         5.35e-02     -8.10e-04          8.09e-04      81.480   57
CPL     -1.254    -0.115      0.118      119.804     -14.970        26.597      7.68e-02     -7.93e-03          9.04e-03      49.570   56


=== 1-s peak spectral analysis ===
(Best model with acceptable fit: CPL)

Model Ph_index Ph_90err_low Ph_90err_hi  Epeak  Epeak_90err_low  Epeak_90err_hi  Norm       Nomr_90err_low    Norm_90err_hi    chi2    dof
PL      -1.388     -0.031     0.031       -           -               -         4.44e-01     -7.85e-03          7.85e-03      81.240   57
CPL     -0.985     -0.129     0.133      151.992     -23.021        42.255      6.56e-01     -7.55e-02          8.75e-02      51.460   56


=== Fluence/Peak Flux Summary ===

              Model    Band1     Band2     Band3     Band4     Band5     Total
                       15-25     25-50    50-100    100-350    15-150    15-350    keV
Fluence         PL   1.85e-06  3.14e-06  4.07e-06  1.07e-05  1.20e-05  1.97e-05   erg/cm2
      90%_error_low -5.92e-08 -6.02e-08 -6.61e-08 -3.90e-07 -1.77e-07 -4.14e-07   erg/cm2
      90%_error_hi   6.00e-08  6.01e-08  6.60e-08  3.99e-07  1.77e-07  4.20e-07   erg/cm2
Peak flux       PL   3.20e-03  4.08e-02  4.44e-01  4.02e+01  1.26e+00  4.04e+01   ph/cm2/s
      90%_error_low     N/A       N/A       N/A       N/A       N/A       N/A     ph/cm2/s
      90%_error_hi      N/A       N/A       N/A       N/A       N/A       N/A     ph/cm2/s

Fluence        CPL   1.87e-06  2.53e-06  2.63e-06  6.08e-06  8.78e-06  1.33e-05   erg/cm2
      90%_error_low    N/A       N/A       N/A       N/A       N/A       N/A      erg/cm2
      90%_error_hi     N/A       N/A       N/A       N/A       N/A       N/A      erg/cm2
Peak flux      CPL   1.45e+01  1.78e+01  1.42e+01  1.22e+01  5.24e+01  5.87e+01   ph/cm2/s
      90%_error_low -8.01e-01 -4.17e-01 -3.32e-01 -1.14e+00 -1.16e+00 -1.74e+00   ph/cm2/s
      90%_error_hi   8.19e-01  4.17e-01  3.33e-01  1.29e+00  1.16e+00  1.84e+00   ph/cm2/s

======================================================================
Image
Pre-slew 15.0-350.0 keV image (Event data)
#   RAcent    DECcent   POSerr    Theta     Phi              Peak Cts       SNR   Name
  237.6658   -46.2376   0.0020    34.1186  -179.1173        18.1301494     95.095 TRIG_00457330

Foreground time interval of the image:
 -3.144  12.157 (delta_t =  15.301 [sec])
Background time interval of the image:
-239.144  -3.144 (delta_t = 236.000 [sec])
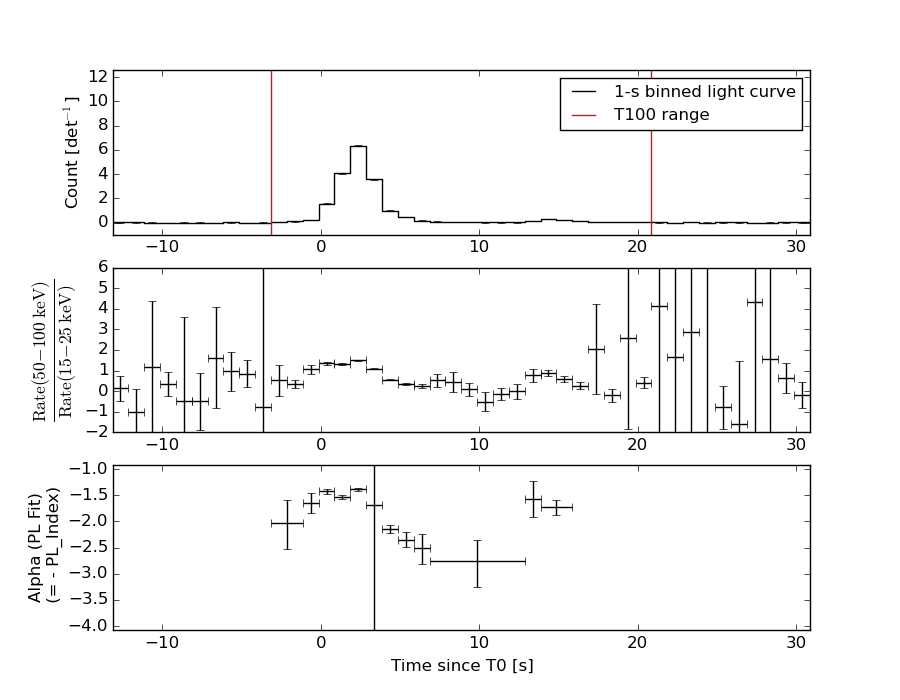
Light Curves
Note: The mask-weighted lightcurves have units of either count/det or counts/sec/det, where a det is 0.4 x 0.4 = 0.16 sq cm.
Full-time range; 1 s binning
Other quick-look light curves:
- 64 ms binning (zoomed)
- 16 ms binning (zoomed)
- 8 ms binning (zoomed)
- 2 ms binning (zoomed)
- SN=5 or 10 s binning (full-time range)
- Raw light curve
Spectra
- 64 ms binning (zoomed)
- 16 ms binning (zoomed)
- 8 ms binning (zoomed)
- 2 ms binning (zoomed)
- SN=5 or 10 s binning (full-time range)
- Raw light curve
Spectra
Notes:
- 1) The fitting includes the systematic errors.
- 2) When the burst includes telescope slew time periods, the fitting uses an average response file made from multiple 5-s response files through out the slew time plus single time preiod for the non-slew times, and weighted by the total counts in the corresponding time period using addrmf. An average response file is needed becuase a spectral fit using the pre-slew DRM will introduce some errors in both a spectral shape and a normalization if the PHA file contains a lot of the slew/post-slew time interval.
- 3) For fits to more complicated models (e.g. a power-law over a cutoff power-law), the BAT team has decided to require a chi-square improvement of more than 6 for each extra dof.
Time averaged spectrum fit using the average DRM
Power-law model
Time interval is from   -3.144 sec. to   20.856 sec.

Spectral model in power-law:
------------------------------------------------------------
Parameters  : value       lower 90%   higher 90%
Photon index: -1.62609     ( -0.0271072   0.0271605 )
Norm@50keV  : 5.35106E-02    ( -0.000809795   0.000809292 )
------------------------------------------------------------
#Fit statistic : Chi-Squared =          81.48 using 59 PHA bins.
# Reduced chi-squared =          1.429 for     57 degrees of freedom
# Null hypothesis probability =   1.837607e-02

Photon flux (15-150 keV)    in 24 sec: 6.93336 ( -0.13118  0.1317 ) ph/cm2/s
Energy fluence (15-150 keV)             : 1.1976e-05 ( -1.77355e-07  1.76961e-07 ) ergs/cm2
Cutoff power-law model
Time interval is from   -3.144 sec. to   20.856 sec.
Spectral model in the cutoff power-law:
------------------------------------------------------------
Parameters  : value       lower 90%   higher 90%
Photon index: -1.2539     ( -0.114996   0.117752 )
Epeak [keV] : 119.804      ( -14.9703 26.5974 )
Norm@50keV  : 7.68032E-02    ( -0.00792599   0.00903762 )
------------------------------------------------------------
#Fit statistic : Chi-Squared =          49.57 using 59 PHA bins.
# Reduced chi-squared =         0.8853 for     56 degrees of freedom
# Null hypothesis probability =   7.151320e-01

Photon flux (15-150 keV)    in 24 sec: 6.69518 ( -0.14597  0.14702 ) ph/cm2/s
Energy fluence (15-150 keV)             : 8.7773e-06 ( 0  0 ) ergs/cm2
1-s peak spectrum fit
Power-law model
Time interval is from    1.856 sec. to    2.856 sec.

Spectral model in power-law:
------------------------------------------------------------
Parameters  : value       lower 90%   higher 90%
Photon index: -1.38766     ( -0.030819   0.0308685 )
Norm@50keV  : 0.443734    ( -0.00785242   0.00784781 )
------------------------------------------------------------
#Fit statistic : Chi-Squared =          81.24 using 59 PHA bins.
# Reduced chi-squared =          1.425 for     57 degrees of freedom
# Null hypothesis probability =   1.918626e-02

Photon flux (15-150 keV)    in 1 sec: 1.26213 (    ) ph/cm2/s
Energy fluence (15-150 keV)             : 4.29912e-06 ( -7.58388e-08  7.58996e-08 ) ergs/cm2
Cutoff power-law model
Time interval is from    1.856 sec. to    2.856 sec.
Spectral model in the cutoff power-law:
------------------------------------------------------------
Parameters  : value       lower 90%   higher 90%
Photon index: -0.984887     ( -0.129127   0.132731 )
Epeak [keV] : 151.992      ( -23.0216 42.2547 )
Norm@50keV  : 0.656164    ( -0.0755282   0.0875334 )
------------------------------------------------------------
#Fit statistic : Chi-Squared =          51.46 using 59 PHA bins.
# Reduced chi-squared =         0.9189 for     56 degrees of freedom
# Null hypothesis probability =   6.473052e-01

Photon flux (15-150 keV)    in 1 sec: 52.4184 ( -1.1578  1.1632 ) ph/cm2/s
Energy fluence (15-150 keV)             : 4.24307e-06 ( -7.85016e-08  7.8385e-08 ) ergs/cm2
Time-resolved spectra
Distribution
T90 vs. Hardness ratio plot
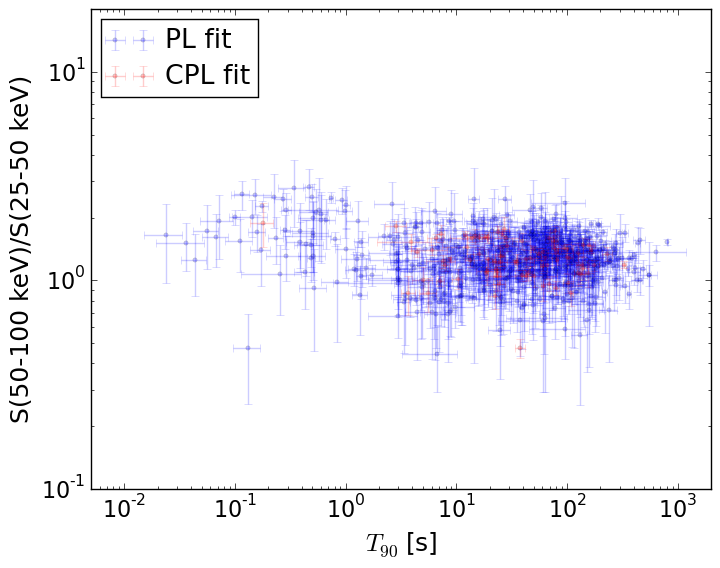
T90                                   = N/A sec.
Hardness ratio (energy fluence ratio) = N/A
S(15-50 keV) vs. S(50-150 keV) plot
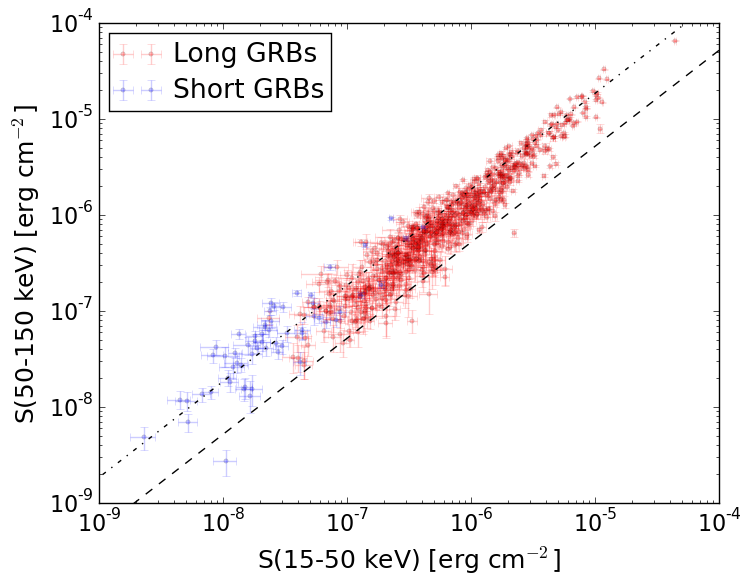
S(15-50 keV)  = N/A
S(50-150 keV) = N/A
The dash-dotted line and the dashed line traces the fluences calculated from the Band function with Epeak = 15 and 150 keV, respectively. Both lines assume a canonical values of alpha = -1 and beta = -2.5.
Mask shadow pattern
IMX = -6.774431003054280E-01, IMY = 1.043730559904359E-02
Spacecraft aspect plot
Bright source in the pre-burst/pre-slew/post-slew images
Pre-burst image of 15-350 keV band
Time interval of the image:
-239.144000 -3.144000

# RAcent  DECcent POSerr Theta    Phi  PeakCts   SNR AngSep     Name
#  [deg]    [deg]    ['] [deg]  [deg]                   [']
244.9759 -15.6349    0.2   9.4 -114.0  12.6353  49.6    0.4	Sco X-1
254.4514  35.3461   80.9  50.6  -20.6   0.0889   0.1    0.4	Her X-1
255.8180 -37.9106    6.1  22.7  157.4  -0.5239  -1.9    8.9	4U 1700-377
256.3149 -36.4169    3.3  21.2  156.1   0.9848   3.5    5.8	GX 349+2
263.0014 -24.7345    1.5  12.3  121.7   1.7531   7.7    0.8	GX 1+4
264.9986 -44.3398    0.0  30.4  145.1   0.4483   1.2   12.8	4U 1735-44
268.3392  -1.4427    6.2  19.3   25.2   0.5060   1.9    1.8	SW J1753.5-0127
270.1788 -25.0501    4.0  17.5  106.2   0.8694   2.9    6.0	GX 5-1
270.4883 -25.6987    7.5  18.1  107.5   0.4606   1.5   10.4	GRS 1758-258
273.9782 -14.0630    2.5  18.7   68.6   1.3364   4.7    2.3	GX 17+2
275.7514 -30.4809    4.2  24.6  111.6   1.0459   2.7   11.3	H1820-303
284.9912 -25.0456    6.7  30.0   93.6   0.8327   1.7    7.9	HT1900.1-2455
288.8191  10.9305    2.4  42.7   33.9   3.1533   4.7    1.5	GRS 1915+105
263.0316 -33.8163    4.0  20.0  139.2   0.8734   2.9    2.4	GX 354-0
213.5264 -54.4899    2.7  50.5 -170.6   2.7319   4.2 ------	UNKNOWN
205.0959 -30.0001    3.2  47.7 -137.2   2.9929   3.7 ------	UNKNOWN
197.0256 -37.2077    3.8  55.3 -145.3   6.2462   3.0 ------	UNKNOWN
204.4254 -23.8536    3.0  47.9 -128.9   5.5170   3.9 ------	UNKNOWN
Pre-slew background subtracted image of 15-350 keV band
Time interval of the image:
-3.144000 12.156590

# RAcent  DECcent POSerr Theta    Phi  PeakCts   SNR AngSep     Name
#  [deg]    [deg]    ['] [deg]  [deg]                   [']
244.8959 -15.4444    0.0   9.5 -112.8  -0.2589  -1.8   12.7	Sco X-1
254.4768  35.4663    8.1  50.7  -20.6   0.5486   1.4    7.5	Her X-1
256.2242 -37.7494    0.0  22.5  156.6  -0.3509  -2.0   12.6	4U 1700-377
256.4726 -36.5889   12.0  21.4  155.8  -0.1698  -1.0   10.1	GX 349+2
263.0053 -24.7902    6.4  12.3  121.8   0.2656   1.8    2.7	GX 1+4
264.5793 -44.5732   12.3  30.5  145.8  -0.1998  -0.9   10.2	4U 1735-44
268.5464  -1.3585    0.0  19.5   25.5   0.1109   0.7   12.1	SW J1753.5-0127
270.1244 -25.0563   17.8  17.5  106.3   0.1224   0.6    8.8	GX 5-1
270.2634 -25.8132    5.2  18.0  108.2   0.3945   2.2    4.7	GRS 1758-258
273.8953 -13.8552    0.0  18.6   67.9   0.2505   1.4   12.6	GX 17+2
275.7674 -30.3042    3.9  24.5  111.3  -0.6309  -2.9    9.0	H1820-303
284.8758 -25.0289    6.8  29.9   93.6  -0.4651  -1.7   10.9	HT1900.1-2455
288.9424  11.0300    0.0  42.9   33.9   1.2189   2.7    9.9	GRS 1915+105
263.1301 -33.9411   23.1  20.2  139.1  -0.0910  -0.5    9.5	GX 354-0
294.7818 -25.7261    2.7  38.8   92.0   3.0225   4.3 ------	UNKNOWN
292.6632 -11.0880    2.3  37.1   68.0   2.4822   5.0 ------	UNKNOWN
289.8841   5.8885    2.6  40.7   41.1   1.7858   4.4 ------	UNKNOWN
237.6658 -46.2376    0.1  34.1 -179.1  18.1304  95.1 ------	UNKNOWN
209.7835 -57.0824    2.4  53.7 -171.9   2.0961   4.8 ------	UNKNOWN
267.1347  40.5871    3.9  57.0   -9.1   2.2358   3.0 ------	UNKNOWN
249.9193  43.5161    3.4  58.9  -24.4   3.4301   3.4 ------	UNKNOWN
Post-slew image of 15-350 keV band
Time interval of the image:
79.356600 501.456600

# RAcent  DECcent POSerr Theta    Phi  PeakCts   SNR AngSep     Name
#  [deg]    [deg]    ['] [deg]  [deg]                   [']
170.2965 -60.6354   12.7  40.6 -127.4   0.8368   0.9    0.9	Cen X-3
186.7651 -62.7369    4.7  32.7 -130.3   1.4109   2.4    3.6	GX 301-2
244.9809 -15.6344    0.3  31.2   22.3  21.1650  40.0    0.4	Sco X-1
255.9401 -38.0119   29.0  15.8   73.9  -0.1680  -0.4   10.3	4U 1700-377
256.5531 -36.4219    4.5  17.2   70.6   1.0623   2.5    5.7	GX 349+2
263.1110 -24.7210    2.4  29.6   60.8   3.4139   4.8    5.8	GX 1+4
264.9247 -44.5409    6.0  19.1  103.5   0.9056   1.9    9.5	4U 1735-44
270.2357 -25.0572    5.1  33.5   70.7   1.9984   2.3    2.9	GX 5-1
270.2906 -25.8146    5.9  33.0   71.7   1.6586   2.0    4.3	GRS 1758-258
275.8493 -30.3976   16.2  33.4   83.9   0.6532   0.7    4.3	H1820-303
263.0990 -33.7645    5.6  23.0   74.8   1.1119   2.1    6.9	GX 354-0
259.8699 -75.7730    3.7  31.0  178.1   1.4821   3.1 ------	UNKNOWN
184.5608 -60.3252    3.7  33.6 -125.8   1.9239   3.1 ------	UNKNOWN
180.2895 -57.3008    3.5  36.0 -120.8   2.5517   3.3 ------	UNKNOWN
126.8570 -67.1539    4.7  55.3 -145.3   9.0359   2.5 ------	UNKNOWN
127.5583 -66.9381    5.6  55.2 -144.9   7.3849   2.2 ------	UNKNOWN
185.2502 -34.2109    3.2  41.0  -83.7   9.1202   3.7 ------	UNKNOWN