Analysis Summary
Notes:
- 1) No attempt has been made to eliminate the non-significant decimal places.
- 2) This batgrbproduct analysis is done using the HEASARC data.
- 3) This batgrbproduct analysis is using the flight position for the mask-weighting calculation.
======================================================================
                  BAT GRB EVENT DATA PROCESSING REPORT
    Process Script Ver: batgrbproduct v2.46
    Process Start Time: Mon Jan 13 21:41:13 EST 2014
             Host Name: batevent1
   Current Working Dir: /local/data/batevent/batevent_reproc/trigger457553
======================================================================

  Trigger: 00457553      Segment: 000

  BAT Trigger Time: 332748559.04   [s; MET]
      Trigger Stop: 332748562.112   [s; MET]
               UTC: 2011-07-19T06:09:11.868540    [includes UTCF correction]
       Where From?: TDRSS position message

  BAT
    RA: 24.5635253949573   Dec: 34.5721395739793  [deg; J2000]

     Catalogged Source?: NO
     Point Source?:      YES
     GRB Indicated?:     YES    [ by BAT flight software ]
     Image S/N Ratio:    7.49
     Image Trigger?:     NO
     Rate S/N Ratio:     10.295630140987  [ if not an image trigger ]
     Image S/N Ratio:    7.49

  Analysis Position:   [ source = BAT ]
    RA: 24.5635253949573   Dec: 34.5721395739793  [deg; J2000]

  Refined Position:   [ source = BAT pre-slew burst ]
    RA: 24.5780256402192   Dec: 34.5752863203935  [deg; J2000]
        { 01h 38m 18.7s , +34d 34' 31.0" }
         +/- 1.55676516608891 [arcmin] (estimated 90% radius based on SNR)
         +/- 0.561395910584576 [arcmin] (formal 1-sigma fit error)
    SNR: 16.1627011849492

  Angular difference between the analysis and refined position is 0.740830 arcmin

  Partial Coding Fraction: 0.3085938    [ including projection effects ]

  Duration
     T90: 41.227999985218 +/- 9.59850761999267
        Measured from: -1.02000004053116
                   to: 40.2079999446869     [s; relative to TRIGTIME]
     T50: 22.5159999728203 +/- 4.45701697537329
        Measured from: 4.97599995136261
                   to: 27.4919999241829     [s; relative to TRIGTIME]


  Fluence
     Peak Flux  (peak 1 second)
        Measured from: 2.01599997282028
                   to: 3.01599997282028     [s; relative to TRIGTIME]
     Total Fluence
        Measured from: -2.36400002241135
                   to: 53.7159999608994     [s; relative to TRIGTIME]

             Band 1     Band 2     Band 3     Band 4
              15-25      25-50     50-100    100-350     keV
 Total     0.901103   1.190309   0.772925   0.146143
           0.086965   0.092097   0.084442   0.079513 [error]
 Peak      0.055737   0.027598   0.054838   0.009708
           0.012051   0.013296   0.012344   0.010860 [error]

     [ fluence units of on-axis counts / fully illuminated detector ]

======================================================================


====== Table of the duration information =============================

        Value   tstart    tstop
T100   56.080   -2.364   53.716
T90    41.228   -1.020   40.208
T50    22.516    4.976   27.492
Peak    1.000    2.016    3.016


====== Spectral Analysis Summary =====================================

Model      : spectral model: simple power-law (PL) and cutoff power-law (CPL)
Ph_index   : photon index: E^{Ph_index}
Ph_90err   : 90% error of the photon index
Epeak      : Epeak in keV
Epeak_90err: 90% error of Epeak
Norm       : normalization at 50 keV in both the PL model and CPL model
Nomr_90err : 90% error of the normalization
chi2       : Chi-Squared
dof        : degree of freedo

=== Time-averaged spectral analysis ===
(Best model with acceptable fit: PL)

Model Ph_index Ph_90err_low Ph_90err_hi  Epeak  Epeak_90err_low  Epeak_90err_hi  Norm       Nomr_90err_low    Norm_90err_hi    chi2    dof
PL      -1.742    -0.162      0.158       -           -               -         3.68e-03     -3.60e-04          3.56e-04      45.880   57
CPL     -1.400    -0.466      0.686       81.339     -22.456       -81.339      5.62e-03     -2.23e-03          7.40e-03      44.940   56


=== 1-s peak spectral analysis ===
(Best model with acceptable fit: PL)

Model Ph_index Ph_90err_low Ph_90err_hi  Epeak  Epeak_90err_low  Epeak_90err_hi  Norm       Nomr_90err_low    Norm_90err_hi    chi2    dof
PL      -1.706     -0.618     0.530       -           -               -         9.48e-03     -3.15e-03          2.81e-03      48.330   57
CPL     -1.743     -2.246     0.735     9999.360      N/A           N/A         9.27e-03        N/A               N/A         48.350   56


=== Fluence/Peak Flux Summary ===

              Model    Band1     Band2     Band3     Band4     Band5     Total
                       15-25     25-50    50-100    100-350    15-150    15-350    keV
Fluence         PL   3.31e-07  5.25e-07  6.27e-07  1.46e-06  1.91e-06  2.94e-06   erg/cm2
      90%_error_low -4.57e-08 -4.68e-08 -8.24e-08 -3.61e-07 -1.92e-07 -4.44e-07   erg/cm2
      90%_error_hi   4.72e-08  4.68e-08  8.24e-08  4.33e-07  1.94e-07  4.99e-07   erg/cm2
Peak flux       PL   4.75e-01  4.24e-01  2.60e-01  2.42e-01  1.26e+00  1.40e+00   ph/cm2/s
      90%_error_low -2.04e-01 -1.17e-01 -1.12e-01 -1.60e-01 -3.40e-01 -3.80e-01   ph/cm2/s
      90%_error_hi   2.27e-01  1.15e-01  1.05e-01  2.64e-01  3.40e-01  3.85e-01   ph/cm2/s

Fluence        CPL   3.17e-07  5.46e-07  6.33e-07  8.38e-07  1.85e-06  2.33e-06   erg/cm2
      90%_error_low -5.23e-08 -5.90e-08 -8.73e-08 -5.04e-07 -2.18e-07 -5.56e-07   erg/cm2
      90%_error_hi   5.29e-08  6.13e-08  8.76e-08  7.43e-07  2.18e-07  8.06e-07   erg/cm2
Peak flux      CPL   4.91e-01  4.20e-01  2.53e-01  2.45e-01  1.28e+00  1.39e+00   ph/cm2/s
      90%_error_low -2.23e-01 -1.16e-01 -2.00e-01 -1.44e-01 -3.55e-01 -3.73e-01   ph/cm2/s
      90%_error_hi   2.34e-01  1.18e-01  -3.24e-02  2.59e-01  3.27e-01  3.86e-01   ph/cm2/s

======================================================================
Image
Pre-slew 15.0-350.0 keV image (Event data)
#   RAcent    DECcent   POSerr    Theta     Phi              Peak Cts       SNR   Name
   24.5780    34.5753   0.0119    43.5513   166.9462         2.8893371     16.163 TRIG_00457553

Foreground time interval of the image:
 -2.364  40.061 (delta_t =  42.425 [sec])
Background time interval of the image:
-239.040  -2.364 (delta_t = 236.676 [sec])
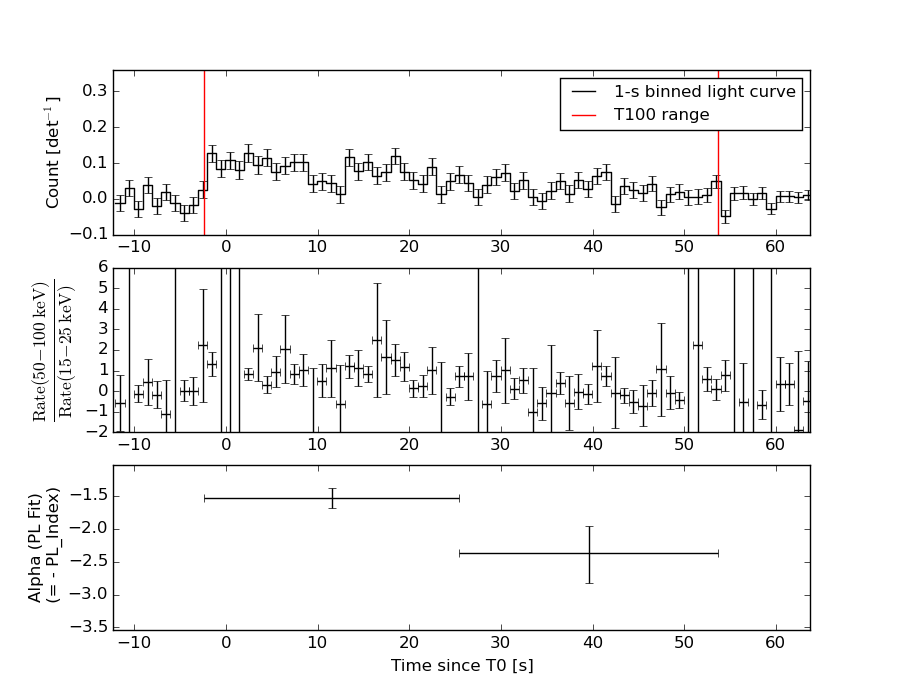
Light Curves
Note: The mask-weighted lightcurves have units of either count/det or counts/sec/det, where a det is 0.4 x 0.4 = 0.16 sq cm.
Full-time range; 1 s binning
Other quick-look light curves:
- 64 ms binning (zoomed)
- 16 ms binning (zoomed)
- 8 ms binning (zoomed)
- 2 ms binning (zoomed)
- SN=5 or 10 s binning (full-time range)
- Raw light curve
Spectra
- 64 ms binning (zoomed)
- 16 ms binning (zoomed)
- 8 ms binning (zoomed)
- 2 ms binning (zoomed)
- SN=5 or 10 s binning (full-time range)
- Raw light curve
Spectra
Notes:
- 1) The fitting includes the systematic errors.
- 2) When the burst includes telescope slew time periods, the fitting uses an average response file made from multiple 5-s response files through out the slew time plus single time preiod for the non-slew times, and weighted by the total counts in the corresponding time period using addrmf. An average response file is needed becuase a spectral fit using the pre-slew DRM will introduce some errors in both a spectral shape and a normalization if the PHA file contains a lot of the slew/post-slew time interval.
- 3) For fits to more complicated models (e.g. a power-law over a cutoff power-law), the BAT team has decided to require a chi-square improvement of more than 6 for each extra dof.
Time averaged spectrum fit using the average DRM
Power-law model
Time interval is from   -2.364 sec. to   53.716 sec.

Spectral model in power-law:
------------------------------------------------------------
Parameters  : value       lower 90%   higher 90%
Photon index: -1.74211     ( -0.16169   0.157552 )
Norm@50keV  : 3.67986E-03    ( -0.000360298   0.000355666 )
------------------------------------------------------------
#Fit statistic : Chi-Squared =          45.88 using 59 PHA bins.
# Reduced chi-squared =         0.8049 for     57 degrees of freedom
# Null hypothesis probability =   8.541771e-01

Photon flux (15-150 keV)    in 56.08 sec: 0.496163 ( -0.044616  0.044667 ) ph/cm2/s
Energy fluence (15-150 keV)             : 1.90545e-06 ( -1.92253e-07  1.94493e-07 ) ergs/cm2
Cutoff power-law model

Time interval is from   -2.364 sec. to   53.716 sec.
Spectral model in the cutoff power-law:
------------------------------------------------------------
Parameters  : value       lower 90%   higher 90%
Photon index: -1.40028     ( -0.466362   0.685662 )
Epeak [keV] : 81.3390      ( -22.4561 -81.339 )
Norm@50keV  : 5.61911E-03    ( -0.00222577   0.00739584 )
------------------------------------------------------------
#Fit statistic : Chi-Squared =          44.94 using 59 PHA bins.
# Reduced chi-squared =         0.8024 for     56 degrees of freedom
# Null hypothesis probability =   8.552891e-01

Photon flux (15-150 keV)    in 56.08 sec: 0.488913 ( -0.046421  0.046376 ) ph/cm2/s
Energy fluence (15-150 keV)             : 1.84849e-06 ( -2.1819e-07  2.1764e-07 ) ergs/cm2
1-s peak spectrum fit
Power-law model
Time interval is from    2.016 sec. to    3.016 sec.

Spectral model in power-law:
------------------------------------------------------------
Parameters  : value       lower 90%   higher 90%
Photon index: -1.70554     ( -0.617752   0.530289 )
Norm@50keV  : 9.47512E-03    ( -0.00314478   0.00281424 )
------------------------------------------------------------
#Fit statistic : Chi-Squared =          48.33 using 59 PHA bins.
# Reduced chi-squared =         0.8478 for     57 degrees of freedom
# Null hypothesis probability =   7.865216e-01

Photon flux (15-150 keV)    in 1 sec: 1.26091 ( -0.339865  0.33992 ) ph/cm2/s
Energy fluence (15-150 keV)             : 8.77021e-08 ( -2.85269e-08  2.89923e-08 ) ergs/cm2
Cutoff power-law model
Time interval is from    2.016 sec. to    3.016 sec.
Spectral model in the cutoff power-law:
------------------------------------------------------------
Parameters  : value       lower 90%   higher 90%
Photon index: -3.5208     ( -0.46349   2.51691 )
Epeak [keV] : 401.963      (   )
Norm@50keV  : 1.34941E-03    (     )
------------------------------------------------------------
#Fit statistic : Chi-Squared =          47.00 using 59 PHA bins.
# Reduced chi-squared =         0.8393 for     56 degrees of freedom
# Null hypothesis probability =   7.986004e-01

Photon flux (15-150 keV)    in 1 sec: 1.27755 ( -0.355489  0.3267 ) ph/cm2/s
Energy fluence (15-150 keV)             : 6.14002e-08 ( -3.66687e-08  3.41364e-08 ) ergs/cm2
Time-resolved spectra
Distribution
T90 vs. Hardness ratio plot
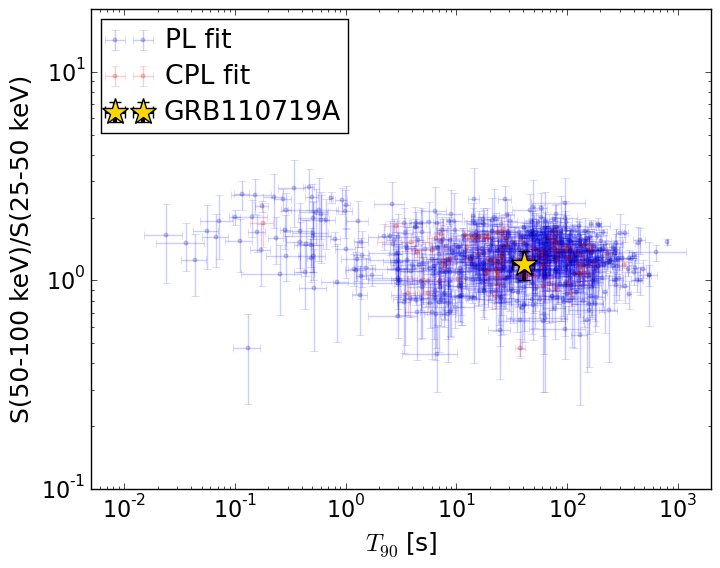
T90                                   = 41.228 sec.
Hardness ratio (energy fluence ratio) = 1.19574854466
S(15-50 keV) vs. S(50-150 keV) plot
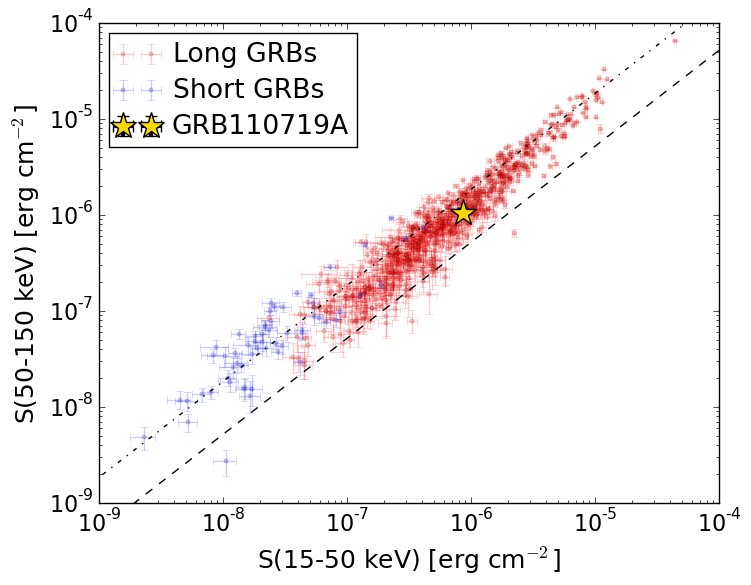
S(15-50 keV)  = 8.555578e-07
S(50-150 keV) = 1.0498383e-06
The dash-dotted line and the dashed line traces the fluences calculated from the Band function with Epeak = 15 and 150 keV, respectively. Both lines assume a canonical values of alpha = -1 and beta = -2.5.
Mask shadow pattern
IMX = -9.261000766324821E-01, IMY = -2.147233277370557E-01
Spacecraft aspect plot
Bright source in the pre-burst/pre-slew/post-slew images
Pre-burst image of 15-350 keV band
Time interval of the image:
-239.040000 -2.364000

# RAcent  DECcent POSerr Theta    Phi  PeakCts   SNR AngSep     Name
#  [deg]    [deg]    ['] [deg]  [deg]                   [']
 83.6306  22.0138    1.0  41.7 -111.1  10.0339  11.3    0.1	Crab
  7.0685  26.1634    2.3  49.6  144.6   5.3221   4.9 ------	UNKNOWN
 86.3766 -37.4145    2.0  49.0  -23.1   2.4962   5.7 ------	UNKNOWN
 96.0468 -20.4755    2.1  49.2  -48.2   5.5781   5.4 ------	UNKNOWN
Pre-slew background subtracted image of 15-350 keV band
Time interval of the image:
-2.364000 40.060600

# RAcent  DECcent POSerr Theta    Phi  PeakCts   SNR AngSep     Name
#  [deg]    [deg]    ['] [deg]  [deg]                   [']
 83.6700  21.9992   66.6  41.7 -111.1  -0.0547  -0.2    2.2	Crab
 24.5780  34.5753    0.7  43.6  166.9   2.8894  16.2 ------	UNKNOWN
 53.0237  46.8355    2.6  49.4 -159.8   0.7841   4.5 ------	UNKNOWN
Post-slew image of 15-350 keV band
Time interval of the image:
100.460600 567.260580

# RAcent  DECcent POSerr Theta    Phi  PeakCts   SNR AngSep     Name
#  [deg]    [deg]    ['] [deg]  [deg]                   [']
 53.5166  44.8928    2.5  24.4 -104.2   1.7021   4.6 ------	UNKNOWN
 85.1341  70.2417    3.6  47.9 -137.0   2.9407   3.2 ------	UNKNOWN
109.4127  77.4811    4.9  55.3 -145.2   5.5330   2.3 ------	UNKNOWN