Analysis Summary
Notes:
- 1) No attempt has been made to eliminate the non-significant decimal places.
- 2) This batgrbproduct analysis is done using the HEASARC data.
- 3) This batgrbproduct analysis is using the flight position for the mask-weighting calculation.
======================================================================
BAT GRB EVENT DATA PROCESSING REPORT
Process Script Ver: batgrbproduct v2.46
Process Start Time: Mon Jan 13 21:36:52 EST 2014
Host Name: batevent1
Current Working Dir: /local/data/batevent/batevent_reproc/trigger458059
======================================================================
Trigger: 00458059 Segment: 000
BAT Trigger Time: 333336647.744 [s; MET]
Trigger Stop: 333336648.768 [s; MET]
UTC: 2011-07-26T01:30:40.549800 [includes UTCF correction]
Where From?: TDRSS position message
BAT
RA: 286.750618690009 Dec: 56.0532972548459 [deg; J2000]
Catalogged Source?: NO
Point Source?: YES
GRB Indicated?: YES [ by BAT flight software ]
Image S/N Ratio: 8.6
Image Trigger?: NO
Rate S/N Ratio: 10.6770782520313 [ if not an image trigger ]
Image S/N Ratio: 8.6
Analysis Position: [ source = BAT ]
RA: 286.750618690009 Dec: 56.0532972548459 [deg; J2000]
Refined Position: [ source = BAT pre-slew burst ]
RA: 286.713005323196 Dec: 56.069723645654 [deg; J2000]
{ 19h 06m 51.1s , +56d 04' 11.0" }
+/- 1.66426926961846 [arcmin] (estimated 90% radius based on SNR)
+/- 0.693414734794835 [arcmin] (formal 1-sigma fit error)
SNR: 14.6921270122615
Angular difference between the analysis and refined position is 1.599662 arcmin
Partial Coding Fraction: 1.015625 [ including projection effects ]
Duration
T90: 5.15599995851517 +/- 1.10730662075066
Measured from: -0.580000042915344
to: 4.57599991559982 [s; relative to TRIGTIME]
T50: 2.05599999427795 +/- 0.584564735156271
Measured from: 0.655999958515167
to: 2.71199995279312 [s; relative to TRIGTIME]
Fluence
Peak Flux (peak 1 second)
Measured from: 0.611999988555908
to: 1.61199998855591 [s; relative to TRIGTIME]
Total Fluence
Measured from: -0.864000022411346
to: 5.01199996471405 [s; relative to TRIGTIME]
Band 1 Band 2 Band 3 Band 4
15-25 25-50 50-100 100-350 keV
Total 0.150572 0.202839 0.103417 -0.010569
0.015323 0.015973 0.014201 0.013447 [error]
Peak 0.031689 0.064982 0.031691 -0.006386
0.006508 0.006909 0.005850 0.005530 [error]
[ fluence units of on-axis counts / fully illuminated detector ]
======================================================================
====== Table of the duration information =============================
Value tstart tstop
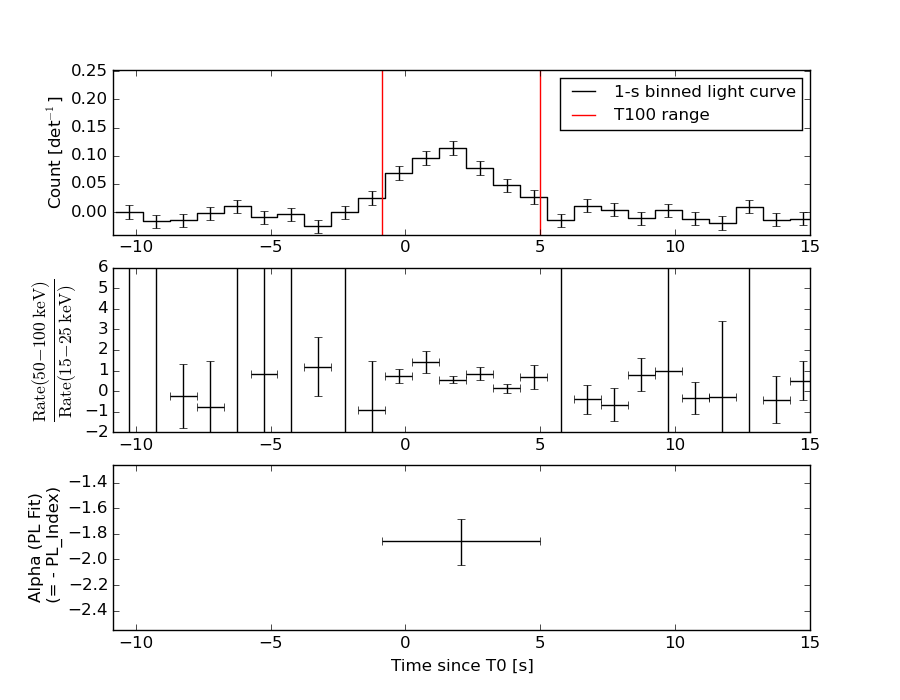
T100 5.876 -0.864 5.012
T90 5.156 -0.580 4.576
T50 2.056 0.656 2.712
Peak 1.000 0.612 1.612
====== Spectral Analysis Summary =====================================
Model : spectral model: simple power-law (PL) and cutoff power-law (CPL)
Ph_index : photon index: E^{Ph_index}
Ph_90err : 90% error of the photon index
Epeak : Epeak in keV
Epeak_90err: 90% error of Epeak
Norm : normalization at 50 keV in both the PL model and CPL model
Nomr_90err : 90% error of the normalization
chi2 : Chi-Squared
dof : degree of freedo
=== Time-averaged spectral analysis ===
(Best model with acceptable fit: N/A)
Model Ph_index Ph_90err_low Ph_90err_hi Epeak Epeak_90err_low Epeak_90err_hi Norm Nomr_90err_low Norm_90err_hi chi2 dof
PL -1.859 -0.182 0.174 - - - 4.54e-03 -5.55e-04 5.46e-04 87.710 57
CPL -0.638 -0.779 0.956 46.533 -8.109 15.556 2.29e-02 -1.46e-02 5.96e-02 79.850 56
=== 1-s peak spectral analysis ===
(Best model with acceptable fit: N/A)
Model Ph_index Ph_90err_low Ph_90err_hi Epeak Epeak_90err_low Epeak_90err_hi Norm Nomr_90err_low Norm_90err_hi chi2 dof
PL -1.646 -0.244 0.237 - - - 7.73e-03 -1.30e-03 1.28e-03 75.330 57
CPL 0.324 -1.216 1.734 49.985 -8.971 18.662 1.02e-01 -1.02e-01 9.46e-01 66.310 56
=== Fluence/Peak Flux Summary ===
Model Band1 Band2 Band3 Band4 Band5 Total
15-25 25-50 50-100 100-350 15-150 15-350 keV
Fluence PL 4.77e-08 7.05e-08 7.78e-08 1.61e-07 2.45e-07 3.57e-07 erg/cm2
90%_error_low -6.47e-09 -6.96e-09 -1.27e-08 -4.68e-08 -2.96e-08 -6.20e-08 erg/cm2
90%_error_hi 6.62e-09 6.96e-09 1.30e-08 5.82e-08 3.03e-08 7.10e-08 erg/cm2
Peak flux PL 3.66e-01 3.38e-01 2.16e-01 2.12e-01 1.01e+00 1.13e+00 ph/cm2/s
90%_error_low -7.71e-02 -5.07e-02 -4.53e-02 -7.43e-02 -1.50e-01 -1.75e-01 ph/cm2/s
90%_error_hi 8.03e-02 5.06e-02 4.59e-02 9.56e-02 1.50e-01 1.77e-01 ph/cm2/s
Fluence CPL 4.28e-08 8.11e-08 7.32e-08 2.79e-08 2.18e-07 2.25e-07 erg/cm2
90%_error_low -7.41e-09 -9.57e-09 -1.63e-08 -1.88e-08 -3.03e-08 -3.59e-08 erg/cm2
90%_error_hi 7.43e-09 9.90e-09 1.55e-08 4.98e-08 3.29e-08 5.76e-08 erg/cm2
Peak flux CPL 3.00e-01 4.20e-01 2.12e-01 2.79e-02 9.56e-01 9.59e-01 ph/cm2/s
90%_error_low -8.92e-02 -7.17e-02 -6.33e-02 -2.79e-02 -1.50e-01 -1.52e-01 ph/cm2/s
90%_error_hi 9.17e-02 7.68e-02 5.82e-02 6.31e-02 1.51e-01 1.56e-01 ph/cm2/s
======================================================================
Image
Pre-slew 15.0-350.0 keV image (Event data)
#   RAcent    DECcent   POSerr    Theta     Phi              Peak Cts       SNR   Name
  286.7130    56.0697   0.0131     9.5266  -163.6028         0.4344129     14.692 TRIG_00458059

Foreground time interval of the image:
 -0.864   5.012 (delta_t =   5.876 [sec])
Background time interval of the image:
-239.744  -0.864 (delta_t = 238.880 [sec])
Light Curves
Note: The mask-weighted lightcurves have units of either count/det or counts/sec/det, where a det is 0.4 x 0.4 = 0.16 sq cm.
Full-time range; 1 s binning
Other quick-look light curves:
- 64 ms binning (zoomed)
- 16 ms binning (zoomed)
- 8 ms binning (zoomed)
- 2 ms binning (zoomed)
- SN=5 or 10 s binning (full-time range)
- Raw light curve
Spectra
- 64 ms binning (zoomed)
- 16 ms binning (zoomed)
- 8 ms binning (zoomed)
- 2 ms binning (zoomed)
- SN=5 or 10 s binning (full-time range)
- Raw light curve
Spectra
Notes:
- 1) The fitting includes the systematic errors.
- 2) When the burst includes telescope slew time periods, the fitting uses an average response file made from multiple 5-s response files through out the slew time plus single time preiod for the non-slew times, and weighted by the total counts in the corresponding time period using addrmf. An average response file is needed becuase a spectral fit using the pre-slew DRM will introduce some errors in both a spectral shape and a normalization if the PHA file contains a lot of the slew/post-slew time interval.
- 3) For fits to more complicated models (e.g. a power-law over a cutoff power-law), the BAT team has decided to require a chi-square improvement of more than 6 for each extra dof.
Time averaged spectrum fit using the average DRM
Power-law model
Time interval is from   -0.864 sec. to    5.012 sec.

Spectral model in power-law:
------------------------------------------------------------
Parameters  : value       lower 90%   higher 90%
Photon index: -1.85879     ( -0.182257   0.173682 )
Norm@50keV  : 4.53612E-03    ( -0.000555106   0.000545827 )
------------------------------------------------------------
#Fit statistic : Chi-Squared =          87.71 using 59 PHA bins.
# Reduced chi-squared =          1.539 for     57 degrees of freedom
# Null hypothesis probability =   5.559035e-03

Photon flux (15-150 keV)    in 5.876 sec: 0.639925 ( -0.062785  0.062785 ) ph/cm2/s
Energy fluence (15-150 keV)             : 2.45099e-07 ( -2.95969e-08  3.03122e-08 ) ergs/cm2
Cutoff power-law model
Time interval is from   -0.864 sec. to    5.012 sec.
Spectral model in the cutoff power-law:
------------------------------------------------------------
Parameters  : value       lower 90%   higher 90%
Photon index: -0.63779     ( -0.779242   0.955678 )
Epeak [keV] : 46.5334      ( -8.10926 15.5559 )
Norm@50keV  : 2.28581E-02    ( -0.0145744   0.0595655 )
------------------------------------------------------------
#Fit statistic : Chi-Squared =          79.85 using 59 PHA bins.
# Reduced chi-squared =          1.426 for     56 degrees of freedom
# Null hypothesis probability =   1.987724e-02

Photon flux (15-150 keV)    in 5.876 sec: 0.612740 ( -0.064017  0.064339 ) ph/cm2/s
Energy fluence (15-150 keV)             : 2.17782e-07 ( -3.03424e-08  3.29337e-08 ) ergs/cm2
1-s peak spectrum fit
Power-law model
Time interval is from    0.612 sec. to    1.612 sec.

Spectral model in power-law:
------------------------------------------------------------
Parameters  : value       lower 90%   higher 90%
Photon index: -1.64607     ( -0.244939   0.236566 )
Norm@50keV  : 7.72695E-03    ( -0.00129603   0.00127831 )
------------------------------------------------------------
#Fit statistic : Chi-Squared =          75.33 using 59 PHA bins.
# Reduced chi-squared =          1.322 for     57 degrees of freedom
# Null hypothesis probability =   5.242713e-02

Photon flux (15-150 keV)    in 1 sec: 1.00768 ( -0.150367  0.15037 ) ph/cm2/s
Energy fluence (15-150 keV)             : 7.19118e-08 ( -1.26466e-08  1.29965e-08 ) ergs/cm2
Cutoff power-law model
Time interval is from    0.612 sec. to    1.612 sec.
Spectral model in the cutoff power-law:
------------------------------------------------------------
Parameters  : value       lower 90%   higher 90%
Photon index: 0.324333     ( -1.21814   1.73198 )
Epeak [keV] : 49.9851      ( -8.95647 18.6769 )
Norm@50keV  : 0.102287    ( -0.102599   0.945403 )
------------------------------------------------------------
#Fit statistic : Chi-Squared =          66.31 using 59 PHA bins.
# Reduced chi-squared =          1.184 for     56 degrees of freedom
# Null hypothesis probability =   1.630520e-01

Photon flux (15-150 keV)    in 1 sec: 0.956325 ( -0.15  0.151105 ) ph/cm2/s
Energy fluence (15-150 keV)             : 6.07337e-08 ( -1.18088e-08  1.34127e-08 ) ergs/cm2
Time-resolved spectra
Distribution
T90 vs. Hardness ratio plot
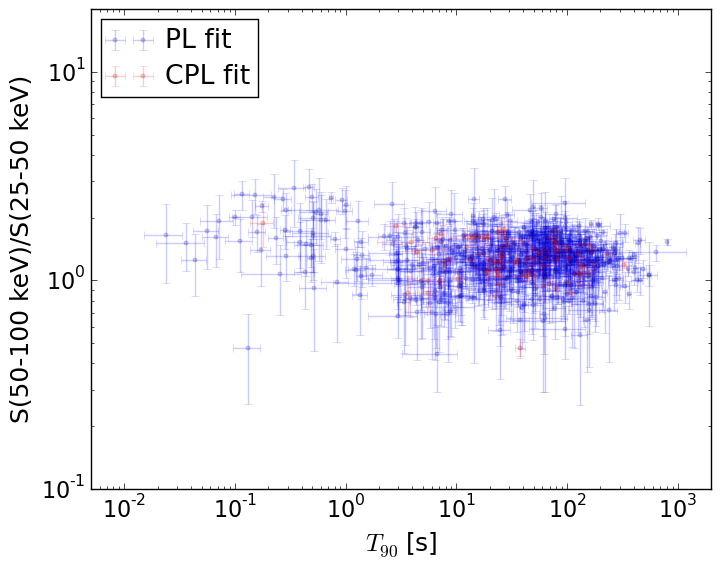
T90                                   = N/A sec.
Hardness ratio (energy fluence ratio) = N/A
S(15-50 keV) vs. S(50-150 keV) plot
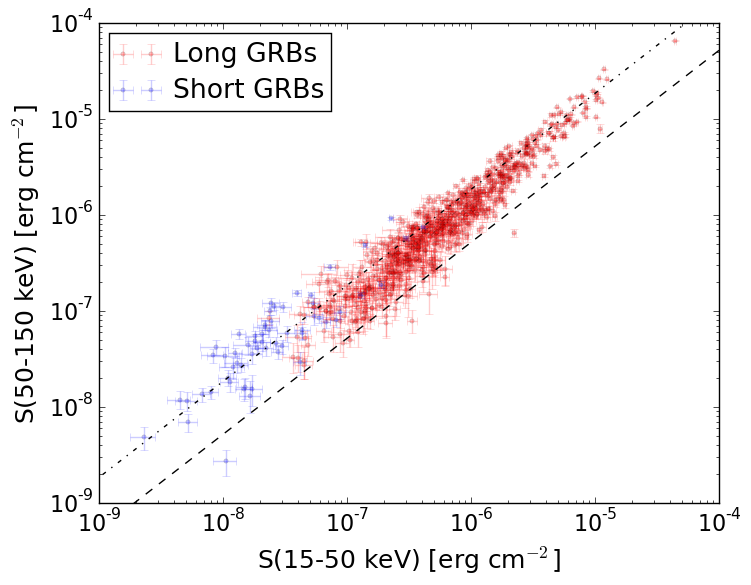
S(15-50 keV)  = N/A
S(50-150 keV) = N/A
The dash-dotted line and the dashed line traces the fluences calculated from the Band function with Epeak = 15 and 150 keV, respectively. Both lines assume a canonical values of alpha = -1 and beta = -2.5.
Mask shadow pattern
IMX = -1.609943794173015E-01, IMY = 4.737474650099357E-02
Spacecraft aspect plot
Bright source in the pre-burst/pre-slew/post-slew images
Pre-burst image of 15-350 keV band
Time interval of the image:
-239.744000 -0.864000

# RAcent  DECcent POSerr Theta    Phi  PeakCts   SNR AngSep     Name
#  [deg]    [deg]    ['] [deg]  [deg]                   [']
254.5628  35.3538   10.3  39.0  178.8  -0.4420  -1.1    5.2	Her X-1
299.5881  35.1897    0.4  21.2  109.5   9.2091  29.4    0.7	Cyg X-1
308.1466  40.8778    2.9  15.5   87.6   1.0248   3.9    4.8	Cyg X-3
326.1796  38.2292    6.6  23.3   50.7   0.5240   1.8    5.6	Cyg X-2
  5.9879  54.7754    3.7  34.0  -14.6   0.9265   3.1 ------	UNKNOWN
224.1782  31.5250    3.4  58.7 -159.1   6.6531   3.4 ------	UNKNOWN
Pre-slew background subtracted image of 15-350 keV band
Time interval of the image:
-0.864000 5.012000

# RAcent  DECcent POSerr Theta    Phi  PeakCts   SNR AngSep     Name
#  [deg]    [deg]    ['] [deg]  [deg]                   [']
254.3950  35.3527    4.1  39.1  179.0  -0.1262  -2.8    3.1	Her X-1
299.6568  35.3126    7.9  21.0  109.3  -0.0574  -1.5    7.4	Cyg X-1
308.2319  41.0237    4.8  15.4   87.2  -0.0863  -2.4    7.0	Cyg X-3
325.9986  38.3773    3.4  23.1   50.8   0.1288   3.4    8.8	Cyg X-2
286.7130  56.0697    0.8   9.5 -163.6   0.4344  14.7 ------	UNKNOWN
 19.0693  44.5821    2.2  46.8   -9.4   0.2953   5.2 ------	UNKNOWN
330.7708  70.2832    2.6  18.3  -51.1   0.1378   4.5 ------	UNKNOWN
 71.2681  76.4801    2.6  43.2  -64.5   0.4866   4.4 ------	UNKNOWN
Post-slew image of 15-350 keV band
Time interval of the image:
42.156600 742.956620

# RAcent  DECcent POSerr Theta    Phi  PeakCts   SNR AngSep     Name
#  [deg]    [deg]    ['] [deg]  [deg]                   [']
254.6029  35.2711    8.9  30.1  167.8   0.9609   1.3    8.3	Her X-1
299.5840  35.1941    0.3  22.6   79.7  28.6117  39.4    0.5	Cyg X-1
308.1558  40.9349    1.9  20.5   56.2   3.7929   6.1    2.3	Cyg X-3
326.2462  38.3649    7.8  31.5   35.2   1.1962   1.5    4.4	Cyg X-2
205.4748  37.3152    3.8  55.2 -145.3  16.5905   3.0 ------	UNKNOWN
197.5844  57.3915    3.2  45.3 -121.4   8.7783   3.6 ------	UNKNOWN