Analysis Summary
Notes:
- 1) No attempt has been made to eliminate the non-significant decimal places.
- 2) This batgrbproduct analysis is done using the HEASARC data.
- 3) This batgrbproduct analysis is using the flight position for the mask-weighting calculation.
======================================================================
BAT GRB EVENT DATA PROCESSING REPORT
Process Script Ver: batgrbproduct v2.46
Process Start Time: Mon Jan 13 21:23:47 EST 2014
Host Name: batevent1
Current Working Dir: /local/data/batevent/batevent_reproc/trigger458918
======================================================================
Trigger: 00458918 Segment: 000
BAT Trigger Time: 334477141.44 [s; MET]
Trigger Stop: 334477149.632 [s; MET]
UTC: 2011-08-08T06:18:54.201560 [includes UTCF correction]
Where From?: TDRSS position message
BAT
RA: 57.2642206519533 Dec: -44.1786208592457 [deg; J2000]
Catalogged Source?: NO
Point Source?: YES
GRB Indicated?: YES [ by BAT flight software ]
Image S/N Ratio: 7.19
Image Trigger?: NO
Rate S/N Ratio: 10 [ if not an image trigger ]
Image S/N Ratio: 7.19
Analysis Position: [ source = BAT ]
RA: 57.2642206519533 Dec: -44.1786208592457 [deg; J2000]
Refined Position: [ source = BAT pre-slew burst ]
RA: 57.3161099519403 Dec: -44.1874910933551 [deg; J2000]
{ 03h 49m 15.9s , -44d 11' 15.0" }
+/- 2.29524687581232 [arcmin] (estimated 90% radius based on SNR)
+/- 1.38573959706836 [arcmin] (formal 1-sigma fit error)
SNR: 9.28213331131464
Angular difference between the analysis and refined position is 2.295199 arcmin
Partial Coding Fraction: 0.765625 [ including projection effects ]
Duration
T90: 40.7040000557899 +/- 9.02859461372617
Measured from: 0.639999985694885
to: 41.3440000414848 [s; relative to TRIGTIME]
T50: 21.2000000476837 +/- 13.3713508979011
Measured from: 3.02399998903275
to: 24.2240000367165 [s; relative to TRIGTIME]
Fluence
Peak Flux (peak 1 second)
Measured from: 1.18800002336502
to: 2.18800002336502 [s; relative to TRIGTIME]
Total Fluence
Measured from: -0.272000014781952
to: 44.7680000066757 [s; relative to TRIGTIME]
Band 1 Band 2 Band 3 Band 4
15-25 25-50 50-100 100-350 keV
Total 0.271722 0.324640 0.115559 0.021219
0.046201 0.047217 0.041435 0.037888 [error]
Peak 0.015582 0.037514 0.012492 0.007124
0.007334 0.007409 0.006394 0.005691 [error]
[ fluence units of on-axis counts / fully illuminated detector ]
======================================================================
====== Table of the duration information =============================
Value tstart tstop
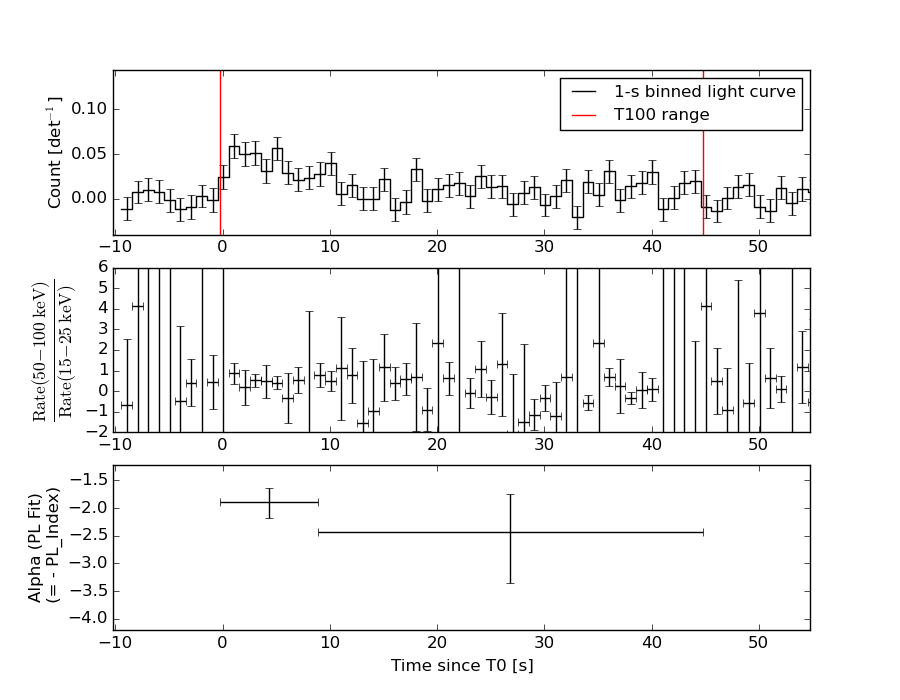
T100 45.040 -0.272 44.768
T90 40.704 0.640 41.344
T50 21.200 3.024 24.224
Peak 1.000 1.188 2.188
====== Spectral Analysis Summary =====================================
Model : spectral model: simple power-law (PL) and cutoff power-law (CPL)
Ph_index : photon index: E^{Ph_index}
Ph_90err : 90% error of the photon index
Epeak : Epeak in keV
Epeak_90err: 90% error of Epeak
Norm : normalization at 50 keV in both the PL model and CPL model
Nomr_90err : 90% error of the normalization
chi2 : Chi-Squared
dof : degree of freedo
=== Time-averaged spectral analysis ===
(Best model with acceptable fit: PL)
Model Ph_index Ph_90err_low Ph_90err_hi Epeak Epeak_90err_low Epeak_90err_hi Norm Nomr_90err_low Norm_90err_hi chi2 dof
PL -2.105 -0.372 0.333 - - - 8.82e-04 -2.29e-04 2.23e-04 54.410 57
CPL -1.346 -1.059 2.602 31.803 N/A N/A 2.64e-03 N/A N/A 53.530 56
=== 1-s peak spectral analysis ===
(Best model with acceptable fit: PL)
Model Ph_index Ph_90err_low Ph_90err_hi Epeak Epeak_90err_low Epeak_90err_hi Norm Nomr_90err_low Norm_90err_hi chi2 dof
PL -1.851 -0.521 0.461 - - - 4.15e-03 -1.48e-03 1.43e-03 59.150 57
CPL 0.498 -2.299 -0.498 43.217 -14.801 77.418 9.74e-02 -9.74e-02 -9.74e-02 56.070 56
=== Fluence/Peak Flux Summary ===
Model Band1 Band2 Band3 Band4 Band5 Total
15-25 25-50 50-100 100-350 15-150 15-350 keV
Fluence PL 8.98e-08 1.14e-07 1.06e-07 1.74e-07 3.69e-07 4.84e-07 erg/cm2
90%_error_low -2.09e-08 -2.21e-08 -3.57e-08 -9.09e-08 -8.39e-08 -1.43e-07 erg/cm2
90%_error_hi 2.13e-08 2.18e-08 3.83e-08 1.42e-07 8.82e-08 1.83e-07 erg/cm2
Peak flux PL 2.39e-01 1.96e-01 1.08e-01 8.85e-02 5.83e-01 6.32e-01 ph/cm2/s
90%_error_low -9.31e-02 -5.87e-02 -4.68e-02 -5.53e-02 -1.75e-01 -1.91e-01 ph/cm2/s
90%_error_hi 1.00e-01 5.87e-02 4.89e-02 9.07e-02 1.75e-01 1.94e-01 ph/cm2/s
Fluence CPL 8.76e-08 1.25e-07 9.52e-08 1.77e-07 3.36e-07 4.90e-07 erg/cm2
90%_error_low -2.22e-08 N/A -6.09e-08 -5.12e-08 -9.44e-08 N/A erg/cm2
90%_error_hi 2.22e-08 N/A 4.55e-08 1.10e-07 1.05e-07 N/A erg/cm2
Peak flux CPL 1.97e-01 2.57e-01 1.00e-01 7.43e-03 5.60e-01 5.61e-01 ph/cm2/s
90%_error_low -1.17e-01 -8.54e-02 -1.00e-01 -7.43e-03 -1.97e-01 -1.98e-01 ph/cm2/s
90%_error_hi 1.12e-01 1.22e-01 6.66e-02 7.97e-02 1.75e-01 1.77e-01 ph/cm2/s
======================================================================
Image
Pre-slew 15.0-350.0 keV image (Event data)
#   RAcent    DECcent   POSerr    Theta     Phi              Peak Cts       SNR   Name
   57.3161   -44.1875   0.0205    29.2649   170.3273         0.8625464      9.282 TRIG_00458918

Foreground time interval of the image:
 -0.272  44.768 (delta_t =  45.040 [sec])
Background time interval of the image:
-239.440  -0.272 (delta_t = 239.168 [sec])
Light Curves
Note: The mask-weighted lightcurves have units of either count/det or counts/sec/det, where a det is 0.4 x 0.4 = 0.16 sq cm.
Full-time range; 1 s binning
Other quick-look light curves:
- 64 ms binning (zoomed)
- 16 ms binning (zoomed)
- 8 ms binning (zoomed)
- 2 ms binning (zoomed)
- SN=5 or 10 s binning (full-time range)
- Raw light curve
Spectra
- 64 ms binning (zoomed)
- 16 ms binning (zoomed)
- 8 ms binning (zoomed)
- 2 ms binning (zoomed)
- SN=5 or 10 s binning (full-time range)
- Raw light curve
Spectra
Notes:
- 1) The fitting includes the systematic errors.
- 2) When the burst includes telescope slew time periods, the fitting uses an average response file made from multiple 5-s response files through out the slew time plus single time preiod for the non-slew times, and weighted by the total counts in the corresponding time period using addrmf. An average response file is needed becuase a spectral fit using the pre-slew DRM will introduce some errors in both a spectral shape and a normalization if the PHA file contains a lot of the slew/post-slew time interval.
- 3) For fits to more complicated models (e.g. a power-law over a cutoff power-law), the BAT team has decided to require a chi-square improvement of more than 6 for each extra dof.
Time averaged spectrum fit using the average DRM
Power-law model
Time interval is from   -0.272 sec. to   44.768 sec.

Spectral model in power-law:
------------------------------------------------------------
Parameters  : value       lower 90%   higher 90%
Photon index: -2.10532     ( -0.372195   0.333371 )
Norm@50keV  : 8.81694E-04    ( -0.000229301   0.000222713 )
------------------------------------------------------------
#Fit statistic : Chi-Squared =          54.41 using 59 PHA bins.
# Reduced chi-squared =         0.9546 for     57 degrees of freedom
# Null hypothesis probability =   5.727564e-01

Photon flux (15-150 keV)    in 45.04 sec: 0.139091 ( -0.025362  0.025366 ) ph/cm2/s
Energy fluence (15-150 keV)             : 3.69223e-07 ( -8.39248e-08  8.81798e-08 ) ergs/cm2
Cutoff power-law model
Time interval is from   -0.272 sec. to   44.768 sec.
Spectral model in the cutoff power-law:
------------------------------------------------------------
Parameters  : value       lower 90%   higher 90%
Photon index: -1.34588     ( -1.05893   2.60211 )
Epeak [keV] : 31.8031      (   )
Norm@50keV  : 2.64132E-03    (     )
------------------------------------------------------------
#Fit statistic : Chi-Squared =          53.53 using 59 PHA bins.
# Reduced chi-squared =         0.9559 for     56 degrees of freedom
# Null hypothesis probability =   5.688423e-01

Photon flux (15-150 keV)    in 45.04 sec: 0.136211 ( -0.025751  0.025841 ) ph/cm2/s
Energy fluence (15-150 keV)             : 3.3634e-07 ( -9.43993e-08  1.05077e-07 ) ergs/cm2
1-s peak spectrum fit
Power-law model
Time interval is from    1.188 sec. to    2.188 sec.

Spectral model in power-law:
------------------------------------------------------------
Parameters  : value       lower 90%   higher 90%
Photon index: -1.85103     ( -0.520232   0.462355 )
Norm@50keV  : 4.14678E-03    ( -0.0014776   0.00143533 )
------------------------------------------------------------
#Fit statistic : Chi-Squared =          59.15 using 59 PHA bins.
# Reduced chi-squared =          1.038 for     57 degrees of freedom
# Null hypothesis probability =   3.970989e-01

Photon flux (15-150 keV)    in 1 sec: 0.583162 ( -0.174797  0.174844 ) ph/cm2/s
Energy fluence (15-150 keV)             : 3.81215e-08 ( -1.30841e-08  1.37681e-08 ) ergs/cm2
Cutoff power-law model
Time interval is from    1.188 sec. to    2.188 sec.
Spectral model in the cutoff power-law:
------------------------------------------------------------
Parameters  : value       lower 90%   higher 90%
Photon index: 0.498315     ( -2.33867   -0.5378 )
Epeak [keV] : 43.2172      ( -14.5121 77.7067 )
Norm@50keV  : 9.73869E-02    ( -0.109098   -0.109098 )
------------------------------------------------------------
#Fit statistic : Chi-Squared =          56.07 using 59 PHA bins.
# Reduced chi-squared =          1.001 for     56 degrees of freedom
# Null hypothesis probability =   4.723654e-01

Photon flux (15-150 keV)    in 1 sec: 0.560450 ( -0.19723  0.174627 ) ph/cm2/s
Energy fluence (15-150 keV)             : 3.24586e-08 ( -1.44558e-08  1.44033e-08 ) ergs/cm2
Time-resolved spectra
Distribution
T90 vs. Hardness ratio plot
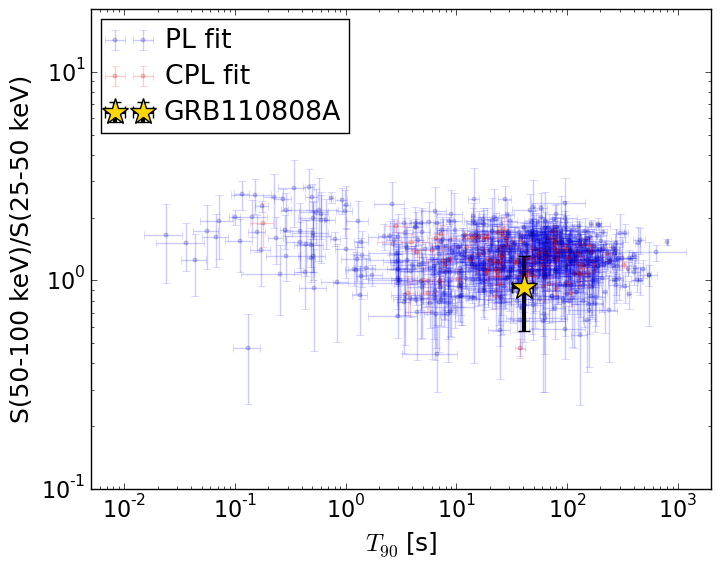
T90                                   = 40.704 sec.
Hardness ratio (energy fluence ratio) = 0.92965076734
S(15-50 keV) vs. S(50-150 keV) plot
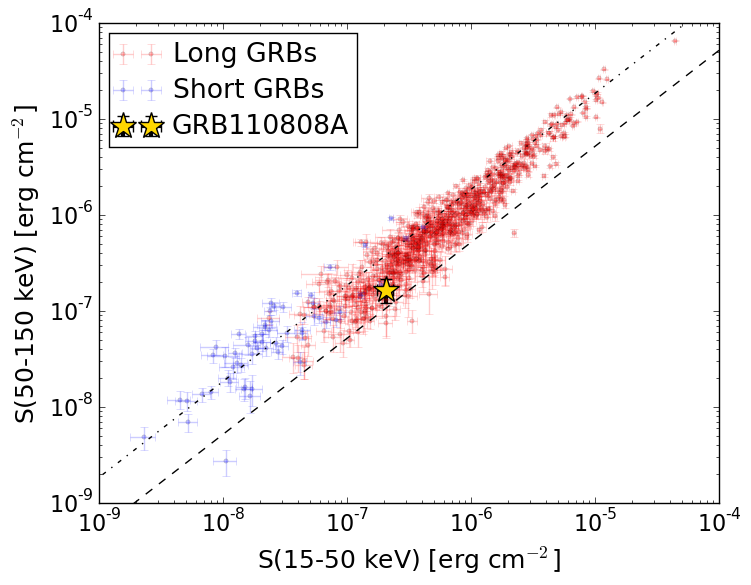
S(15-50 keV)  = 2.0419502e-07
S(50-150 keV) = 1.6503284e-07
The dash-dotted line and the dashed line traces the fluences calculated from the Band function with Epeak = 15 and 150 keV, respectively. Both lines assume a canonical values of alpha = -1 and beta = -2.5.
Mask shadow pattern
IMX = -5.524030337878577E-01, IMY = -9.415320014049408E-02
Spacecraft aspect plot
Bright source in the pre-burst/pre-slew/post-slew images
Pre-burst image of 15-350 keV band
Time interval of the image:
-239.440000 -0.272000

# RAcent  DECcent POSerr Theta    Phi  PeakCts   SNR AngSep     Name
#  [deg]    [deg]    ['] [deg]  [deg]                   [']
135.5544 -40.5644    5.6  38.3  -76.4   1.2660   2.1    1.3	Vela X-1
170.3122 -60.6224    3.2  33.4  -26.1   0.9439   3.6    0.1	Cen X-3
186.5858 -62.7815    2.0  36.4  -13.1   1.6251   5.9    2.1	GX 301-2
 19.8535 -46.2684    2.4  39.4  126.3   3.1395   4.8 ------	UNKNOWN
202.9077 -50.1117    2.6  51.8  -10.8   2.2886   4.4 ------	UNKNOWN
195.5555 -40.5647    2.8  58.5  -21.2   5.5161   4.1 ------	UNKNOWN
 80.9631 -12.2460    2.6  57.3 -150.3   5.5922   4.4 ------	UNKNOWN
 85.4122 -14.1152    4.3  55.3 -145.2   3.7080   2.7 ------	UNKNOWN
168.7052 -39.6442    3.6  50.6  -44.4   3.2720   3.2 ------	UNKNOWN
Pre-slew background subtracted image of 15-350 keV band
Time interval of the image:
-0.272000 44.768000

# RAcent  DECcent POSerr Theta    Phi  PeakCts   SNR AngSep     Name
#  [deg]    [deg]    ['] [deg]  [deg]                   [']
135.3500 -40.6553    6.1  38.2  -76.5  -0.3841  -1.9   10.1	Vela X-1
170.3605 -60.5887   79.4  33.5  -26.1  -0.0141  -0.1    2.4	Cen X-3
186.4205 -62.8725    5.0  36.3  -13.1  -0.2364  -2.3    8.9	GX 301-2
 57.3161 -44.1876    1.2  29.3  170.3   0.8629   9.3 ------	UNKNOWN
 58.2977 -17.0908    2.3  55.2 -177.3   1.5943   5.1 ------	UNKNOWN
Post-slew image of 15-350 keV band
Time interval of the image:
100.060590 721.760610

# RAcent  DECcent POSerr Theta    Phi  PeakCts   SNR AngSep     Name
#  [deg]    [deg]    ['] [deg]  [deg]                   [']
 18.2436  -9.3403    3.0  48.5  142.3   7.9219   3.9 ------	UNKNOWN
 70.9789   9.6778    4.3  55.3 -145.2   8.4001   2.7 ------	UNKNOWN
 89.1662 -11.0581    3.3  43.0 -112.2   7.8931   3.5 ------	UNKNOWN