Analysis Summary
Notes:
- 1) No attempt has been made to eliminate the non-significant decimal places.
- 2) This batgrbproduct analysis is done using the HEASARC data.
- 3) This batgrbproduct analysis is using the flight position for the mask-weighting calculation.
======================================================================
                  BAT GRB EVENT DATA PROCESSING REPORT
    Process Script Ver: batgrbproduct v2.46
    Process Start Time: Mon Jan 13 21:19:33 EST 2014
             Host Name: batevent1
   Current Working Dir: /local/data/batevent/batevent_reproc/trigger500914
======================================================================

  Trigger: 00500914      Segment: 000

  BAT Trigger Time: 335392676.48   [s; MET]
      Trigger Stop: 335392688.64   [s; MET]
               UTC: 2011-08-18T20:37:49.205860    [includes UTCF correction]
       Where From?: TDRSS position message

  BAT
    RA: 317.383618630044   Dec: -63.969654053451  [deg; J2000]

     Catalogged Source?: NO
     Point Source?:      YES
     GRB Indicated?:     YES    [ by BAT flight software ]
     Image S/N Ratio:    14.23
     Image Trigger?:     NO
     Rate S/N Ratio:     16.0312195418814  [ if not an image trigger ]
     Image S/N Ratio:    14.23

  Analysis Position:   [ source = BAT ]
    RA: 317.383618630044   Dec: -63.969654053451  [deg; J2000]

  Refined Position:   [ source = BAT pre-slew burst ]
    RA: 317.374860046834   Dec: -63.9817506970385  [deg; J2000]
        { 21h 09m 30.0s , -63d 58' 54.3" }
         +/- 1.39182464551997 [arcmin] (estimated 90% radius based on SNR)
         +/- 0.469336102327281 [arcmin] (formal 1-sigma fit error)
    SNR: 18.9669558665367

  Angular difference between the analysis and refined position is 0.761542 arcmin

  Partial Coding Fraction: 0.2929688    [ including projection effects ]

  Duration
     T90: 102.839999973774 +/- 18.0035651679316
        Measured from: -4.22400003671646
                   to: 98.6159999370575     [s; relative to TRIGTIME]
     T50: 38.2399999499321 +/- 4.92446506445906
        Measured from: 9.63599997758865
                   to: 47.8759999275208     [s; relative to TRIGTIME]


  Fluence
     Peak Flux  (peak 1 second)
        Measured from: 27.2599999904633
                   to: 28.2599999904633     [s; relative to TRIGTIME]
     Total Fluence
        Measured from: -14.1640000343323
                   to: 117.391999959946     [s; relative to TRIGTIME]

             Band 1     Band 2     Band 3     Band 4
              15-25      25-50     50-100    100-350     keV
 Total     1.599737   2.253942   1.739122   0.395091
           0.131899   0.119664   0.101402   0.086022 [error]
 Peak      0.048173   0.043761   0.085043   0.014047
           0.012194   0.011431   0.010476   0.008440 [error]

     [ fluence units of on-axis counts / fully illuminated detector ]

======================================================================


====== Table of the duration information =============================

        Value   tstart    tstop
T100  131.556  -14.164  117.392
T90   102.840   -4.224   98.616
T50    38.240    9.636   47.876
Peak    1.000   27.260   28.260


====== Spectral Analysis Summary =====================================

Model      : spectral model: simple power-law (PL) and cutoff power-law (CPL)
Ph_index   : photon index: E^{Ph_index}
Ph_90err   : 90% error of the photon index
Epeak      : Epeak in keV
Epeak_90err: 90% error of Epeak
Norm       : normalization at 50 keV in both the PL model and CPL model
Nomr_90err : 90% error of the normalization
chi2       : Chi-Squared
dof        : degree of freedo

=== Time-averaged spectral analysis ===
(Best model with acceptable fit: N/A)

Model Ph_index Ph_90err_low Ph_90err_hi  Epeak  Epeak_90err_low  Epeak_90err_hi  Norm       Nomr_90err_low    Norm_90err_hi    chi2    dof
PL      -1.581    -0.108      0.108       -           -               -         3.23e-03     -1.91e-04          1.91e-04      73.090   57
CPL     -1.469    -0.210      0.451      247.459    -247.459      -247.459      3.67e-03     -8.06e-04          2.32e-03      72.890   56


=== 1-s peak spectral analysis ===
(Best model with acceptable fit: PL)

Model Ph_index Ph_90err_low Ph_90err_hi  Epeak  Epeak_90err_low  Epeak_90err_hi  Norm       Nomr_90err_low    Norm_90err_hi    chi2    dof
PL      -1.110     -0.318     0.334       -           -               -         1.35e-02     -2.45e-03          2.40e-03      63.240   57
CPL     -0.876     -2.018     1.593      310.645    -310.645      -310.645      1.67e-02     -5.38e-03          4.14e-02      63.280   56


=== Fluence/Peak Flux Summary ===

              Model    Band1     Band2     Band3     Band4     Band5     Total
                       15-25     25-50    50-100    100-350    15-150    15-350    keV
Fluence         PL   5.87e-07  1.03e-06  1.37e-06  3.75e-06  3.99e-06  6.74e-06   erg/cm2
      90%_error_low -6.40e-08 -6.73e-08 -1.02e-07 -5.85e-07 -2.47e-07 -6.56e-07   erg/cm2
      90%_error_hi   6.64e-08  6.68e-08  1.01e-07  6.55e-07  2.48e-07  7.09e-07   erg/cm2
Peak flux       PL   3.83e-01  4.87e-01  4.51e-01  7.33e-01  1.57e+00  2.05e+00   ph/cm2/s
      90%_error_low -1.40e-01 -1.17e-01 -8.08e-02 -2.58e-01 -2.98e-01 -3.53e-01   ph/cm2/s
      90%_error_hi   1.65e-01  1.15e-01  7.97e-02  3.36e-01  3.03e-01  3.57e-01   ph/cm2/s

Fluence        CPL   5.74e-07  1.04e-06  1.38e-06  3.18e-06  3.96e-06  6.18e-06   erg/cm2
      90%_error_low -7.99e-08 -7.43e-08 -1.09e-07 -1.41e-06 -2.73e-07 -1.43e-06   erg/cm2
      90%_error_hi   5.70e-08  7.71e-08  1.13e-07  7.15e-07  2.62e-07  8.01e-07   erg/cm2
Peak flux      CPL   3.73e-01  4.86e-01  4.55e-01  7.39e-01  1.56e+00  2.01e+00   ph/cm2/s
      90%_error_low -3.73e-01 -1.17e-01 -8.29e-02 -4.76e-01 -3.33e-01 -6.35e-01   ph/cm2/s
      90%_error_hi   1.71e-01  1.17e-01  1.15e-01  2.82e-01  3.07e-01  3.94e-01   ph/cm2/s

======================================================================
Image
Pre-slew 15.0-350.0 keV image (Event data)
#   RAcent    DECcent   POSerr    Theta     Phi              Peak Cts       SNR   Name
  317.3749   -63.9818   0.0101    41.7686   154.1918         6.1354390     18.967 TRIG_00500914

Foreground time interval of the image:
-14.164 117.392 (delta_t = 131.556 [sec])
Background time interval of the image:
-143.579 -14.164 (delta_t = 129.415 [sec])
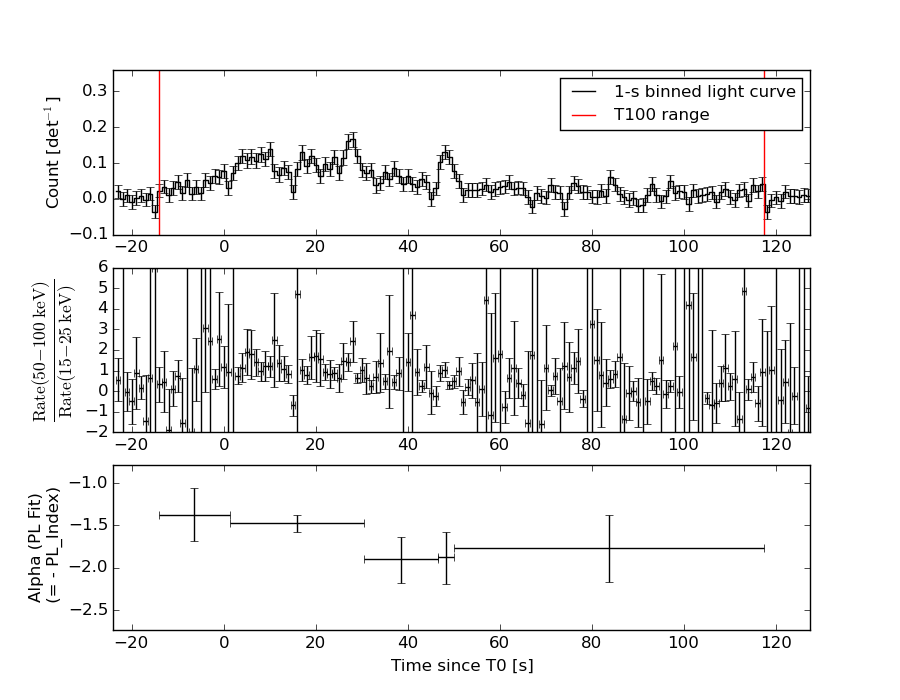
Light Curves
Note: The mask-weighted lightcurves have units of either count/det or counts/sec/det, where a det is 0.4 x 0.4 = 0.16 sq cm.
Full-time range; 1 s binning
Other quick-look light curves:
- 64 ms binning (zoomed)
- 16 ms binning (zoomed)
- 8 ms binning (zoomed)
- 2 ms binning (zoomed)
- SN=5 or 10 s binning (full-time range)
- Raw light curve
Spectra
- 64 ms binning (zoomed)
- 16 ms binning (zoomed)
- 8 ms binning (zoomed)
- 2 ms binning (zoomed)
- SN=5 or 10 s binning (full-time range)
- Raw light curve
Spectra
Notes:
- 1) The fitting includes the systematic errors.
- 2) When the burst includes telescope slew time periods, the fitting uses an average response file made from multiple 5-s response files through out the slew time plus single time preiod for the non-slew times, and weighted by the total counts in the corresponding time period using addrmf. An average response file is needed becuase a spectral fit using the pre-slew DRM will introduce some errors in both a spectral shape and a normalization if the PHA file contains a lot of the slew/post-slew time interval.
- 3) For fits to more complicated models (e.g. a power-law over a cutoff power-law), the BAT team has decided to require a chi-square improvement of more than 6 for each extra dof.
Time averaged spectrum fit using the average DRM
Power-law model
Time interval is from  -14.164 sec. to  117.392 sec.

Spectral model in power-law:
------------------------------------------------------------
Parameters  : value       lower 90%   higher 90%
Photon index: -1.58146     ( -0.107752   0.107595 )
Norm@50keV  : 3.23498E-03    ( -0.000190983   0.000190734 )
------------------------------------------------------------
#Fit statistic : Chi-Squared =          73.09 using 59 PHA bins.
# Reduced chi-squared =          1.282 for     57 degrees of freedom
# Null hypothesis probability =   7.409102e-02

Photon flux (15-150 keV)    in 131.6 sec: 0.413371 ( -0.026447  0.026565 ) ph/cm2/s
Energy fluence (15-150 keV)             : 3.99122e-06 ( -2.4713e-07  2.48099e-07 ) ergs/cm2
Cutoff power-law model
Time interval is from  -14.164 sec. to  117.392 sec.
Spectral model in the cutoff power-law:
------------------------------------------------------------
Parameters  : value       lower 90%   higher 90%
Photon index: -1.46875     ( -0.209885   0.451596 )
Epeak [keV] : 247.459      ( -247.851 -247.851 )
Norm@50keV  : 3.66704E-03    ( -0.000805351   0.00231686 )
------------------------------------------------------------
#Fit statistic : Chi-Squared =          72.89 using 59 PHA bins.
# Reduced chi-squared =          1.302 for     56 degrees of freedom
# Null hypothesis probability =   6.423655e-02

Photon flux (15-150 keV)    in 131.6 sec: 0.410551 ( -0.028372  0.028084 ) ph/cm2/s
Energy fluence (15-150 keV)             : 3.96119e-06 ( -2.73144e-07  2.62347e-07 ) ergs/cm2
1-s peak spectrum fit
Power-law model
Time interval is from   27.260 sec. to   28.260 sec.

Spectral model in power-law:
------------------------------------------------------------
Parameters  : value       lower 90%   higher 90%
Photon index: -1.10998     ( -0.318428   0.334209 )
Norm@50keV  : 1.35121E-02    ( -0.00244752   0.00239838 )
------------------------------------------------------------
#Fit statistic : Chi-Squared =          63.24 using 59 PHA bins.
# Reduced chi-squared =          1.110 for     57 degrees of freedom
# Null hypothesis probability =   2.654418e-01

Photon flux (15-150 keV)    in 1 sec: 1.56886 ( -0.29784  0.30279 ) ph/cm2/s
Energy fluence (15-150 keV)             : 1.40841e-07 ( -2.4656e-08  2.47017e-08 ) ergs/cm2
Cutoff power-law model
Time interval is from   27.260 sec. to   28.260 sec.
Spectral model in the cutoff power-law:
------------------------------------------------------------
Parameters  : value       lower 90%   higher 90%
Photon index: -1.1042     ( -2.00524   1.60532 )
Epeak [keV] : 9982.73      ( -9945.8 -9945.8 )
Norm@50keV  : 1.35836E-02    ( -0.00230401   0.044445 )
------------------------------------------------------------
#Fit statistic : Chi-Squared =          63.24 using 59 PHA bins.
# Reduced chi-squared =          1.129 for     56 degrees of freedom
# Null hypothesis probability =   2.359791e-01

Photon flux (15-150 keV)    in 1 sec: 1.56100 ( -0.33329  0.30734 ) ph/cm2/s
Energy fluence (15-150 keV)             : 1.40741e-07 ( -2.53239e-08  2.4136e-08 ) ergs/cm2
Time-resolved spectra
Distribution
T90 vs. Hardness ratio plot
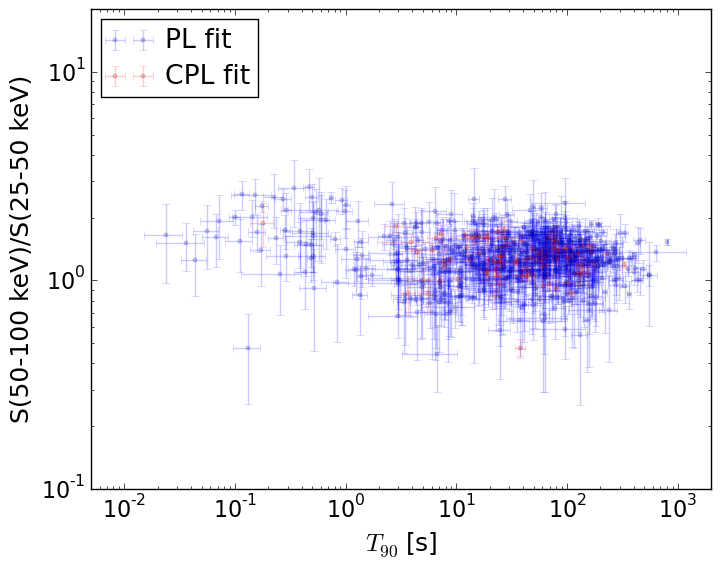
T90                                   = N/A sec.
Hardness ratio (energy fluence ratio) = N/A
S(15-50 keV) vs. S(50-150 keV) plot
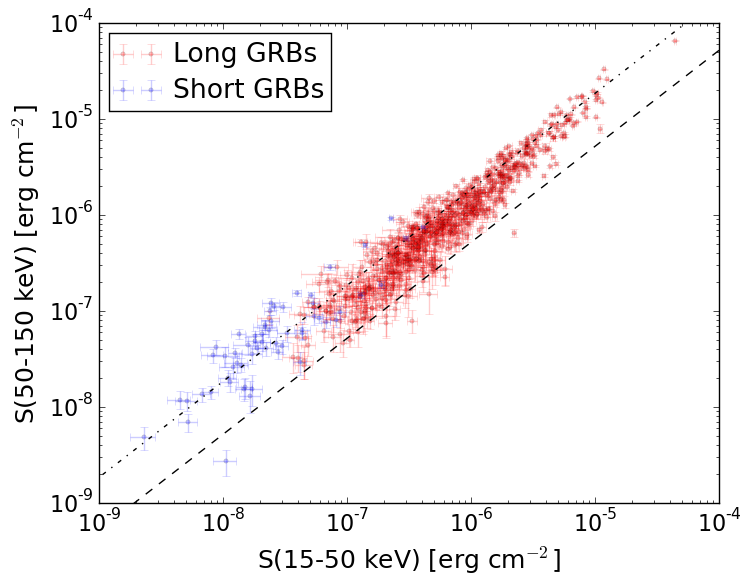
S(15-50 keV)  = N/A
S(50-150 keV) = N/A
The dash-dotted line and the dashed line traces the fluences calculated from the Band function with Epeak = 15 and 150 keV, respectively. Both lines assume a canonical values of alpha = -1 and beta = -2.5.
Mask shadow pattern
IMX = -8.040348780338894E-01, IMY = -3.888279892617332E-01
Spacecraft aspect plot
Bright source in the pre-burst/pre-slew/post-slew images
Pre-burst image of 15-350 keV band
Time interval of the image:
-143.579400 -14.164000

# RAcent  DECcent POSerr Theta    Phi  PeakCts   SNR AngSep     Name
#  [deg]    [deg]    ['] [deg]  [deg]                   [']
186.3239 -62.7620    5.9  46.5 -134.4  -0.8144  -2.0    9.2	GX 301-2
244.9791 -15.6398    0.3  26.7  -17.9   4.5786  36.3    0.0	Sco X-1
255.9411 -37.7875    2.8   2.5  -13.4   0.5012   4.1    4.0	4U 1700-377
256.5655 -36.3502    4.3   3.8    1.8   0.3241   2.7    7.7	GX 349+2
263.1174 -24.7446    3.7  16.2   28.8   0.3713   3.1    5.9	GX 1+4
264.9845 -44.5240    3.6   7.3  138.9   0.3920   3.2   11.3	4U 1735-44
268.4106  -1.5157    3.3  39.9   26.7   0.7538   3.5    4.6	SW J1753.5-0127
270.2413 -24.9786    3.4  18.7   48.8   0.4863   3.4    6.5	GX 5-1
270.2718 -25.6941    3.5  18.1   50.2   0.4577   3.3    3.4	GRS 1758-258
273.9249 -14.0161    2.6  30.0   43.1   0.7658   4.4    4.9	GX 17+2
275.7726 -30.4415    3.7  18.0   72.2   0.4271   3.1    9.1	H1820-303
284.9800 -24.8406    7.7  27.8   74.2   0.2729   1.5    5.7	HT1900.1-2455
262.8081 -33.8471    9.1   7.7   46.5   0.1528   1.3    9.0	GX 354-0
292.1743 -26.2436    2.6  32.1   84.3   1.1280   4.4 ------	UNKNOWN
278.1896 -11.2532    2.5  34.3   47.6   1.0354   4.7 ------	UNKNOWN
292.4550 -53.9240    2.1  27.3  141.2   0.8666   5.5 ------	UNKNOWN
  7.8273 -79.4914    2.9  54.2  176.9   1.8702   3.9 ------	UNKNOWN
 25.0285 -79.2431    2.9  56.9  178.9   3.0450   4.0 ------	UNKNOWN
278.9292 -74.0923    2.8  35.5  179.0   0.6248   4.1 ------	UNKNOWN
255.1852 -41.6732    1.7   2.1 -127.5   0.7892   6.9 ------	UNKNOWN
243.1483 -52.4012    2.3  15.6 -137.6   0.6268   5.1 ------	UNKNOWN
	UNKNOWN
Pre-slew background subtracted image of 15-350 keV band
Time interval of the image:
-14.164000 117.392000

# RAcent  DECcent POSerr Theta    Phi  PeakCts   SNR AngSep     Name
#  [deg]    [deg]    ['] [deg]  [deg]                   [']
186.6431 -62.8257    9.8  46.4 -134.5   0.5296   1.2    3.3	GX 301-2
244.9792 -15.6416  477.4  26.7  -17.9  -0.0039  -0.0    0.1	Sco X-1
255.9631 -37.7362    4.3   2.6  -12.6  -0.4042  -2.6    6.6	4U 1700-377
256.4464 -36.4811    7.8   3.7    0.1   0.2296   1.5    3.5	GX 349+2
263.1976 -24.8382    8.0  16.1   29.2  -0.2202  -1.5   11.7	GX 1+4
264.5272 -44.4492    5.6   6.9  139.9   0.3215   2.1    9.2	4U 1735-44
268.2749  -1.5072    5.8  39.9   26.5  -0.5869  -2.0    6.5	SW J1753.5-0127
270.2787 -24.9301    5.1  18.8   48.8  -0.3937  -2.2    9.0	GX 5-1
270.4642 -25.7160    7.2  18.2   50.7  -0.2781  -1.6    8.9	GRS 1758-258
274.1115 -14.1574   13.0  29.9   43.6   0.2049   0.9    9.5	GX 17+2
275.7982 -30.4865    4.7  18.0   72.4  -0.4444  -2.5    9.7	H1820-303
285.0281 -25.0685   47.6  27.7   74.6   0.0596   0.2    8.9	HT1900.1-2455
263.1201 -33.6582    6.4   8.0   47.2   0.2891   1.8   12.4	GX 354-0
268.2968  11.0475    2.0  52.2   22.9   4.3972   5.8 ------	UNKNOWN
317.3748 -63.9817    0.6  41.8  154.2   6.1351  19.0 ------	UNKNOWN
214.0730 -15.4829    2.3  44.8  -60.2   3.0860   5.0 ------	UNKNOWN
Post-slew image of 15-350 keV band
Time interval of the image:
364.220600 962.630600

# RAcent  DECcent POSerr Theta    Phi  PeakCts   SNR AngSep     Name
#  [deg]    [deg]    ['] [deg]  [deg]                   [']
255.9701 -37.8606   92.4  44.2   -7.0   0.0634   0.1    1.3	4U 1700-377
256.2684 -36.3854    5.1  45.3   -5.6   1.2882   2.3    8.4	GX 349+2
263.1508 -24.7520    4.9  52.5    8.9   2.3496   2.4    7.7	GX 1+4
264.7929 -44.4324    2.7  35.0   -4.5   1.5854   4.3    2.4	4U 1735-44
270.4730 -25.0911    3.2  49.3   16.4   3.1685   3.6   10.3	GX 5-1
270.2994 -25.6459    6.5  48.8   15.9   1.4656   1.8    5.8	GRS 1758-258
275.8005 -30.3794    3.1  42.5   19.2   1.9748   3.7    6.5	H1820-303
285.0595 -24.9608    8.7  44.3   33.3   0.9949   1.3    2.7	HT1900.1-2455
262.9822 -33.8358   12.9  44.5    2.9  -0.5096  -0.9    0.3	GX 354-0
342.3995 -67.9758    2.6  10.9 -160.3   1.2861   4.4 ------	UNKNOWN
 47.0373 -35.6269    4.7  58.3 -175.7   6.2982   2.5 ------	UNKNOWN
255.2031 -41.6368    1.1  41.4  -10.9   4.7939  10.9 ------	UNKNOWN
243.1447 -52.4447    2.3  38.3  -31.6   2.1875   5.1 ------	UNKNOWN
 60.6016 -69.6942    3.2  36.1 -137.8   1.6660   3.6 ------	UNKNOWN
237.2117 -46.7414    3.1  45.1  -30.5   2.1128   3.7 ------	UNKNOWN
 84.3683 -62.9635    3.6  47.1 -132.5   4.2072   3.2 ------	UNKNOWN
 90.4126 -63.3865    2.2  48.0 -129.0   8.8205   5.3 ------	UNKNOWN