Analysis Summary
Notes:
- 1) No attempt has been made to eliminate the non-significant decimal places.
- 2) This batgrbproduct analysis is done using the HEASARC data.
- 3) This batgrbproduct analysis is using the flight position for the mask-weighting calculation.
======================================================================
BAT GRB EVENT DATA PROCESSING REPORT
Process Script Ver: batgrbproduct v2.46
Process Start Time: Mon Jan 13 21:13:25 EST 2014
Host Name: batevent1
Current Working Dir: /local/data/batevent/batevent_reproc/trigger501095
======================================================================
Trigger: 00501095 Segment: 000
BAT Trigger Time: 335554715.072 [s; MET]
Trigger Stop: 335554717.12 [s; MET]
UTC: 2011-08-20T17:38:27.791540 [includes UTCF correction]
Where From?: TDRSS position message
BAT
RA: 343.335365253431 Dec: 70.3055248184936 [deg; J2000]
Catalogged Source?: NO
Point Source?: YES
GRB Indicated?: YES [ by BAT flight software ]
Image S/N Ratio: 8.09
Image Trigger?: NO
Rate S/N Ratio: 12.5299640861417 [ if not an image trigger ]
Image S/N Ratio: 8.09
Analysis Position: [ source = BAT ]
RA: 343.335365253431 Dec: 70.3055248184936 [deg; J2000]
Refined Position: [ source = BAT pre-slew burst ]
RA: 343.218619076135 Dec: 70.3082785751454 [deg; J2000]
{ 22h 52m 52.5s , +70d 18' 29.8" }
+/- 1.84174578029472 [arcmin] (estimated 90% radius based on SNR)
+/- 0.661362005869463 [arcmin] (formal 1-sigma fit error)
SNR: 12.7121448291621
Angular difference between the analysis and refined position is 2.366256 arcmin
Partial Coding Fraction: 0.9921875 [ including projection effects ]
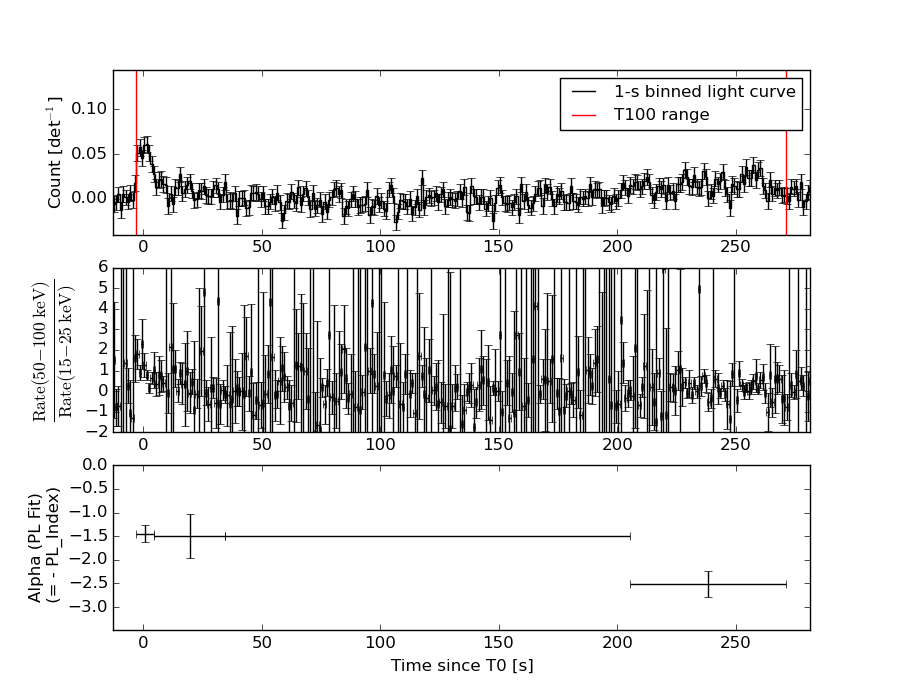
Duration
T90: 264.615999937057 +/- 8.68569143541024
Measured from: -1.59200000762939
to: 263.023999929428 [s; relative to TRIGTIME]
T50: 244.843999922276 +/- 201.724250975818
Measured from: 4.11199998855591
to: 248.955999910831 [s; relative to TRIGTIME]
Fluence
Peak Flux (peak 1 second)
Measured from: 1.55599999427795
to: 2.55599999427795 [s; relative to TRIGTIME]
Total Fluence
Measured from: -3.07200002670288
to: 271.324000000954 [s; relative to TRIGTIME]
Band 1 Band 2 Band 3 Band 4
15-25 25-50 50-100 100-350 keV
Total 0.643738 0.569578 0.376202 -0.001314
0.075891 0.077526 0.068345 0.060200 [error]
Peak 0.025092 0.028713 0.009262 0.005602
0.004799 0.004961 0.004386 0.003627 [error]
[ fluence units of on-axis counts / fully illuminated detector ]
======================================================================
====== Table of the duration information =============================
Value tstart tstop
T100 274.396 -3.072 271.324
T90 264.616 -1.592 263.024
T50 244.844 4.112 248.956
Peak 1.000 1.556 2.556
====== Spectral Analysis Summary =====================================
Model : spectral model: simple power-law (PL) and cutoff power-law (CPL)
Ph_index : photon index: E^{Ph_index}
Ph_90err : 90% error of the photon index
Epeak : Epeak in keV
Epeak_90err: 90% error of Epeak
Norm : normalization at 50 keV in both the PL model and CPL model
Nomr_90err : 90% error of the normalization
chi2 : Chi-Squared
dof : degree of freedo
=== Time-averaged spectral analysis ===
(Best model with acceptable fit: PL)
Model Ph_index Ph_90err_low Ph_90err_hi Epeak Epeak_90err_low Epeak_90err_hi Norm Nomr_90err_low Norm_90err_hi chi2 dof
PL -1.988 -0.296 0.270 - - - 3.23e-04 -6.18e-05 5.92e-05 61.690 57
CPL -1.988 -1.018 0.886 446.446 N/A N/A 3.24e-04 N/A N/A 61.690 56
=== 1-s peak spectral analysis ===
(Best model with acceptable fit: PL)
Model Ph_index Ph_90err_low Ph_90err_hi Epeak Epeak_90err_low Epeak_90err_hi Norm Nomr_90err_low Norm_90err_hi chi2 dof
PL -1.984 -0.430 0.382 - - - 3.47e-03 -1.02e-03 9.85e-04 55.410 57
CPL -0.916 -1.470 4.972 36.373 -36.373 -36.373 1.66e-02 -1.66e-02 3.49e+01 54.770 56
=== Fluence/Peak Flux Summary ===
Model Band1 Band2 Band3 Band4 Band5 Total
15-25 25-50 50-100 100-350 15-150 15-350 keV
Fluence PL 1.79e-07 2.45e-07 2.47e-07 4.52e-07 8.17e-07 1.12e-06 erg/cm2
90%_error_low -3.40e-08 -3.44e-08 -6.37e-08 -1.96e-07 -1.43e-07 -2.75e-07 erg/cm2
90%_error_hi 3.49e-08 3.41e-08 6.58e-08 2.76e-07 1.48e-07 3.39e-07 erg/cm2
Peak flux PL 2.28e-01 1.73e-01 8.73e-02 6.32e-02 5.18e-01 5.51e-01 ph/cm2/s
90%_error_low -6.32e-02 -3.75e-02 -3.21e-02 -3.52e-02 -1.10e-01 -1.21e-01 ph/cm2/s
90%_error_hi 6.54e-02 3.72e-02 3.40e-02 5.54e-02 1.10e-01 1.23e-01 ph/cm2/s
Fluence CPL 1.80e-07 2.48e-07 2.47e-07 5.65e-07 8.22e-07 1.21e-06 erg/cm2
90%_error_low -3.78e-08 -3.64e-08 -6.38e-08 -4.10e-07 -1.48e-07 -3.58e-07 erg/cm2
90%_error_hi 3.50e-08 3.03e-08 3.73e-08 6.36e-08 1.18e-07 2.25e-07 erg/cm2
Peak flux CPL 2.19e-01 1.96e-01 7.43e-02 1.19e-02 4.99e-01 5.02e-01 ph/cm2/s
90%_error_low -3.77e-02 N/A -7.43e-02 -1.19e-02 -1.18e-01 -1.21e-01 ph/cm2/s
90%_error_hi 6.91e-02 N/A 4.47e-02 7.56e-02 1.17e-01 1.58e-01 ph/cm2/s
======================================================================
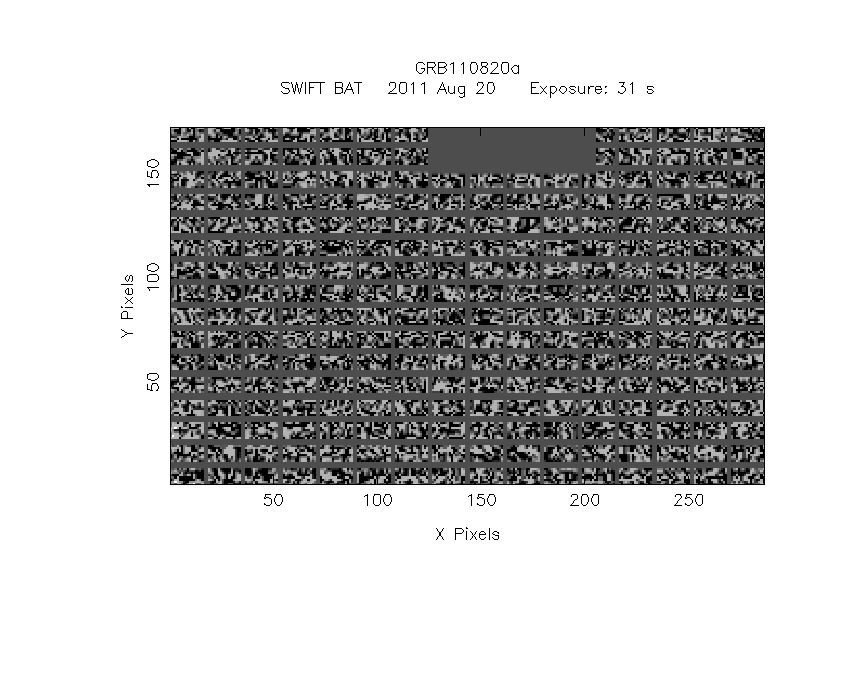
Image
Pre-slew 15.0-350.0 keV image (Event data)
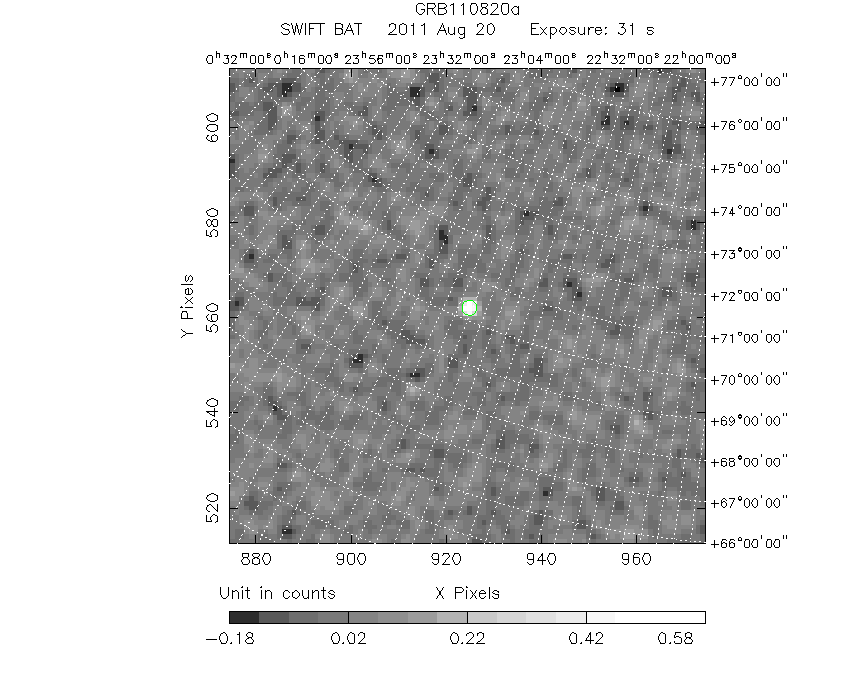
#   RAcent    DECcent   POSerr    Theta     Phi              Peak Cts       SNR   Name
  343.2186    70.3083   0.0151    11.4904  -117.9107         0.6521102     12.712 TRIG_00501095

Foreground time interval of the image:
 -3.072  27.629 (delta_t =  30.701 [sec])
Background time interval of the image:
-239.072  -3.072 (delta_t = 236.000 [sec])
Light Curves
Note: The mask-weighted lightcurves have units of either count/det or counts/sec/det, where a det is 0.4 x 0.4 = 0.16 sq cm.
Full-time range; 1 s binning
Other quick-look light curves:
- 64 ms binning (zoomed)
- 16 ms binning (zoomed)
- 8 ms binning (zoomed)
- 2 ms binning (zoomed)
- SN=5 or 10 s binning (full-time range)
- Raw light curve
Spectra
- 64 ms binning (zoomed)
- 16 ms binning (zoomed)
- 8 ms binning (zoomed)
- 2 ms binning (zoomed)
- SN=5 or 10 s binning (full-time range)
- Raw light curve
Spectra
Notes:
- 1) The fitting includes the systematic errors.
- 2) When the burst includes telescope slew time periods, the fitting uses an average response file made from multiple 5-s response files through out the slew time plus single time preiod for the non-slew times, and weighted by the total counts in the corresponding time period using addrmf. An average response file is needed becuase a spectral fit using the pre-slew DRM will introduce some errors in both a spectral shape and a normalization if the PHA file contains a lot of the slew/post-slew time interval.
- 3) For fits to more complicated models (e.g. a power-law over a cutoff power-law), the BAT team has decided to require a chi-square improvement of more than 6 for each extra dof.
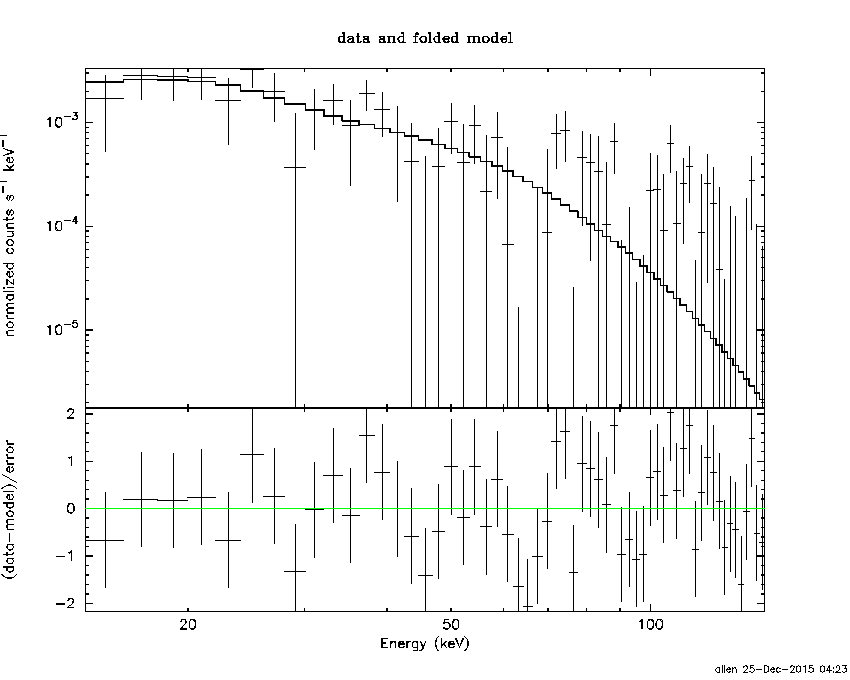
Time averaged spectrum fit using the average DRM
Power-law model
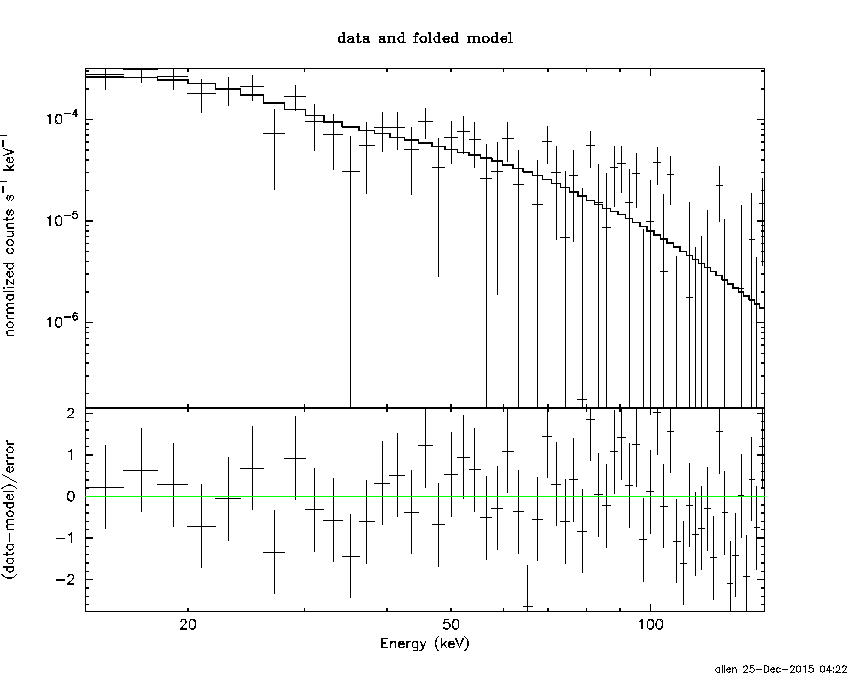
Time interval is from   -3.072 sec. to  271.324 sec.

Spectral model in power-law:
------------------------------------------------------------
Parameters  : value       lower 90%   higher 90%
Photon index: -1.98848     ( -0.295823   0.269798 )
Norm@50keV  : 3.23031E-04    ( -6.18385e-05   5.92076e-05 )
------------------------------------------------------------
#Fit statistic : Chi-Squared =          61.69 using 59 PHA bins.
# Reduced chi-squared =          1.082 for     57 degrees of freedom
# Null hypothesis probability =   3.120807e-01

Photon flux (15-150 keV)    in 274.4 sec: 4.82032E-02 ( -0.0065468  0.0065469 ) ph/cm2/s
Energy fluence (15-150 keV)             : 8.17078e-07 ( -1.42808e-07  1.47915e-07 ) ergs/cm2
Cutoff power-law model
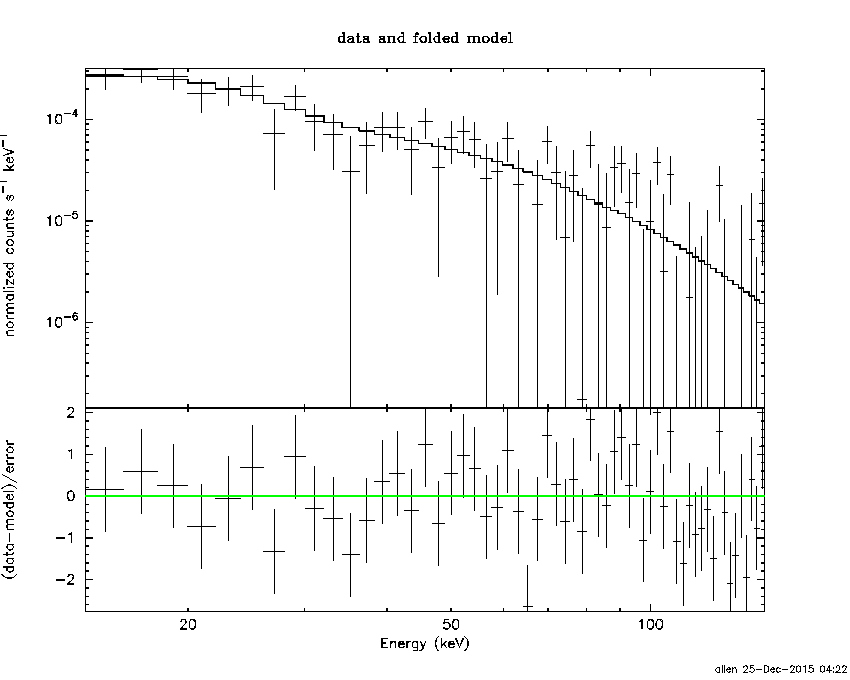
Time interval is from   -3.072 sec. to  271.324 sec.
Spectral model in the cutoff power-law:
------------------------------------------------------------
Parameters  : value       lower 90%   higher 90%
Photon index: -2.07159     ( -1.01762   0.886159 )
Epeak [keV] : 39.8578      (   )
Norm@50keV  : 2.90928E-04    (     )
------------------------------------------------------------
#Fit statistic : Chi-Squared =          61.68 using 59 PHA bins.
# Reduced chi-squared =          1.101 for     56 degrees of freedom
# Null hypothesis probability =   2.802482e-01

Photon flux (15-150 keV)    in 274.4 sec: 4.82410E-02 ( -0.0065027  0.0066292 ) ph/cm2/s
Energy fluence (15-150 keV)             : 8.22251e-07 ( -1.47561e-07  1.18196e-07 ) ergs/cm2
1-s peak spectrum fit
Power-law model
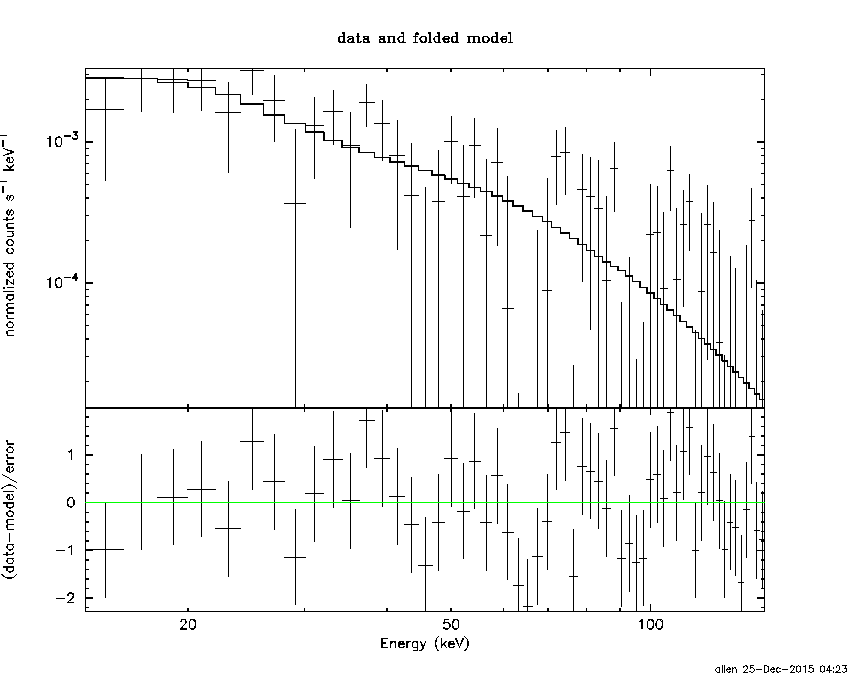
Time interval is from    1.556 sec. to    2.556 sec.

Spectral model in power-law:
------------------------------------------------------------
Parameters  : value       lower 90%   higher 90%
Photon index: -1.98421     ( -0.430172   0.381746 )
Norm@50keV  : 3.47483E-03    ( -0.00102215   0.000984708 )
------------------------------------------------------------
#Fit statistic : Chi-Squared =          55.41 using 59 PHA bins.
# Reduced chi-squared =         0.9721 for     57 degrees of freedom
# Null hypothesis probability =   5.348704e-01

Photon flux (15-150 keV)    in 1 sec: 0.517514 ( -0.109846  0.109887 ) ph/cm2/s
Energy fluence (15-150 keV)             : 3.20251e-08 ( -8.56877e-09  9.09555e-09 ) ergs/cm2
Cutoff power-law model
Time interval is from    1.556 sec. to    2.556 sec.
Spectral model in the cutoff power-law:
------------------------------------------------------------
Parameters  : value       lower 90%   higher 90%
Photon index: -0.916133     ( -1.48454   4.95715 )
Epeak [keV] : 36.3733      ( -36.2801 -36.2801 )
Norm@50keV  : 1.66339E-02    ( -0.017543   34.9379 )
------------------------------------------------------------
#Fit statistic : Chi-Squared =          54.77 using 59 PHA bins.
# Reduced chi-squared =         0.9780 for     56 degrees of freedom
# Null hypothesis probability =   5.216142e-01

Photon flux (15-150 keV)    in 1 sec: 0.498909 ( -0.11773  0.117301 ) ph/cm2/s
Energy fluence (15-150 keV)             : 2.72615e-08 ( -9.20057e-09  1.18496e-08 ) ergs/cm2
Time-resolved spectra
Distribution
T90 vs. Hardness ratio plot
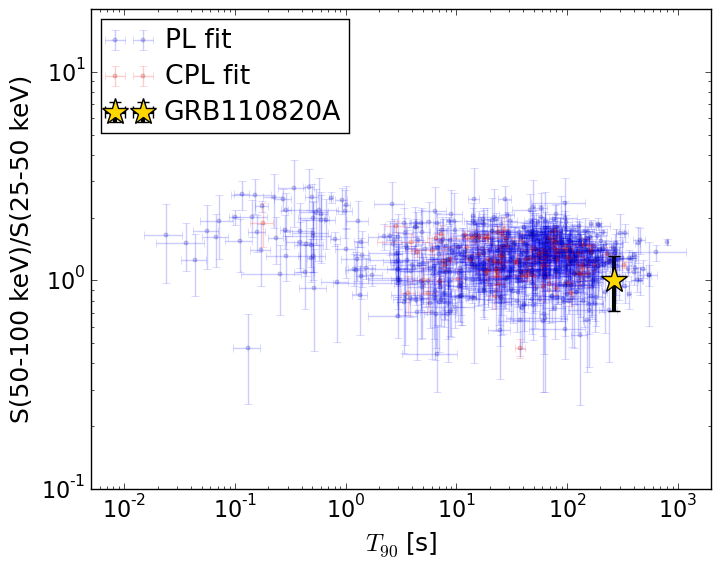
T90                                   = 264.616 sec.
Hardness ratio (energy fluence ratio) = 1.0079988414
S(15-50 keV) vs. S(50-150 keV) plot
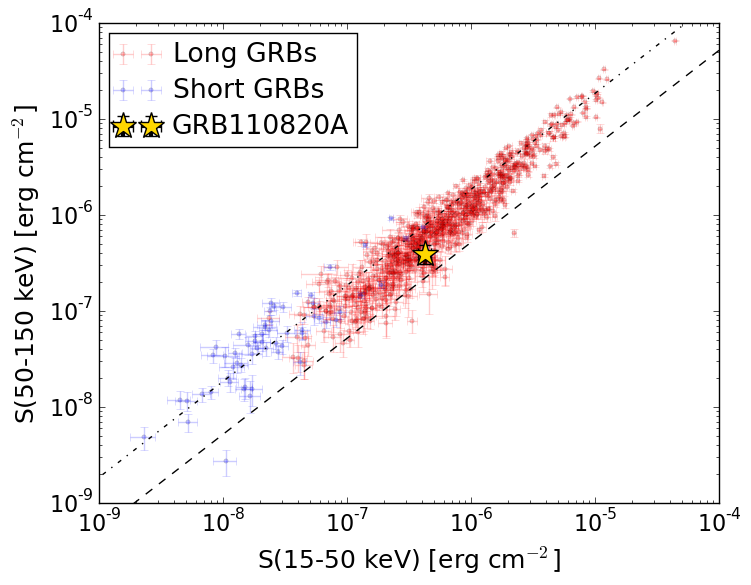
S(15-50 keV)  = 4.245444e-07
S(50-150 keV) = 3.925238e-07
The dash-dotted line and the dashed line traces the fluences calculated from the Band function with Epeak = 15 and 150 keV, respectively. Both lines assume a canonical values of alpha = -1 and beta = -2.5.
Mask shadow pattern
IMX = -9.515336926551408E-02, IMY = 1.796321127300071E-01
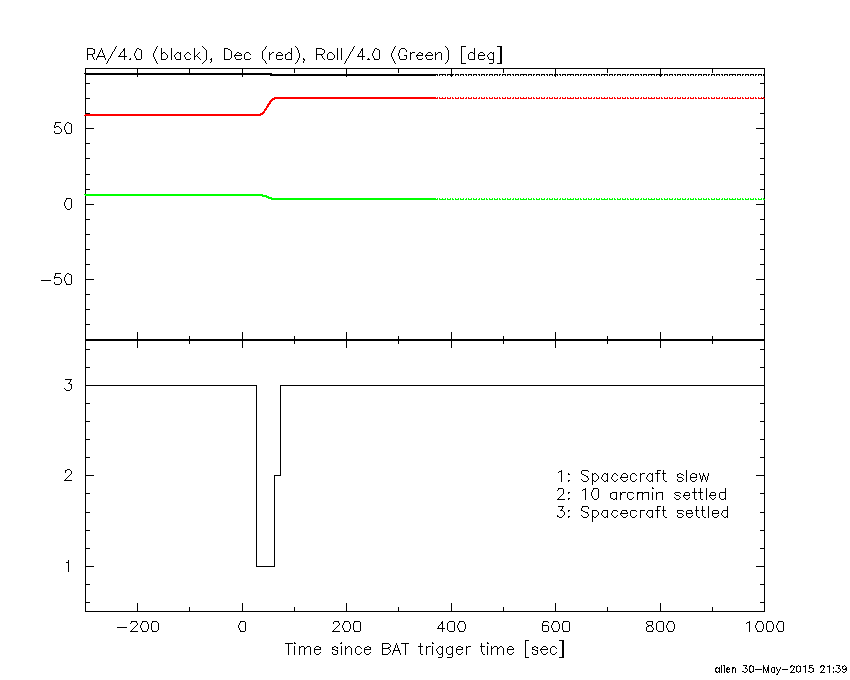
Spacecraft aspect plot
Bright source in the pre-burst/pre-slew/post-slew images
Pre-burst image of 15-350 keV band
Time interval of the image:
-239.072000 -3.072000

# RAcent  DECcent POSerr Theta    Phi  PeakCts   SNR AngSep     Name
#  [deg]    [deg]    ['] [deg]  [deg]                   [']
299.5613  35.2005    1.5  38.0  137.7   2.5818   7.5    1.4	Cyg X-1
308.0910  40.9663    1.5  29.3  134.6   1.8140   7.8    1.2	Cyg X-3
326.2885  38.2109    3.5  24.0  104.7   0.6756   3.3    8.6	Cyg X-2
341.3589  18.3029    2.9  40.7   71.4   2.7315   4.0 ------	UNKNOWN
340.7896  24.0016    2.7  35.0   72.8   1.5306   4.3 ------	UNKNOWN
 51.5190  70.2365    2.3  28.8  -74.5   1.0960   5.0 ------	UNKNOWN
Pre-slew background subtracted image of 15-350 keV band
Time interval of the image:
-3.072000 27.628600

# RAcent  DECcent POSerr Theta    Phi  PeakCts   SNR AngSep     Name
#  [deg]    [deg]    ['] [deg]  [deg]                   [']
299.4579  35.1956    5.5  38.0  137.8  -0.2294  -2.1    6.5	Cyg X-1
308.2700  41.0955    0.0  29.1  134.6  -0.0958  -1.4   11.2	Cyg X-3
326.3728  38.4430    0.0  23.8  104.8  -0.0845  -1.2   11.9	Cyg X-2
 33.1799  27.1680    2.8  45.6   -1.8   0.3697   4.1 ------	UNKNOWN
343.2186  70.3083    0.9  11.5 -117.9   0.6522  12.7 ------	UNKNOWN
Post-slew image of 15-350 keV band
Time interval of the image:
62.628600 962.978000

# RAcent  DECcent POSerr Theta    Phi  PeakCts   SNR AngSep     Name
#  [deg]    [deg]    ['] [deg]  [deg]                   [']
254.4171  35.2852    8.1  56.7  179.1   3.2675   1.4    4.0	Her X-1
299.5606  35.2177    1.9  42.1  134.1   8.4421   6.1    1.7	Cyg X-1
308.1114  40.9123    1.4  34.5  127.1   6.4473   8.4    2.4	Cyg X-3
325.9982  38.4722    0.0  33.1  101.9  -0.4830  -0.5   12.2	Cyg X-2
353.9713  61.6452    2.4   9.6   45.2   1.6972   4.7 ------	UNKNOWN
250.0812  38.0629    3.3  55.6 -175.7   5.7308   3.5 ------	UNKNOWN
242.0171  37.4319    3.1  58.7 -169.1   9.5430   3.8 ------	UNKNOWN
201.8255  58.8483    2.2  48.0 -129.0  10.3092   5.2 ------	UNKNOWN