Analysis Summary
Notes:
- 1) No attempt has been made to eliminate the non-significant decimal places.
- 2) This batgrbproduct analysis is done using the HEASARC data.
- 3) This batgrbproduct analysis is using the flight position for the mask-weighting calculation.
======================================================================
BAT GRB EVENT DATA PROCESSING REPORT
Process Script Ver: batgrbproduct v2.46
Process Start Time: Mon Jan 13 20:53:29 EST 2014
Host Name: batevent1
Current Working Dir: /local/data/batevent/batevent_reproc/trigger503219
======================================================================
Trigger: 00503219 Segment: 000
BAT Trigger Time: 337785651.776 [s; MET]
Trigger Stop: 337785652.8 [s; MET]
UTC: 2011-09-15T13:20:44.408340 [includes UTCF correction]
Where From?: TDRSS position message
BAT
RA: 310.850908926637 Dec: -0.709481126574814 [deg; J2000]
Catalogged Source?: NO
Point Source?: YES
GRB Indicated?: YES [ by BAT flight software ]
Image S/N Ratio: 7.14
Image Trigger?: NO
Rate S/N Ratio: 11.6189500386223 [ if not an image trigger ]
Image S/N Ratio: 7.14
Analysis Position: [ source = BAT ]
RA: 310.850908926637 Dec: -0.709481126574814 [deg; J2000]
Refined Position: [ source = BAT pre-slew burst ]
RA: 310.82767368423 Dec: -0.716067178725618 [deg; J2000]
{ 20h 43m 18.6s , -00d 42' 57.8" }
+/- 1.23753335004595 [arcmin] (estimated 90% radius based on SNR)
+/- 0.475704527899567 [arcmin] (formal 1-sigma fit error)
SNR: 22.433354574969
Angular difference between the analysis and refined position is 1.448934 arcmin
Partial Coding Fraction: 0.2578125 [ including projection effects ]
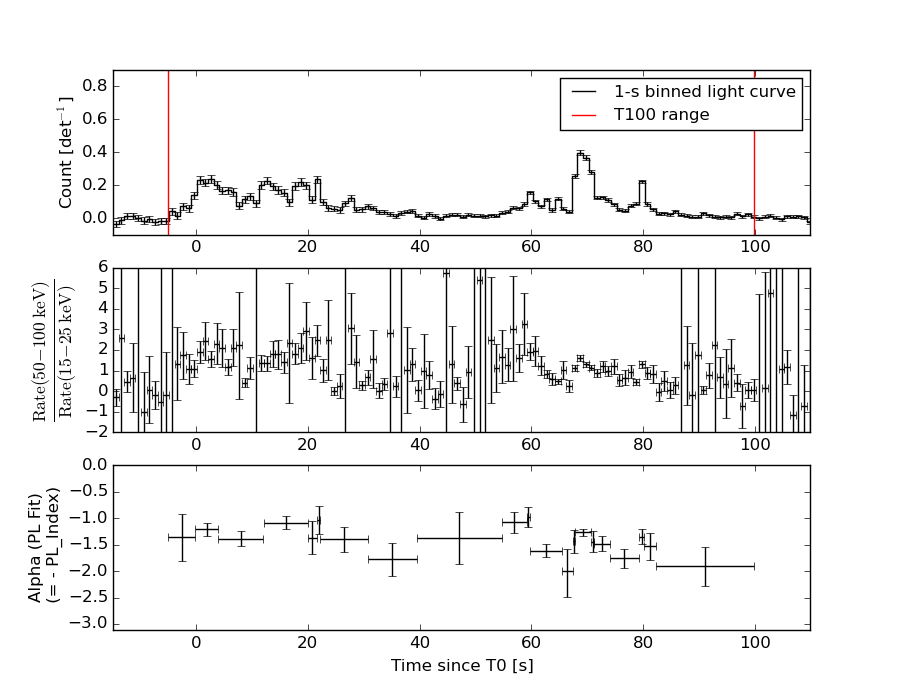
Duration
T90: 79.5679998993874 +/- 2.9824151713098
Measured from: 0.912000000476837
to: 80.4799998998642 [s; relative to TRIGTIME]
T50: 56.9759999513626 +/- 0.896330272847611
Measured from: 11.7799999713898
to: 68.7559999227524 [s; relative to TRIGTIME]
Fluence
Peak Flux (peak 1 second)
Measured from: 68.039999961853
to: 69.039999961853 [s; relative to TRIGTIME]
Total Fluence
Measured from: -4.88400000333786
to: 99.7919999957085 [s; relative to TRIGTIME]
Band 1 Band 2 Band 3 Band 4
15-25 25-50 50-100 100-350 keV
Total 2.177093 3.317228 2.828085 0.704281
0.080239 0.081791 0.073036 0.060619 [error]
Peak 0.093560 0.138952 0.135382 0.039575
0.006304 0.006857 0.006393 0.004916 [error]
[ fluence units of on-axis counts / fully illuminated detector ]
======================================================================
====== Table of the duration information =============================
Value tstart tstop
T100 104.676 -4.884 99.792
T90 79.568 0.912 80.480
T50 56.976 11.780 68.756
Peak 1.000 68.040 69.040
====== Spectral Analysis Summary =====================================
Model : spectral model: simple power-law (PL) and cutoff power-law (CPL)
Ph_index : photon index: E^{Ph_index}
Ph_90err : 90% error of the photon index
Epeak : Epeak in keV
Epeak_90err: 90% error of Epeak
Norm : normalization at 50 keV in both the PL model and CPL model
Nomr_90err : 90% error of the normalization
chi2 : Chi-Squared
dof : degree of freedo
=== Time-averaged spectral analysis ===
(Best model with acceptable fit: CPL)
Model Ph_index Ph_90err_low Ph_90err_hi Epeak Epeak_90err_low Epeak_90err_hi Norm Nomr_90err_low Norm_90err_hi chi2 dof
PL -1.386 -0.053 0.053 - - - 5.77e-03 -1.67e-04 1.67e-04 73.060 57
CPL -0.980 -0.218 0.229 138.238 -30.788 91.763 8.85e-03 -1.77e-03 2.34e-03 62.520 56
=== 1-s peak spectral analysis ===
(Best model with acceptable fit: PL)
Model Ph_index Ph_90err_low Ph_90err_hi Epeak Epeak_90err_low Epeak_90err_hi Norm Nomr_90err_low Norm_90err_hi chi2 dof
PL -1.196 -0.091 0.092 - - - 2.65e-02 -1.34e-03 1.34e-03 52.170 57
CPL -1.096 -0.144 0.357 492.005 -492.005 -492.005 2.96e-02 -4.11e-03 1.34e-02 51.910 56
=== Fluence/Peak Flux Summary ===
Model Band1 Band2 Band3 Band4 Band5 Total
15-25 25-50 50-100 100-350 15-150 15-350 keV
Fluence PL 6.93e-07 1.37e-06 2.09e-06 6.98e-06 5.85e-06 1.11e-05 erg/cm2
90%_error_low -3.98e-08 -4.63e-08 -7.30e-08 -5.42e-07 -1.81e-07 -5.83e-07 erg/cm2
90%_error_hi 4.07e-08 4.62e-08 7.28e-08 5.73e-07 1.81e-07 6.08e-07 erg/cm2
Peak flux PL 8.16e-01 9.85e-01 8.60e-01 1.29e+00 3.11e+00 3.95e+00 ph/cm2/s
90%_error_low -8.07e-02 -5.93e-02 -5.10e-02 -1.58e-01 -1.62e-01 -2.12e-01 ph/cm2/s
90%_error_hi 8.34e-02 5.89e-02 5.07e-02 1.72e-01 1.62e-01 2.14e-01 ph/cm2/s
Fluence CPL 6.28e-07 1.40e-06 2.16e-06 4.15e-06 5.70e-06 8.34e-06 erg/cm2
90%_error_low -5.07e-08 -5.08e-08 -8.32e-08 -9.36e-07 -2.00e-07 -9.47e-07 erg/cm2
90%_error_hi 5.17e-08 5.11e-08 8.39e-08 1.28e-06 1.99e-07 1.27e-06 erg/cm2
Peak flux CPL 7.97e-01 9.91e-01 8.69e-01 1.15e+00 3.10e+00 3.80e+00 ph/cm2/s
90%_error_low -1.01e-01 -6.27e-02 -2.97e-02 -3.62e-01 -1.70e-01 -4.07e-01 ph/cm2/s
90%_error_hi 9.02e-02 6.40e-02 5.97e-02 3.28e-01 1.70e-01 2.57e-01 ph/cm2/s
======================================================================
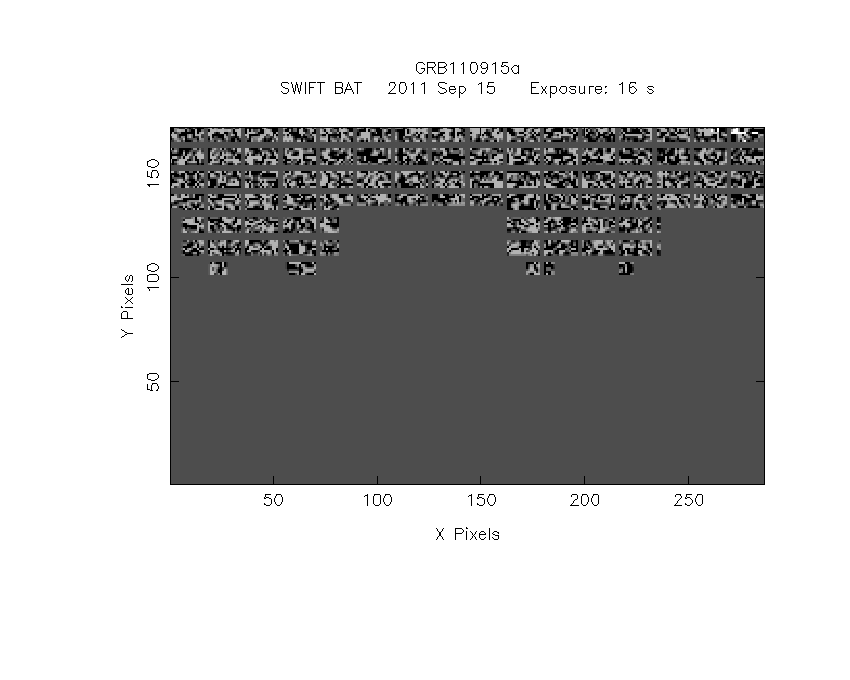
Image
Pre-slew 15.0-350.0 keV image (Event data)
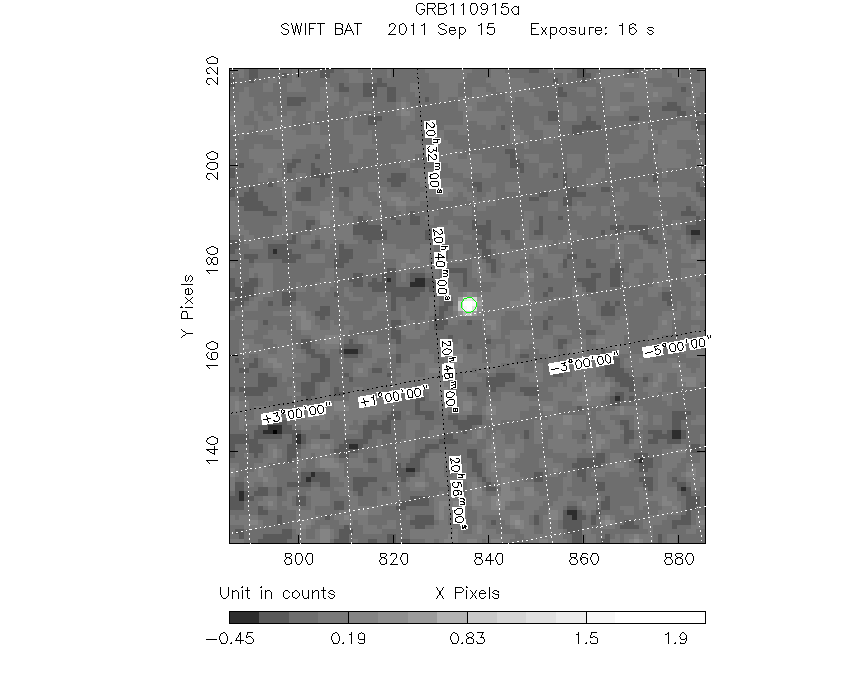
#   RAcent    DECcent   POSerr    Theta     Phi              Peak Cts       SNR   Name
  310.8277    -0.7161   0.0086    32.9944    81.8430         2.2833218     22.433 TRIG_00503219

Foreground time interval of the image:
 -4.884  10.925 (delta_t =  15.809 [sec])
Background time interval of the image:
-414.675 -398.746 (delta_t =  15.930 [sec])
-239.776  -4.884 (delta_t = 234.892 [sec])
Light Curves
Note: The mask-weighted lightcurves have units of either count/det or counts/sec/det, where a det is 0.4 x 0.4 = 0.16 sq cm.
Full-time range; 1 s binning
Other quick-look light curves:
- 64 ms binning (zoomed)
- 16 ms binning (zoomed)
- 8 ms binning (zoomed)
- 2 ms binning (zoomed)
- SN=5 or 10 s binning (full-time range)
- Raw light curve
Spectra
- 64 ms binning (zoomed)
- 16 ms binning (zoomed)
- 8 ms binning (zoomed)
- 2 ms binning (zoomed)
- SN=5 or 10 s binning (full-time range)
- Raw light curve
Spectra
Notes:
- 1) The fitting includes the systematic errors.
- 2) When the burst includes telescope slew time periods, the fitting uses an average response file made from multiple 5-s response files through out the slew time plus single time preiod for the non-slew times, and weighted by the total counts in the corresponding time period using addrmf. An average response file is needed becuase a spectral fit using the pre-slew DRM will introduce some errors in both a spectral shape and a normalization if the PHA file contains a lot of the slew/post-slew time interval.
- 3) For fits to more complicated models (e.g. a power-law over a cutoff power-law), the BAT team has decided to require a chi-square improvement of more than 6 for each extra dof.
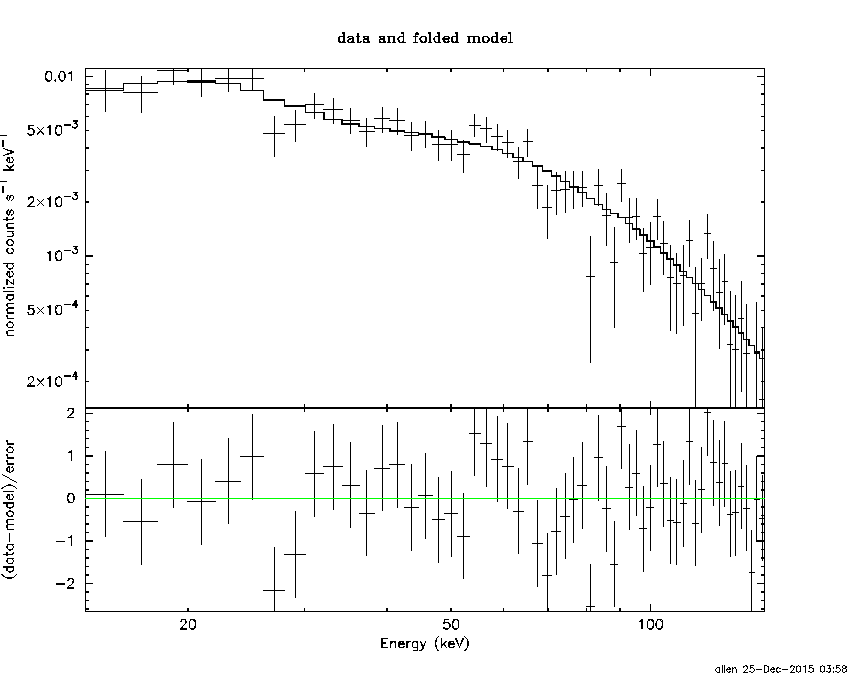
Time averaged spectrum fit using the average DRM
Power-law model
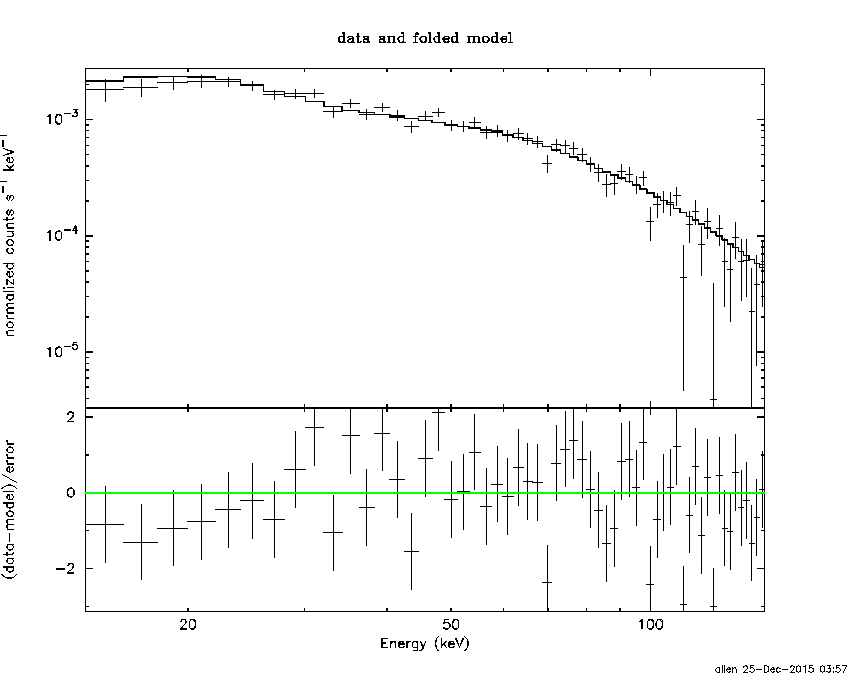
Time interval is from   -4.884 sec. to   99.792 sec.

Spectral model in power-law:
------------------------------------------------------------
Parameters  : value       lower 90%   higher 90%
Photon index: -1.38617     ( -0.0533808   0.0534658 )
Norm@50keV  : 5.76658E-03    ( -0.000167168   0.000167167 )
------------------------------------------------------------
#Fit statistic : Chi-Squared =          73.06 using 59 PHA bins.
# Reduced chi-squared =          1.282 for     57 degrees of freedom
# Null hypothesis probability =   7.446894e-02

Photon flux (15-150 keV)    in 104.7 sec: 0.700101 ( -0.021985  0.022037 ) ph/cm2/s
Energy fluence (15-150 keV)             : 5.85136e-06 ( -1.8092e-07  1.81271e-07 ) ergs/cm2
Cutoff power-law model
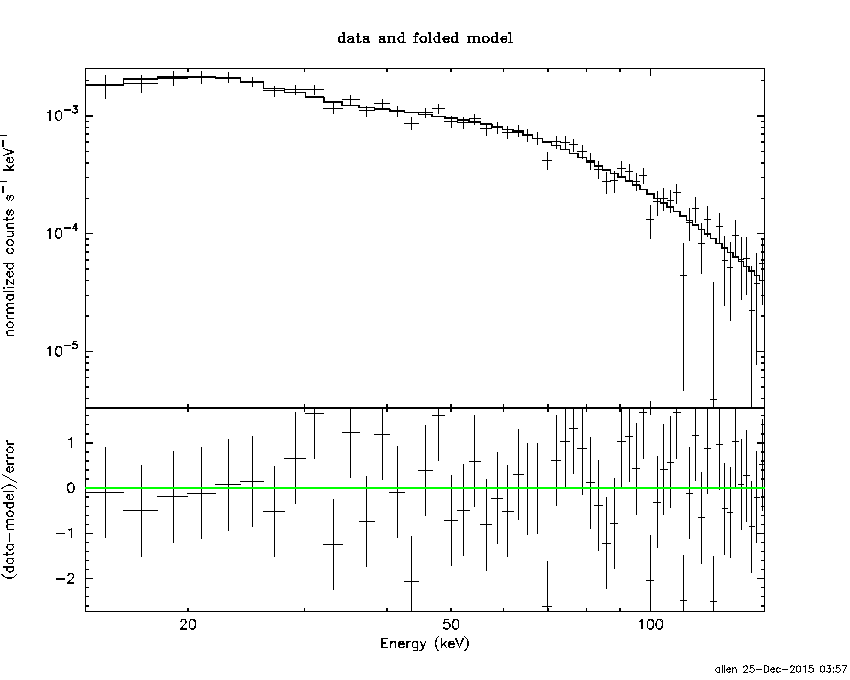
Time interval is from   -4.884 sec. to   99.792 sec.
Spectral model in the cutoff power-law:
------------------------------------------------------------
Parameters  : value       lower 90%   higher 90%
Photon index: -0.979583     ( -0.218081   0.229331 )
Epeak [keV] : 138.238      ( -30.7882 91.763 )
Norm@50keV  : 8.84714E-03    ( -0.00177124   0.00234102 )
------------------------------------------------------------
#Fit statistic : Chi-Squared =          62.52 using 59 PHA bins.
# Reduced chi-squared =          1.116 for     56 degrees of freedom
# Null hypothesis probability =   2.559859e-01

Photon flux (15-150 keV)    in 104.7 sec: 0.681541 ( -0.023866  0.023933 ) ph/cm2/s
Energy fluence (15-150 keV)             : 5.69898e-06 ( -1.99687e-07  1.99048e-07 ) ergs/cm2
1-s peak spectrum fit
Power-law model
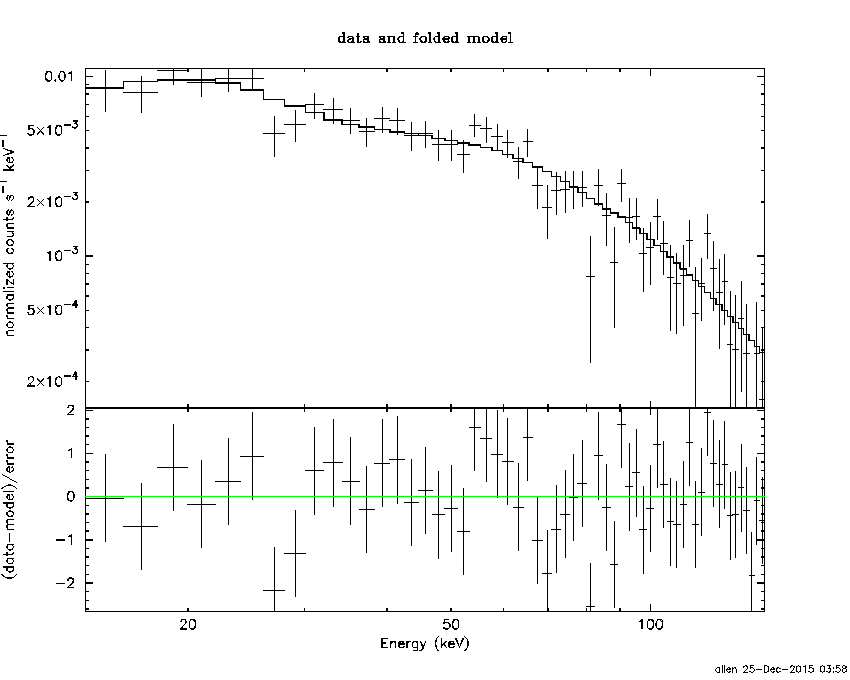
Time interval is from   68.040 sec. to   69.040 sec.

Spectral model in power-law:
------------------------------------------------------------
Parameters  : value       lower 90%   higher 90%
Photon index: -1.19585     ( -0.0910268   0.0915569 )
Norm@50keV  : 2.65235E-02    ( -0.00133959   0.00133959 )
------------------------------------------------------------
#Fit statistic : Chi-Squared =          52.17 using 59 PHA bins.
# Reduced chi-squared =         0.9153 for     57 degrees of freedom
# Null hypothesis probability =   6.564716e-01

Photon flux (15-150 keV)    in 1 sec: 3.11152 ( -0.16204  0.16231 ) ph/cm2/s
Energy fluence (15-150 keV)             : 2.69439e-07 ( -1.52305e-08  1.5302e-08 ) ergs/cm2
Cutoff power-law model
Time interval is from   68.040 sec. to   69.040 sec.
Spectral model in the cutoff power-law:
------------------------------------------------------------
Parameters  : value       lower 90%   higher 90%
Photon index: -1.09551     ( -0.14412   0.357283 )
Epeak [keV] : 492.005      ( -492.027 -492.027 )
Norm@50keV  : 2.95567E-02    ( -0.00410517   0.0134031 )
------------------------------------------------------------
#Fit statistic : Chi-Squared =          51.91 using 59 PHA bins.
# Reduced chi-squared =         0.9270 for     56 degrees of freedom
# Null hypothesis probability =   6.302821e-01

Photon flux (15-150 keV)    in 1 sec: 3.09636 ( -0.16967  0.1695 ) ph/cm2/s
Energy fluence (15-150 keV)             : 2.6767e-07 ( -1.64351e-08  1.61088e-08 ) ergs/cm2
Time-resolved spectra
Distribution
T90 vs. Hardness ratio plot
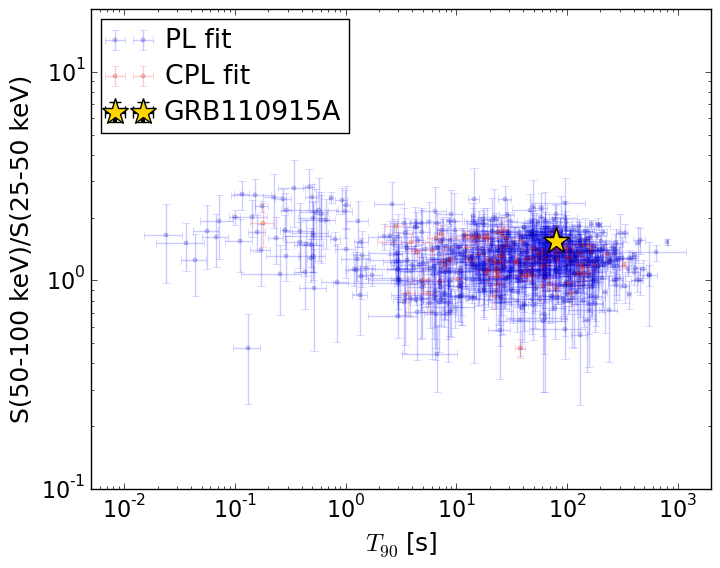
T90                                   = 79.568 sec.
Hardness ratio (energy fluence ratio) = 1.54425733037
S(15-50 keV) vs. S(50-150 keV) plot
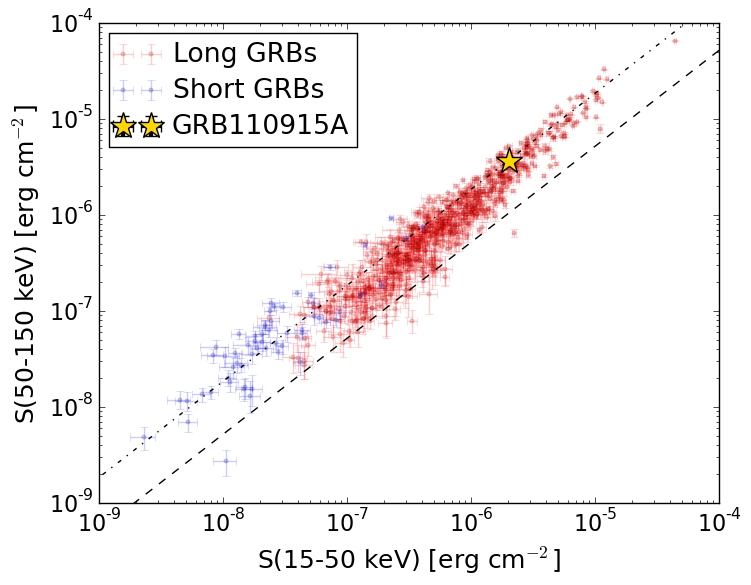
S(15-50 keV)  = 2.0276835e-06
S(50-150 keV) = 3.671287e-06
The dash-dotted line and the dashed line traces the fluences calculated from the Band function with Epeak = 15 and 150 keV, respectively. Both lines assume a canonical values of alpha = -1 and beta = -2.5.
Mask shadow pattern
IMX = 9.212154169850038E-02, IMY = -6.426994306230007E-01
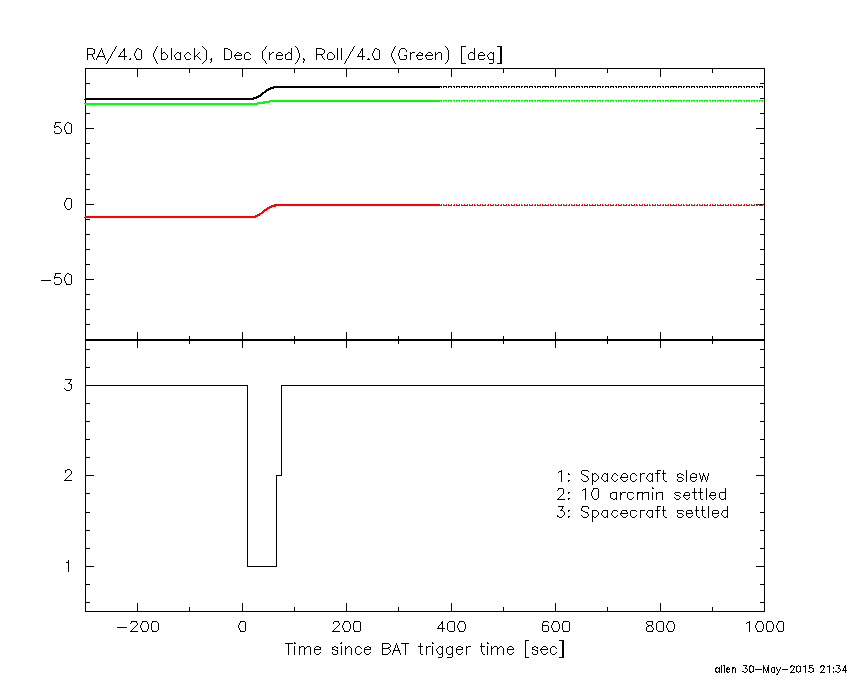
Spacecraft aspect plot
Bright source in the pre-burst/pre-slew/post-slew images
Pre-burst image of 15-350 keV band
Time interval of the image:
-414.675400 -398.745800
-239.776000 -4.884000

# RAcent  DECcent POSerr Theta    Phi  PeakCts   SNR AngSep     Name
#  [deg]    [deg]    ['] [deg]  [deg]                   [']
244.9889 -15.6612    0.5  33.6 -101.0   7.9553  22.3    1.4	Sco X-1
254.5877  35.3196   16.5  49.6  -21.7  -0.2960  -0.7    6.5	Her X-1
256.0322 -37.8454   16.0  35.5 -144.2   0.1897   0.7    2.2	4U 1700-377
256.3969 -36.2965    4.2  34.2 -142.8   0.6652   2.7    7.8	GX 349+2
263.0639 -24.8926    6.8  22.0 -135.0   0.3512   1.7    9.3	GX 1+4
264.8158 -44.4396    7.7  37.7 -159.5   0.3942   1.5    3.2	4U 1735-44
268.2770  -1.5187    3.2  12.6  -51.4   0.6682   3.6    6.8	SW J1753.5-0127
270.3530 -25.0291    1.9  18.1 -150.8   1.1915   6.2    4.8	GX 5-1
270.3231 -25.6406    5.7  18.7 -151.6   0.4207   2.1    6.2	GRS 1758-258
274.0869 -13.8825    6.6   6.8 -134.8   0.3211   1.7   10.4	GX 17+2
275.8990 -30.2706    7.3  21.7 -169.2   0.3131   1.6    5.9	H1820-303
285.0790 -24.9581    7.4  17.3  164.4   0.3415   1.6    3.2	HT1900.1-2455
288.7985  10.9412    1.0  22.1   31.4   2.5201  11.6    0.3	GRS 1915+105
299.6388  35.1516    5.0  48.2   27.3   1.6365   2.3    3.8	Cyg X-1
262.9086 -33.7852    4.9  28.9 -147.9   0.4755   2.4    5.0	GX 354-0
318.6070 -36.5411    3.2  45.6  138.0   2.7992   3.6 ------	UNKNOWN
283.1147 -43.6548    2.8  35.1  178.6   1.0385   4.2 ------	UNKNOWN
273.0358  21.6521    2.8  30.9   -6.1   0.9476   4.2 ------	UNKNOWN
236.5852 -48.7102    2.8  53.3 -142.3   4.8006   4.0 ------	UNKNOWN
Pre-slew background subtracted image of 15-350 keV band
Time interval of the image:
-4.884000 10.924610

# RAcent  DECcent POSerr Theta    Phi  PeakCts   SNR AngSep     Name
#  [deg]    [deg]    ['] [deg]  [deg]                   [']
244.9528 -15.7493   42.1  33.7 -101.1   0.0205   0.3    6.7	Sco X-1
254.5877  35.3194   14.2  49.6  -21.7   0.0773   0.8    6.5	Her X-1
256.1082 -37.7258    4.9  35.4 -144.2   0.1356   2.3    9.1	4U 1700-377
256.4168 -36.5638    5.8  34.4 -143.2   0.1112   2.0    8.5	GX 349+2
262.9550 -24.8882    7.6  22.0 -134.8  -0.0695  -1.5    9.0	GX 1+4
264.9252 -44.6120    0.0  37.8 -159.7   0.1475   2.6   12.5	4U 1735-44
268.2131  -1.3152    0.0  12.8  -50.8   0.0451   1.1   12.4	SW J1753.5-0127
270.2745 -25.2275    4.4  18.3 -150.9   0.1122   2.7    8.9	GX 5-1
270.4625 -25.7442    4.1  18.7 -152.1   0.1318   3.1    8.6	GRS 1758-258
274.1513 -13.8960   33.3   6.8 -135.3  -0.0147  -0.3   11.9	GX 17+2
275.9188 -30.4533    5.9  21.8 -169.4  -0.0861  -2.0    5.2	H1820-303
285.1197 -24.8485   44.4  17.2  164.1  -0.0115  -0.3    6.3	HT1900.1-2455
288.7347  10.8380    5.3  22.0   31.4  -0.1067  -2.2    7.5	GRS 1915+105
299.4768  35.0738    0.0  48.0   27.2   0.4571   2.9    9.5	Cyg X-1
262.8407 -33.6835   23.6  28.9 -147.7  -0.0237  -0.5   11.7	GX 354-0
313.4288 -10.8628    2.8  34.3  100.7   0.4153   4.2 ------	UNKNOWN
310.8277  -0.7161    0.5  33.0   81.8   2.2833  22.4 ------	UNKNOWN
235.9632 -46.4358    2.1  52.4 -139.6   1.2068   5.6 ------	UNKNOWN
236.5813 -27.2293    2.3  43.8 -116.3   0.9107   5.1 ------	UNKNOWN
Post-slew image of 15-350 keV band
Time interval of the image:
65.324620 962.343100

# RAcent  DECcent POSerr Theta    Phi  PeakCts   SNR AngSep     Name
#  [deg]    [deg]    ['] [deg]  [deg]                   [']
270.3033 -25.1124    5.5  46.1 -128.8   3.2340   2.1    2.3	GX 5-1
270.1655 -25.5821   82.8  46.4 -129.3  -0.2314  -0.1   12.2	GRS 1758-258
274.0909 -14.1855    8.4  38.8 -115.6  -1.4233  -1.4   10.2	GX 17+2
276.0317 -30.3227    5.8  44.4 -138.7   1.8734   2.0    6.1	H1820-303
285.0902 -25.0028    3.3  34.8 -139.9   1.9416   3.5    5.7	HT1900.1-2455
288.8066  10.9551    0.9  24.8  -64.9   6.8805  12.3    0.8	GRS 1915+105
299.6237  35.2268    1.9  37.4  -18.7   3.2763   6.0    2.2	Cyg X-1
308.0940  40.9568    1.7  41.7   -6.7   4.5830   6.6    0.8	Cyg X-3
326.1258  38.4374    4.6  41.6   14.6   1.8646   2.5    7.3	Cyg X-2
344.2689  10.2047    3.0  35.0   67.4   4.3312   3.8 ------	UNKNOWN
341.1425  35.7567    3.3  46.1   31.1   4.5307   3.5 ------	UNKNOWN
313.1320 -18.9295    2.6  18.4  169.5   1.8011   4.4 ------	UNKNOWN
310.8196  -0.7528    1.4   0.0 -162.4   3.5420   8.3 ------	UNKNOWN
307.8151   8.1086    2.8   9.3  -22.3   1.6485   4.2 ------	UNKNOWN
285.1379   0.6280    2.9  25.7  -90.6   2.1925   4.0 ------	UNKNOWN
284.3243  46.5150    2.8  52.6  -26.3   4.9201   4.1 ------	UNKNOWN
270.7558 -45.2307    3.5  56.8 -150.7   8.6163   3.3 ------	UNKNOWN
269.6757  -4.4598    3.5  41.3  -99.5   7.9320   3.3 ------	UNKNOWN