Analysis Summary
Notes:
- 1) No attempt has been made to eliminate the non-significant decimal places.
- 2) This batgrbproduct analysis is done using the HEASARC data.
- 3) This batgrbproduct analysis is using the flight position for the mask-weighting calculation.
======================================================================
                  BAT GRB EVENT DATA PROCESSING REPORT
    Process Script Ver: batgrbproduct v2.46
    Process Start Time: Mon Jan 13 20:22:54 EST 2014
             Host Name: batevent1
   Current Working Dir: /local/data/batevent/batevent_reproc/trigger504215
======================================================================

  Trigger: 00504215      Segment: 000

  BAT Trigger Time: 338867499.2   [s; MET]
      Trigger Stop: 338867507.392   [s; MET]
               UTC: 2011-09-28T01:51:31.789800    [includes UTCF correction]
       Where From?: TDRSS position message

  BAT
    RA: 257.754544715356   Dec: 36.5702621705059  [deg; J2000]

     Catalogged Source?: NO
     Point Source?:      YES
     GRB Indicated?:     YES    [ by BAT flight software ]
     Image S/N Ratio:    7.03
     Image Trigger?:     NO
     Rate S/N Ratio:     8.54400374531753  [ if not an image trigger ]
     Image S/N Ratio:    7.03

  Analysis Position:   [ source = BAT ]
    RA: 257.754544715356   Dec: 36.5702621705059  [deg; J2000]

  Refined Position:   [ source = BAT pre-slew burst ]
    RA: 257.758017220655   Dec: 36.5549774931595  [deg; J2000]
        { 17h 11m 01.9s , +36d 33' 17.9" }
         +/- 2.19340753528357 [arcmin] (estimated 90% radius based on SNR)
         +/- 1.07181645577845 [arcmin] (formal 1-sigma fit error)
    SNR: 9.90387270752285

  Angular difference between the analysis and refined position is 0.932224 arcmin

  Partial Coding Fraction: 0.375    [ including projection effects ]

  Duration
     T90: 20.879999935627 +/- 4.53487198773953
        Measured from: 1.77200001478195
                   to: 22.6519999504089     [s; relative to TRIGTIME]
     T50: 13.0919999480247 +/- 6.51049919378927
        Measured from: 3.75999999046326
                   to: 16.851999938488     [s; relative to TRIGTIME]


  Fluence
     Peak Flux  (peak 1 second)
        Measured from: 6.8400000333786
                   to: 7.8400000333786     [s; relative to TRIGTIME]
     Total Fluence
        Measured from: -1.08799999952316
                   to: 27.8759999871254     [s; relative to TRIGTIME]

             Band 1     Band 2     Band 3     Band 4
              15-25      25-50     50-100    100-350     keV
 Total     0.146344   0.271691   0.358845   0.152838
           0.055059   0.052675   0.044831   0.037669 [error]
 Peak      0.020270   0.037728   0.033373   0.019569
           0.010194   0.009693   0.008360   0.007198 [error]

     [ fluence units of on-axis counts / fully illuminated detector ]

======================================================================


====== Table of the duration information =============================

        Value   tstart    tstop
T100   28.964   -1.088   27.876
T90    20.880    1.772   22.652
T50    13.092    3.760   16.852
Peak    1.000    6.840    7.840


====== Spectral Analysis Summary =====================================

Model      : spectral model: simple power-law (PL) and cutoff power-law (CPL)
Ph_index   : photon index: E^{Ph_index}
Ph_90err   : 90% error of the photon index
Epeak      : Epeak in keV
Epeak_90err: 90% error of Epeak
Norm       : normalization at 50 keV in both the PL model and CPL model
Nomr_90err : 90% error of the normalization
chi2       : Chi-Squared
dof        : degree of freedo

=== Time-averaged spectral analysis ===
(Best model with acceptable fit: PL)

Model Ph_index Ph_90err_low Ph_90err_hi  Epeak  Epeak_90err_low  Epeak_90err_hi  Norm       Nomr_90err_low    Norm_90err_hi    chi2    dof
PL      -1.039    -0.289      0.313       -           -               -         2.27e-03     -4.01e-04          3.89e-04      44.980   57
CPL     -0.845    -1.449     -1.151      373.844      N/A           N/A         2.72e-03        N/A               N/A         45.010   56


=== 1-s peak spectral analysis ===
(Best model with acceptable fit: PL)

Model Ph_index Ph_90err_low Ph_90err_hi  Epeak  Epeak_90err_low  Epeak_90err_hi  Norm       Nomr_90err_low    Norm_90err_hi    chi2    dof
PL      -1.498     -0.469     0.478       -           -               -         7.12e-03     -1.97e-03          1.97e-03      59.600   57
CPL     -0.252     -1.615     3.745       71.677     -41.432       -71.677      2.91e-02     -2.91e-02          1.71e+00      58.620   56


=== Fluence/Peak Flux Summary ===

              Model    Band1     Band2     Band3     Band4     Band5     Total
                       15-25     25-50    50-100    100-350    15-150    15-350    keV
Fluence         PL   5.47e-08  1.33e-07  2.60e-07  1.25e-06  7.02e-07  1.69e-06   erg/cm2
      90%_error_low -1.93e-08 -3.07e-08 -4.20e-08 -4.18e-07 -1.11e-07 -4.35e-07   erg/cm2
      90%_error_hi   2.24e-08  3.00e-08  4.16e-08  5.62e-07  1.11e-07  5.55e-07   erg/cm2
Peak flux       PL   2.93e-01  2.95e-01  2.09e-01  2.35e-01  8.89e-01  1.03e+00   ph/cm2/s
      90%_error_low -1.35e-01 -9.46e-02 -6.74e-02 -1.24e-01 -2.61e-01 -2.85e-01   ph/cm2/s
      90%_error_hi   1.59e-01  9.24e-02  6.62e-02  1.87e-01  2.66e-01  2.85e-01   ph/cm2/s

Fluence        CPL   5.38e-08  1.34e-07  2.62e-07  1.23e-06  7.01e-07  1.60e-06   erg/cm2
      90%_error_low -2.61e-08 -3.10e-08 -4.37e-08 -8.71e-07 -1.13e-07 -7.91e-07   erg/cm2
      90%_error_hi   1.69e-08  3.07e-08  5.55e-08  3.07e-07  1.12e-07  6.11e-07   erg/cm2
Peak flux      CPL   2.27e-01  3.23e-01  2.29e-01  8.09e-02  8.38e-01  8.60e-01   ph/cm2/s
      90%_error_low -1.57e-01 -1.10e-01 -7.99e-02 -8.09e-02 -2.75e-01 -2.94e-01   ph/cm2/s
      90%_error_hi   1.92e-01  1.18e-01  8.34e-02  2.11e-01  2.80e-01  3.58e-01   ph/cm2/s

======================================================================
Image
Pre-slew 15.0-350.0 keV image (Event data)
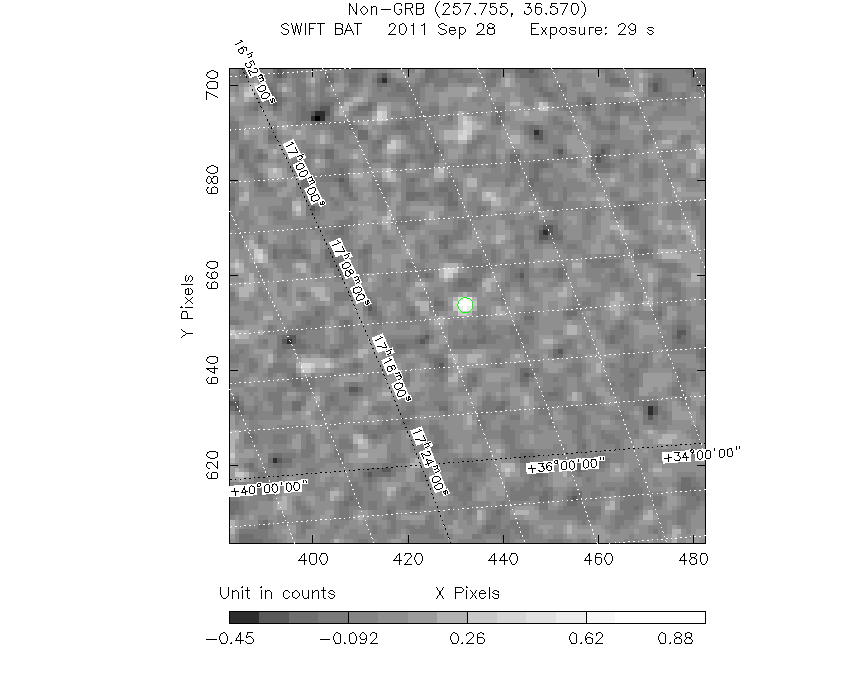
#   RAcent    DECcent   POSerr    Theta     Phi              Peak Cts       SNR   Name
  257.7580    36.5550   0.0195    45.3239   -21.5819         1.0100310      9.904 TRIG_00504215

Foreground time interval of the image:
 -1.088  27.876 (delta_t =  28.964 [sec])
Background time interval of the image:
-239.200  -1.088 (delta_t = 238.112 [sec])
Light Curves
Note: The mask-weighted lightcurves have units of either count/det or counts/sec/det, where a det is 0.4 x 0.4 = 0.16 sq cm.
Full-time range; 1 s binning
Other quick-look light curves:
- 64 ms binning (zoomed)
- 16 ms binning (zoomed)
- 8 ms binning (zoomed)
- 2 ms binning (zoomed)
- SN=5 or 10 s binning (full-time range)
- Raw light curve
Spectra
- 64 ms binning (zoomed)
- 16 ms binning (zoomed)
- 8 ms binning (zoomed)
- 2 ms binning (zoomed)
- SN=5 or 10 s binning (full-time range)
- Raw light curve
Spectra
Notes:
- 1) The fitting includes the systematic errors.
- 2) When the burst includes telescope slew time periods, the fitting uses an average response file made from multiple 5-s response files through out the slew time plus single time preiod for the non-slew times, and weighted by the total counts in the corresponding time period using addrmf. An average response file is needed becuase a spectral fit using the pre-slew DRM will introduce some errors in both a spectral shape and a normalization if the PHA file contains a lot of the slew/post-slew time interval.
- 3) For fits to more complicated models (e.g. a power-law over a cutoff power-law), the BAT team has decided to require a chi-square improvement of more than 6 for each extra dof.
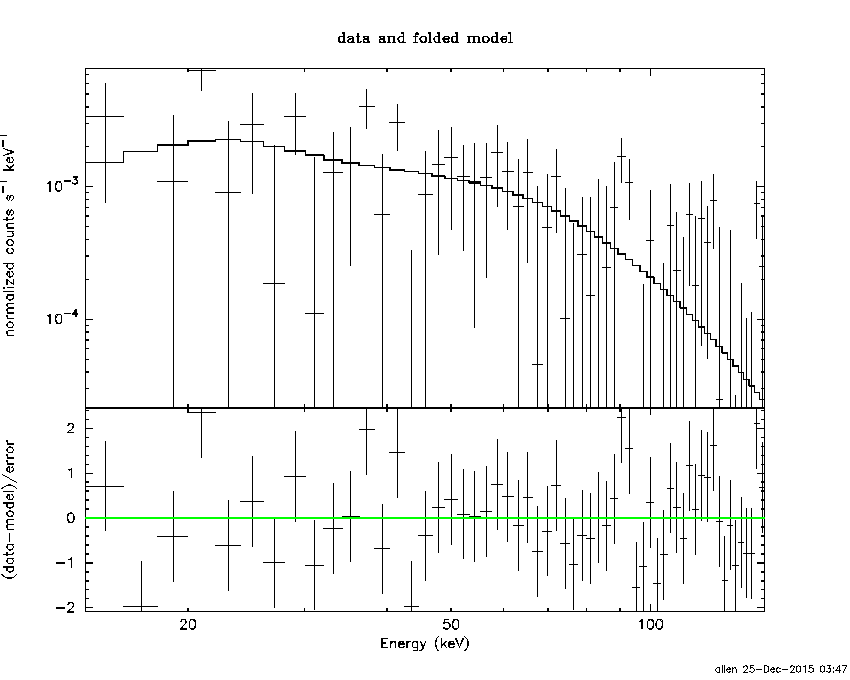
Time averaged spectrum fit using the average DRM
Power-law model
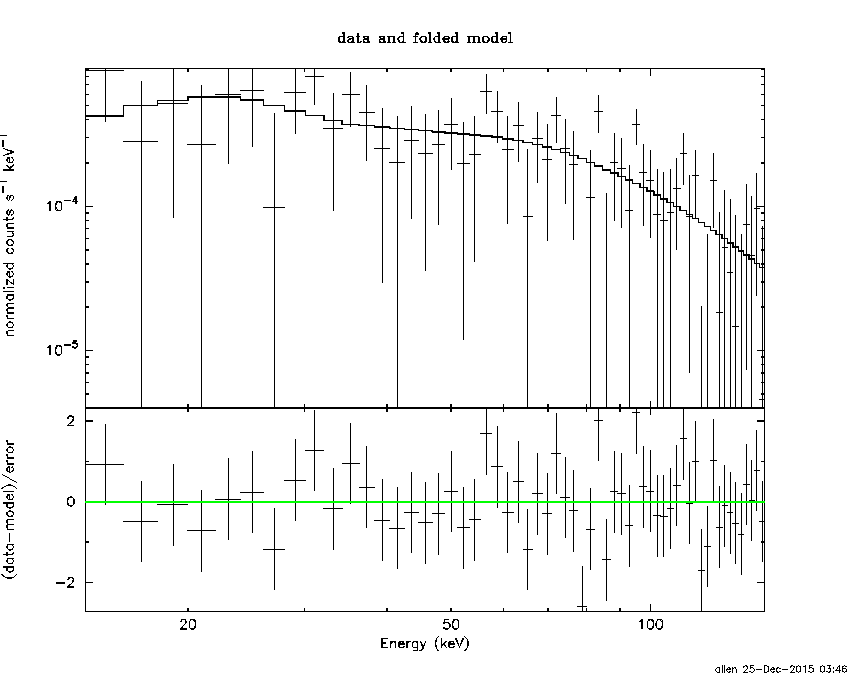
Time interval is from   -1.088 sec. to   27.876 sec.

Spectral model in power-law:
------------------------------------------------------------
Parameters  : value       lower 90%   higher 90%
Photon index: -1.03884     ( -0.289158   0.313208 )
Norm@50keV  : 2.27228E-03    ( -0.000400974   0.000388798 )
------------------------------------------------------------
#Fit statistic : Chi-Squared =          44.98 using 59 PHA bins.
# Reduced chi-squared =         0.7891 for     57 degrees of freedom
# Null hypothesis probability =   8.754801e-01

Photon flux (15-150 keV)    in 28.96 sec: 0.262228 ( -0.047492  0.048438 ) ph/cm2/s
Energy fluence (15-150 keV)             : 7.02115e-07 ( -1.11045e-07  1.11106e-07 ) ergs/cm2
Cutoff power-law model
Time interval is from   -1.088 sec. to   27.876 sec.
Spectral model in the cutoff power-law:
------------------------------------------------------------
Parameters  : value       lower 90%   higher 90%
Photon index: -2.03707     ( -0.256232   0.0416287 )
Epeak [keV] : 13.1421      (   )
Norm@50keV  : 2.25032E-04    (     )
------------------------------------------------------------
#Fit statistic : Chi-Squared =          44.58 using 59 PHA bins.
# Reduced chi-squared =         0.7960 for     56 degrees of freedom
# Null hypothesis probability =   8.640640e-01

Photon flux (15-150 keV)    in 28.96 sec: 0.261345 ( -0.050384  0.04426 ) ph/cm2/s
Energy fluence (15-150 keV)             : 7.01017e-07 ( -1.13489e-07  1.11941e-07 ) ergs/cm2
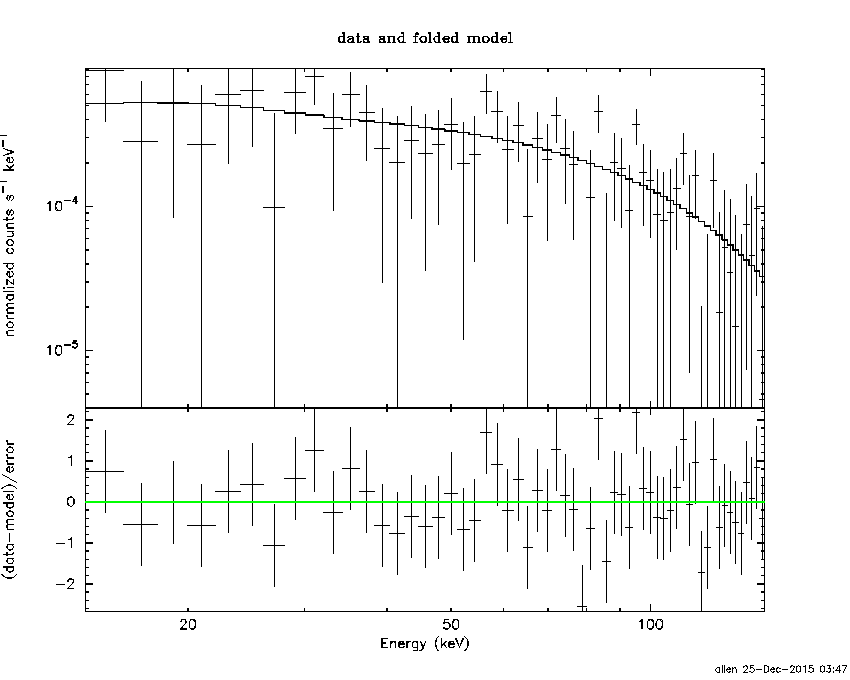
1-s peak spectrum fit
Power-law model
Time interval is from    6.840 sec. to    7.840 sec.

Spectral model in power-law:
------------------------------------------------------------
Parameters  : value       lower 90%   higher 90%
Photon index: -1.49836     ( -0.468599   0.478356 )
Norm@50keV  : 7.12026E-03    ( -0.00196869   0.00196751 )
------------------------------------------------------------
#Fit statistic : Chi-Squared =          59.60 using 59 PHA bins.
# Reduced chi-squared =          1.046 for     57 degrees of freedom
# Null hypothesis probability =   3.814083e-01

Photon flux (15-150 keV)    in 1 sec: 0.888508 ( -0.261395  0.265942 ) ph/cm2/s
Energy fluence (15-150 keV)             : 6.75741e-08 ( -1.94425e-08  1.96607e-08 ) ergs/cm2
Cutoff power-law model
Time interval is from    6.840 sec. to    7.840 sec.
Spectral model in the cutoff power-law:
------------------------------------------------------------
Parameters  : value       lower 90%   higher 90%
Photon index: -0.252122     ( -1.61459   3.74543 )
Epeak [keV] : 71.6773      ( -41.4317 -71.6767 )
Norm@50keV  : 2.90795E-02    ( -0.0290805   1.71167 )
------------------------------------------------------------
#Fit statistic : Chi-Squared =          58.62 using 59 PHA bins.
# Reduced chi-squared =          1.047 for     56 degrees of freedom
# Null hypothesis probability =   3.796965e-01

Photon flux (15-150 keV)    in 1 sec: 0.838027 ( -0.274644  0.279683 ) ph/cm2/s
Energy fluence (15-150 keV)             : 6.25043e-08 ( -2.10366e-08  2.16488e-08 ) ergs/cm2
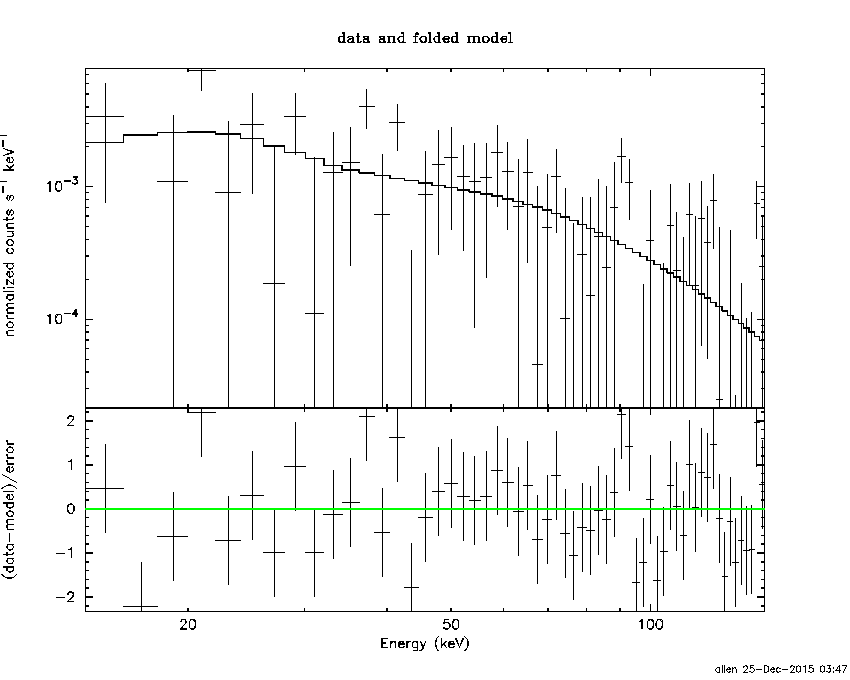
Time-resolved spectra
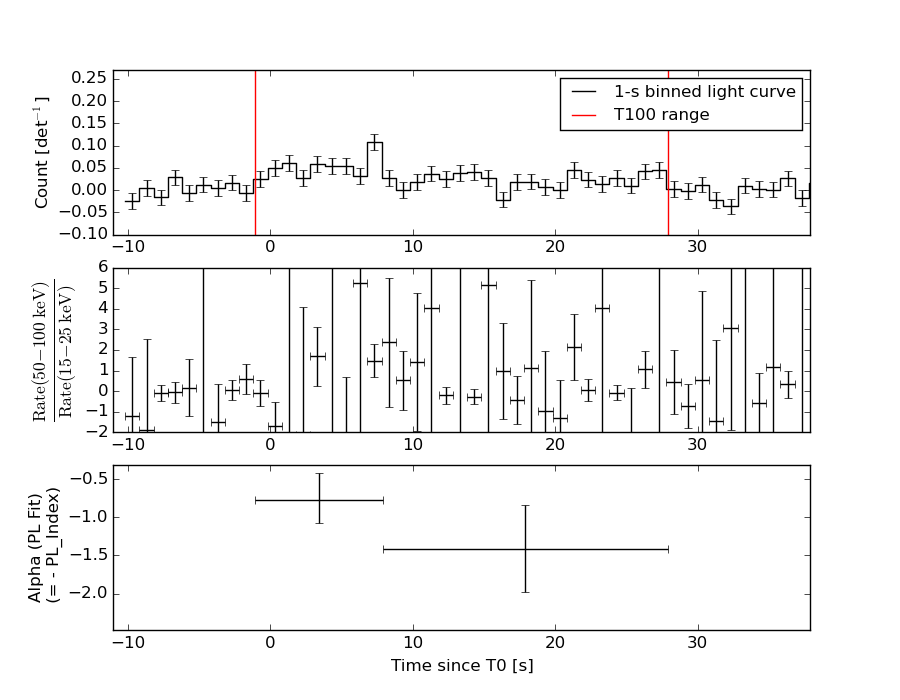
Distribution
T90 vs. Hardness ratio plot
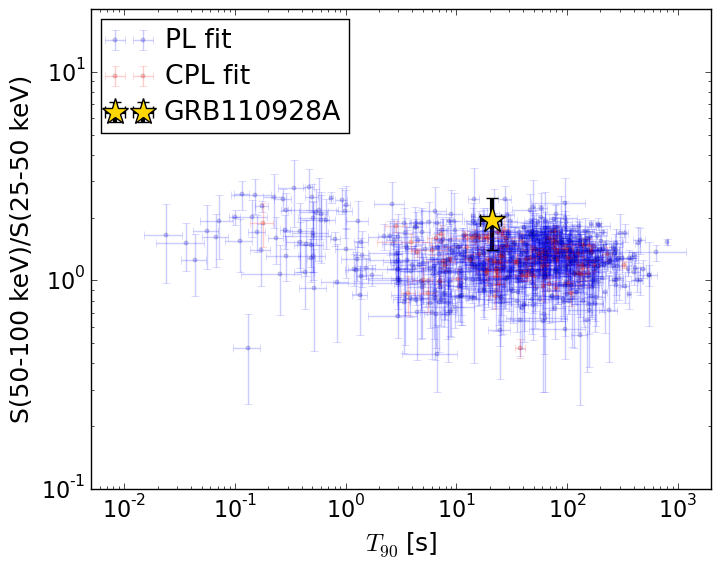
T90                                   = 20.88 sec.
Hardness ratio (energy fluence ratio) = 1.94688363179
S(15-50 keV) vs. S(50-150 keV) plot
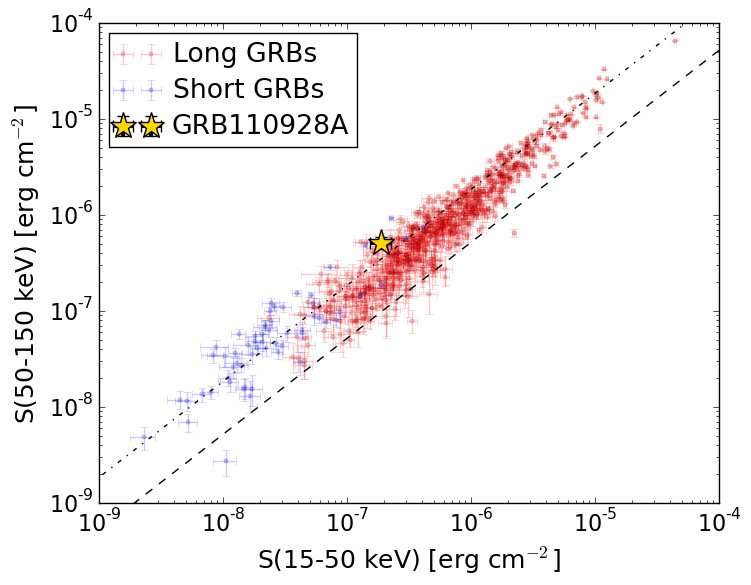
S(15-50 keV)  = 1.8802425e-07
S(50-150 keV) = 5.140864e-07
The dash-dotted line and the dashed line traces the fluences calculated from the Band function with Epeak = 15 and 150 keV, respectively. Both lines assume a canonical values of alpha = -1 and beta = -2.5.
Mask shadow pattern
IMX = 9.404664190719637E-01, IMY = 3.720125006224086E-01
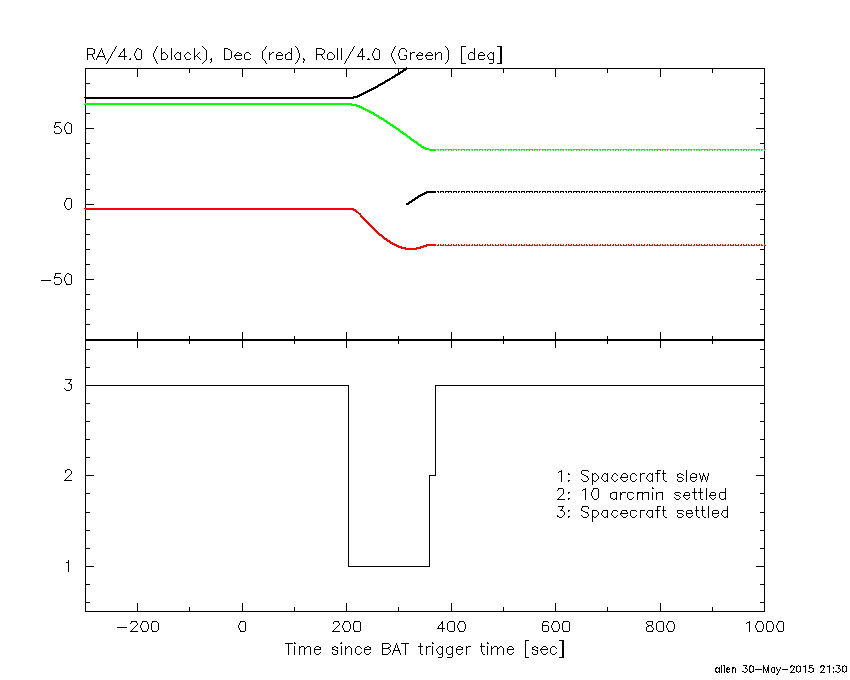
Spacecraft aspect plot
Bright source in the pre-burst/pre-slew/post-slew images
Pre-burst image of 15-350 keV band
Time interval of the image:
-239.200000 -1.088000

# RAcent  DECcent POSerr Theta    Phi  PeakCts   SNR AngSep     Name
#  [deg]    [deg]    ['] [deg]  [deg]                   [']
244.9737 -15.6398    0.7  38.2 -106.2   7.5940  15.5    0.3	Sco X-1
254.3376  35.2743    6.3  46.0  -25.8   0.6915   1.8    7.2	Her X-1
256.0084 -37.8603    2.0  42.0 -143.8   1.9391   5.8    1.4	4U 1700-377
256.4275 -36.4212   11.1  40.7 -142.8   0.3436   1.0    0.4	GX 349+2
263.1000 -24.6516   10.0  28.1 -136.7   0.2605   1.1    7.5	GX 1+4
264.8339 -44.6046    4.6  44.2 -157.3   0.8233   2.5   10.1	4U 1735-44
268.4534  -1.5914    5.2  13.2  -78.7   0.4467   2.2    9.8	SW J1753.5-0127
270.1457 -25.1807   35.7  24.8 -149.1  -0.0615  -0.3    9.7	GX 5-1
270.2788 -25.7149    5.1  25.2 -150.0   0.4712   2.5    2.1	GRS 1758-258
274.0864 -14.0327    2.7  13.3 -141.1   0.8013   4.3    4.7	GX 17+2
275.7523 -30.2267    4.3  27.8 -163.6   0.5252   2.7   12.3	H1820-303
285.1763 -24.9370    5.2  22.2  176.9   0.4264   2.2    7.7	HT1900.1-2455
288.8247  11.0430    2.2  15.8   32.7   0.9931   5.3    6.1	GRS 1915+105
299.6490  35.2070    2.7  41.8   27.9   1.6623   4.3    2.9	Cyg X-1
308.0385  40.9720   10.3  50.1   31.6   1.1954   1.1    3.5	Cyg X-3
262.8656 -33.8040    4.6  35.4 -147.1   0.6221   2.5    6.4	GX 354-0
319.6476   6.5064    2.9  39.2   81.5   2.9757   4.0 ------	UNKNOWN
255.1444  23.3479    2.7  36.8  -37.4   1.2174   4.3 ------	UNKNOWN
Pre-slew background subtracted image of 15-350 keV band
Time interval of the image:
-1.088000 27.876000

# RAcent  DECcent POSerr Theta    Phi  PeakCts   SNR AngSep     Name
#  [deg]    [deg]    ['] [deg]  [deg]                   [']
245.0152 -15.5218    6.7  38.1 -106.0   0.2585   1.7    7.4	Sco X-1
254.5883  35.3853    7.9  45.9  -25.4  -0.1654  -1.5    6.9	Her X-1
256.0210 -37.8038    9.5  42.0 -143.8   0.1232   1.2    2.9	4U 1700-377
256.5989 -36.5064   10.1  40.7 -143.1   0.1115   1.1    9.3	GX 349+2
262.8699 -24.7004    6.0  28.2 -136.4  -0.1285  -1.9    8.0	GX 1+4
264.8418 -44.5156   36.2  44.1 -157.3  -0.0299  -0.3    5.8	4U 1735-44
268.2278  -1.5767    6.0  13.4  -78.8   0.1054   1.9   11.2	SW J1753.5-0127
270.2130 -25.2174    3.5  24.8 -149.3   0.2087   3.3    9.1	GX 5-1
270.2498 -25.8899   24.7  25.4 -150.1   0.0287   0.5    9.3	GRS 1758-258
274.0944 -14.1126   31.7  13.4 -141.4  -0.0197  -0.4    6.9	GX 17+2
275.7547 -30.2471    6.6  27.8 -163.6  -0.1026  -1.7   11.4	H1820-303
285.0615 -25.0626   50.4  22.4  177.2   0.0134   0.2    8.6	HT1900.1-2455
288.7713  10.8509   16.8  15.6   32.9   0.0409   0.7    5.9	GRS 1915+105
299.4391  35.2110   16.9  41.7   27.7   0.0752   0.7    7.4	Cyg X-1
308.1278  40.9424    2.3  50.1   31.7   1.3535   5.0    1.0	Cyg X-3
262.8258 -33.7592   43.3  35.4 -147.0   0.0199   0.3    9.3	GX 354-0
257.7591  36.5542    1.2  45.3  -21.6   1.0245  10.0 ------	UNKNOWN
Post-slew image of 15-350 keV band
Time interval of the image:
359.100600 962.835500

# RAcent  DECcent POSerr Theta    Phi  PeakCts   SNR AngSep     Name
#  [deg]    [deg]    ['] [deg]  [deg]                   [']
 31.9618 -16.5955    2.3  10.5  122.9   1.4641   5.0 ------	UNKNOWN
 45.3241 -13.3780    2.9  18.2  169.3   1.1540   4.0 ------	UNKNOWN
327.8559 -43.5322    2.7  53.8   -0.0   4.2199   4.3 ------	UNKNOWN
 85.3579   2.8486    3.2  59.1 -166.1   8.5270   3.6 ------	UNKNOWN
 83.1840 -16.3163    4.0  48.0 -146.4   2.5072   2.9 ------	UNKNOWN
  1.7016 -75.3596    4.1  50.6  -44.6   4.8919   2.9 ------	UNKNOWN
 51.8836 -69.3882    3.7  43.8  -64.0   5.6062   3.2 ------	UNKNOWN