Analysis Summary
Notes:
- 1) No attempt has been made to eliminate the non-significant decimal places.
- 2) This batgrbproduct analysis is done using the HEASARC data.
- 3) This batgrbproduct analysis is using the flight position for the mask-weighting calculation.
======================================================================
BAT GRB EVENT DATA PROCESSING REPORT
Process Script Ver: batgrbproduct v2.46
Process Start Time: Mon Jan 13 19:54:10 EST 2014
Host Name: batevent1
Current Working Dir: /local/data/batevent/batevent_reproc/trigger505646
======================================================================
Trigger: 00505646 Segment: 000
BAT Trigger Time: 340483032 [s; MET]
Trigger Stop: 340483136 [s; MET]
UTC: 2011-10-16T18:37:04.526260 [includes UTCF correction]
Where From?: TDRSS position message
BAT
RA: 153.806002279747 Dec: 27.4756888348294 [deg; J2000]
Catalogged Source?: NO
Point Source?: YES
GRB Indicated?: YES [ by BAT flight software ]
Image S/N Ratio: 8.49
Image Trigger?: YES
Rate S/N Ratio: 0 [ if not an image trigger ]
Image S/N Ratio: 8.49
Analysis Position: [ source = BAT ]
RA: 153.806002279747 Dec: 27.4756888348294 [deg; J2000]
Refined Position: [ source = BAT pre-slew burst ]
RA: 153.83095171451 Dec: 27.4721872524119 [deg; J2000]
{ 10h 15m 19.4s , +27d 28' 19.9" }
+/- 2.14356334333729 [arcmin] (estimated 90% radius based on SNR)
+/- 0.798548999640606 [arcmin] (formal 1-sigma fit error)
SNR: 10.2344967380459
Angular difference between the analysis and refined position is 1.344654 arcmin
Partial Coding Fraction: 0.640625 [ including projection effects ]
Duration
T90: 548.995999932289 +/- 107.373835482129
Measured from: 46.5080000162125
to: 595.503999948502 [s; relative to TRIGTIME]
T50: 106.419999957085 +/- 18.8295125644743
Measured from: 118.407999992371
to: 224.827999949455 [s; relative to TRIGTIME]
Fluence
Peak Flux (peak 1 second)
Measured from: 115.227999985218
to: 116.227999985218 [s; relative to TRIGTIME]
Total Fluence
Measured from: 35.444000005722
to: 618.579999983311 [s; relative to TRIGTIME]
Band 1 Band 2 Band 3 Band 4
15-25 25-50 50-100 100-350 keV
Total 2.808913 2.627221 1.626453 0.595114
0.130893 0.136005 0.122629 0.112626 [error]
Peak 0.031467 0.031904 0.038284 0.008484
0.006906 0.007401 0.006592 0.005733 [error]
[ fluence units of on-axis counts / fully illuminated detector ]
======================================================================
====== Table of the duration information =============================
Value tstart tstop
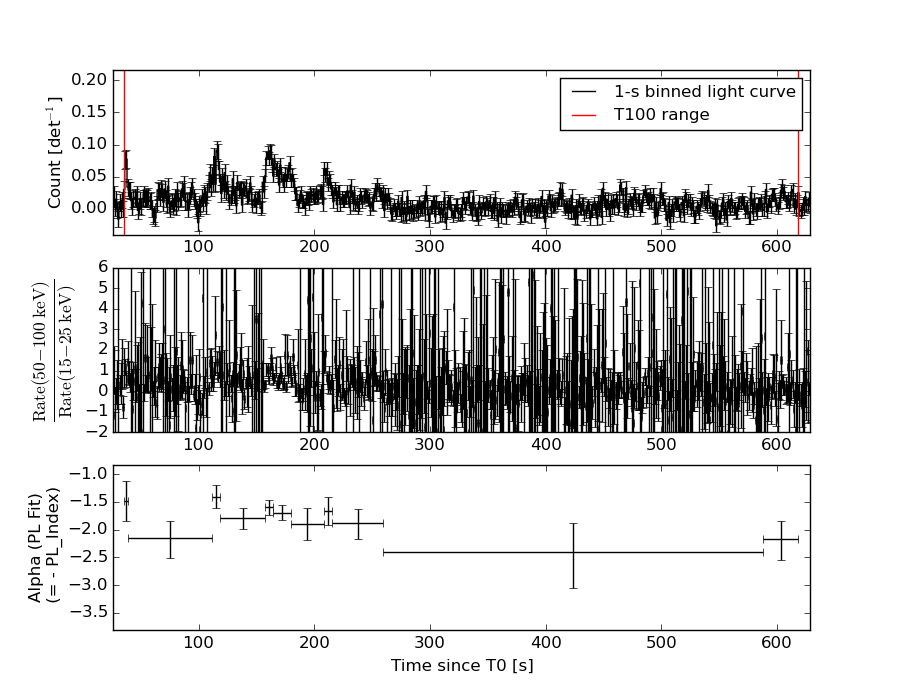
T100 583.136 35.444 618.580
T90 548.996 46.508 595.504
T50 106.420 118.408 224.828
Peak 1.000 115.228 116.228
====== Spectral Analysis Summary =====================================
Model : spectral model: simple power-law (PL) and cutoff power-law (CPL)
Ph_index : photon index: E^{Ph_index}
Ph_90err : 90% error of the photon index
Epeak : Epeak in keV
Epeak_90err: 90% error of Epeak
Norm : normalization at 50 keV in both the PL model and CPL model
Nomr_90err : 90% error of the normalization
chi2 : Chi-Squared
dof : degree of freedo
=== Time-averaged spectral analysis ===
(Best model with acceptable fit: PL)
Model Ph_index Ph_90err_low Ph_90err_hi Epeak Epeak_90err_low Epeak_90err_hi Norm Nomr_90err_low Norm_90err_hi chi2 dof
PL -1.909 -0.121 0.118 - - - 7.28e-04 -5.13e-05 5.05e-05 43.500 57
CPL -1.915 -0.230 0.219 9999.360 N/A N/A 7.25e-04 N/A N/A 43.510 56
=== 1-s peak spectral analysis ===
(Best model with acceptable fit: PL)
Model Ph_index Ph_90err_low Ph_90err_hi Epeak Epeak_90err_low Epeak_90err_hi Norm Nomr_90err_low Norm_90err_hi chi2 dof
PL -1.497 -0.346 0.332 - - - 7.21e-03 -1.46e-03 1.44e-03 47.880 57
CPL -1.028 -1.375 1.654 109.903 -109.903 -109.903 1.22e-02 N/A N/A 47.490 56
=== Fluence/Peak Flux Summary ===
Model Band1 Band2 Band3 Band4 Band5 Total
15-25 25-50 50-100 100-350 15-150 15-350 keV
Fluence PL 7.97e-07 1.14e-06 1.22e-06 2.40e-06 3.90e-06 5.56e-06 erg/cm2
90%_error_low -7.41e-08 -6.62e-08 -1.20e-07 -4.61e-07 -2.68e-07 -5.79e-07 erg/cm2
90%_error_hi 7.60e-08 6.62e-08 1.21e-07 5.33e-07 2.71e-07 6.35e-07 erg/cm2
Peak flux PL 2.96e-01 2.98e-01 2.11e-01 2.38e-01 8.99e-01 1.04e+00 ph/cm2/s
90%_error_low -9.20e-02 -6.14e-02 -5.40e-02 -1.04e-01 -1.76e-01 -2.06e-01 ph/cm2/s
90%_error_hi 1.01e-01 6.05e-02 5.28e-02 1.41e-01 1.76e-01 2.08e-01 ph/cm2/s
Fluence CPL 8.01e-07 1.12e-06 1.20e-06 2.88e-06 3.91e-06 5.89e-06 erg/cm2
90%_error_low -1.10e-07 -1.50e-07 -7.02e-07 -1.29e-06 -4.05e-07 -1.20e-06 erg/cm2
90%_error_hi 2.03e-07 9.64e-08 6.23e-08 -2.00e-07 1.83e-07 3.37e-07 erg/cm2
Peak flux CPL 2.68e-01 3.10e-01 2.23e-01 1.51e-01 8.83e-01 9.52e-01 ph/cm2/s
90%_error_low N/A -6.86e-02 -6.07e-02 -1.51e-01 -1.83e-01 -2.28e-01 ph/cm2/s
90%_error_hi N/A 7.24e-02 6.53e-02 1.06e-01 1.81e-01 2.75e-01 ph/cm2/s
======================================================================
Image
Pre-slew 15.0-350.0 keV image (Event data)
#   RAcent    DECcent   POSerr    Theta     Phi              Peak Cts       SNR   Name
  153.8310    27.4722   0.0188    32.1492    15.4431         1.3166812     10.234 TRIG_00505646

Foreground time interval of the image:
 35.444 112.301 (delta_t =  76.857 [sec])
Background time interval of the image:
-656.599 -640.504 (delta_t =  16.095 [sec])
-239.000  35.444 (delta_t = 274.444 [sec])
Light Curves
Note: The mask-weighted lightcurves have units of either count/det or counts/sec/det, where a det is 0.4 x 0.4 = 0.16 sq cm.
Full-time range; 1 s binning
Other quick-look light curves:
- 64 ms binning (zoomed)
- 16 ms binning (zoomed)
- 8 ms binning (zoomed)
- 2 ms binning (zoomed)
- SN=5 or 10 s binning (full-time range)
- Raw light curve
Spectra
- 64 ms binning (zoomed)
- 16 ms binning (zoomed)
- 8 ms binning (zoomed)
- 2 ms binning (zoomed)
- SN=5 or 10 s binning (full-time range)
- Raw light curve
Spectra
Notes:
- 1) The fitting includes the systematic errors.
- 2) When the burst includes telescope slew time periods, the fitting uses an average response file made from multiple 5-s response files through out the slew time plus single time preiod for the non-slew times, and weighted by the total counts in the corresponding time period using addrmf. An average response file is needed becuase a spectral fit using the pre-slew DRM will introduce some errors in both a spectral shape and a normalization if the PHA file contains a lot of the slew/post-slew time interval.
- 3) For fits to more complicated models (e.g. a power-law over a cutoff power-law), the BAT team has decided to require a chi-square improvement of more than 6 for each extra dof.
Time averaged spectrum fit using the average DRM
Power-law model
Time interval is from   35.444 sec. to  618.580 sec.

Spectral model in power-law:
------------------------------------------------------------
Parameters  : value       lower 90%   higher 90%
Photon index: -1.9094     ( -0.121234   0.118481 )
Norm@50keV  : 7.27698E-04    ( -5.12663e-05   5.05068e-05 )
------------------------------------------------------------
#Fit statistic : Chi-Squared =          43.50 using 59 PHA bins.
# Reduced chi-squared =         0.7632 for     57 degrees of freedom
# Null hypothesis probability =   9.060429e-01

Photon flux (15-150 keV)    in 583.1 sec: 0.104858 ( -0.0062114  0.006222 ) ph/cm2/s
Energy fluence (15-150 keV)             : 3.90214e-06 ( -2.67654e-07  2.71e-07 ) ergs/cm2
Cutoff power-law model
Time interval is from   35.444 sec. to  618.580 sec.
Spectral model in the cutoff power-law:
------------------------------------------------------------
Parameters  : value       lower 90%   higher 90%
Photon index: -2.08636     ( -0.0587717   0.390663 )
Epeak [keV] : 37.8974      (   )
Norm@50keV  : 5.88234E-04    (     )
------------------------------------------------------------
#Fit statistic : Chi-Squared =          42.79 using 59 PHA bins.
# Reduced chi-squared =         0.7641 for     56 degrees of freedom
# Null hypothesis probability =   9.028596e-01

Photon flux (15-150 keV)    in 583.1 sec: 0.101588 ( -0.0103022  0.007981 ) ph/cm2/s
Energy fluence (15-150 keV)             : 3.90564e-06 ( -4.04557e-07  1.83223e-07 ) ergs/cm2
1-s peak spectrum fit
Power-law model
Time interval is from  115.228 sec. to  116.228 sec.

Spectral model in power-law:
------------------------------------------------------------
Parameters  : value       lower 90%   higher 90%
Photon index: -1.49703     ( -0.346407   0.332414 )
Norm@50keV  : 7.20667E-03    ( -0.00145783   0.00143573 )
------------------------------------------------------------
#Fit statistic : Chi-Squared =          47.88 using 59 PHA bins.
# Reduced chi-squared =         0.8400 for     57 degrees of freedom
# Null hypothesis probability =   7.998111e-01

Photon flux (15-150 keV)    in 1 sec: 0.898980 ( -0.175722  0.17607 ) ph/cm2/s
Energy fluence (15-150 keV)             : 6.84085e-08 ( -1.50234e-08  1.52481e-08 ) ergs/cm2
Cutoff power-law model
Time interval is from  115.228 sec. to  116.228 sec.
Spectral model in the cutoff power-law:
------------------------------------------------------------
Parameters  : value       lower 90%   higher 90%
Photon index: -1.02775     ( -1.37476   1.65476 )
Epeak [keV] : 109.903      ( -109.971 -109.971 )
Norm@50keV  : 1.21687E-02    (     )
------------------------------------------------------------
#Fit statistic : Chi-Squared =          47.49 using 59 PHA bins.
# Reduced chi-squared =         0.8481 for     56 degrees of freedom
# Null hypothesis probability =   7.836524e-01

Photon flux (15-150 keV)    in 1 sec: 0.882790 ( -0.183256  0.18145 ) ph/cm2/s
Energy fluence (15-150 keV)             : 6.69854e-08 ( -1.54139e-08  1.6191e-08 ) ergs/cm2
Time-resolved spectra
Distribution
T90 vs. Hardness ratio plot
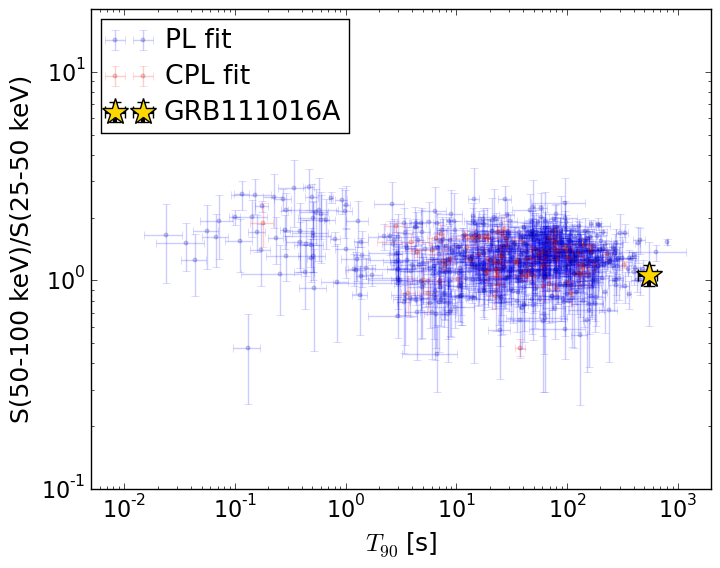
T90                                   = 548.996 sec.
Hardness ratio (energy fluence ratio) = 1.06483046469
S(15-50 keV) vs. S(50-150 keV) plot
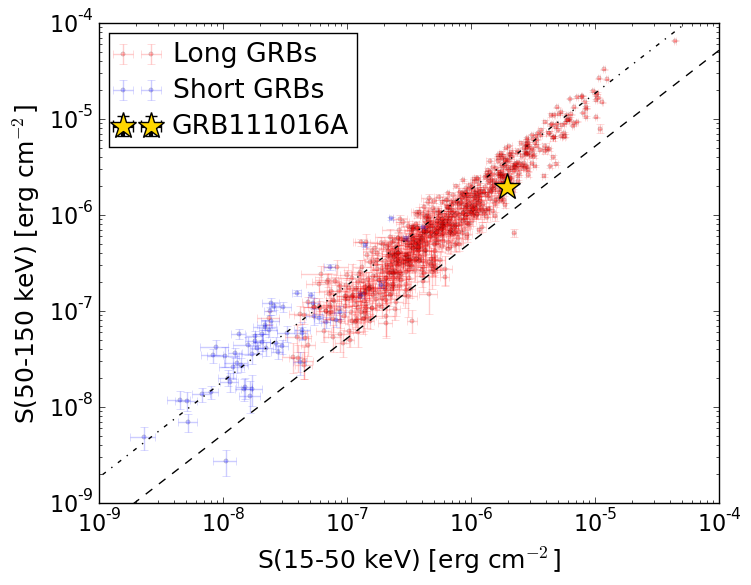
S(15-50 keV)  = 1.9387481e-06
S(50-150 keV) = 1.9633664e-06
The dash-dotted line and the dashed line traces the fluences calculated from the Band function with Epeak = 15 and 150 keV, respectively. Both lines assume a canonical values of alpha = -1 and beta = -2.5.
Mask shadow pattern
IMX = 6.058044271535602E-01, IMY = -1.673570671035416E-01
Spacecraft aspect plot
Bright source in the pre-burst/pre-slew/post-slew images
Pre-burst image of 15-350 keV band
Time interval of the image:
-656.599400 -640.504200
-239.000000 35.444000

# RAcent  DECcent POSerr Theta    Phi  PeakCts   SNR AngSep     Name
#  [deg]    [deg]    ['] [deg]  [deg]                   [']
254.3198  35.4735    0.0  50.5 -175.8   1.2264   2.3   10.4	Her X-1
243.8467  36.6259    2.6  42.1 -173.3   1.5046   4.4 ------	UNKNOWN
Pre-slew background subtracted image of 15-350 keV band
Time interval of the image:
35.444000 112.300610

# RAcent  DECcent POSerr Theta    Phi  PeakCts   SNR AngSep     Name
#  [deg]    [deg]    ['] [deg]  [deg]                   [']
254.5223  35.4268    9.0  50.7 -175.9   0.2977   1.3    6.0	Her X-1
153.8310  27.4723    1.1  32.1   15.4   1.3111  10.2 ------	UNKNOWN
Post-slew image of 15-350 keV band
Time interval of the image:
167.500600 874.300610

# RAcent  DECcent POSerr Theta    Phi  PeakCts   SNR AngSep     Name
#  [deg]    [deg]    ['] [deg]  [deg]                   [']
132.8399  41.8165    2.7  22.4  104.1   2.0435   4.3 ------	UNKNOWN
130.4109  -7.4335    4.2  41.6    5.1   1.8066   2.7 ------	UNKNOWN
153.8405  27.4768    1.1   0.0 -177.0   4.3894  10.7 ------	UNKNOWN
148.2741  -9.1793    2.6  37.0  -22.2   2.4780   4.4 ------	UNKNOWN
227.6000  50.6073    4.0  59.1 -166.1   8.7126   2.9 ------	UNKNOWN
224.1566  42.7970    5.9  57.8 -156.6   5.7469   1.9 ------	UNKNOWN
167.3835 -19.4329    3.0  48.7  -48.4   7.8741   3.9 ------	UNKNOWN
176.1892 -10.5019    4.5  43.7  -64.1   5.8239   2.6 ------	UNKNOWN