Analysis Summary
Notes:
- 1) No attempt has been made to eliminate the non-significant decimal places.
- 2) This batgrbproduct analysis is done using the HEASARC data.
- 3) This batgrbproduct analysis is using the flight position for the mask-weighting calculation.
======================================================================
                  BAT GRB EVENT DATA PROCESSING REPORT
    Process Script Ver: batgrbproduct v2.46
    Process Start Time: Mon Jan 13 19:45:57 EST 2014
             Host Name: batevent1
   Current Working Dir: /local/data/batevent/batevent_reproc/trigger505801
======================================================================

  Trigger: 00505801      Segment: 000

  BAT Trigger Time: 340651592   [s; MET]
      Trigger Stop: 340651656   [s; MET]
               UTC: 2011-10-18T17:26:24.519600    [includes UTCF correction]
       Where From?: TDRSS position message

  BAT
    RA: 271.500387190674   Dec: -3.8713557158467  [deg; J2000]

     Catalogged Source?: NO
     Point Source?:      YES
     GRB Indicated?:     YES    [ by BAT flight software ]
     Image S/N Ratio:    7.53
     Image Trigger?:     YES
     Rate S/N Ratio:     0  [ if not an image trigger ]
     Image S/N Ratio:    7.53

  Analysis Position:   [ source = BAT ]
    RA: 271.500387190674   Dec: -3.8713557158467  [deg; J2000]

  Refined Position:   [ source = BAT pre-slew burst ]
    RA: 271.48164211143   Dec: -3.88016502820922  [deg; J2000]
        { 18h 05m 55.6s , -03d 52' 48.6" }
         +/- 2.04947526872181 [arcmin] (estimated 90% radius based on SNR)
         +/- 1.23652079207562 [arcmin] (formal 1-sigma fit error)
    SNR: 10.9122560663817

  Angular difference between the analysis and refined position is 1.240385 arcmin

  Partial Coding Fraction: 0.8046875    [ including projection effects ]

  Duration
     T90: 32.7079999446869 +/- 4.21558726083862
        Measured from: -0.583999991416931
                   to: 32.12399995327     [s; relative to TRIGTIME]
     T50: 22.6039999723434 +/- 14.0117672521361
        Measured from: 4.27999997138977
                   to: 26.8839999437332     [s; relative to TRIGTIME]


  Fluence
     Peak Flux  (peak 1 second)
        Measured from: 21.7120000123978
                   to: 22.7120000123978     [s; relative to TRIGTIME]
     Total Fluence
        Measured from: -4.0799999833107
                   to: 37.2960000038147     [s; relative to TRIGTIME]

             Band 1     Band 2     Band 3     Band 4
              15-25      25-50     50-100    100-350     keV
 Total     0.309638   0.359243   0.124190   0.018149
           0.040322   0.039111   0.033198   0.028692 [error]
 Peak      0.014297   0.028647   0.008236   0.005284
           0.006361   0.006236   0.005113   0.004424 [error]

     [ fluence units of on-axis counts / fully illuminated detector ]

======================================================================


====== Table of the duration information =============================

        Value   tstart    tstop
T100   41.376   -4.080   37.296
T90    32.708   -0.584   32.124
T50    22.604    4.280   26.884
Peak    1.000   21.712   22.712


====== Spectral Analysis Summary =====================================

Model      : spectral model: simple power-law (PL) and cutoff power-law (CPL)
Ph_index   : photon index: E^{Ph_index}
Ph_90err   : 90% error of the photon index
Epeak      : Epeak in keV
Epeak_90err: 90% error of Epeak
Norm       : normalization at 50 keV in both the PL model and CPL model
Nomr_90err : 90% error of the normalization
chi2       : Chi-Squared
dof        : degree of freedo

=== Time-averaged spectral analysis ===
(Best model with acceptable fit: PL)

Model Ph_index Ph_90err_low Ph_90err_hi  Epeak  Epeak_90err_low  Epeak_90err_hi  Norm       Nomr_90err_low    Norm_90err_hi    chi2    dof
PL      -2.175    -0.283      0.259       -           -               -         1.03e-03     -2.04e-04          1.99e-04      52.390   57
CPL     -2.160    -0.059      2.570     9999.360      N/A           N/A         1.05e-03        N/A               N/A         52.410   56


=== 1-s peak spectral analysis ===
(Best model with acceptable fit: PL)

Model Ph_index Ph_90err_low Ph_90err_hi  Epeak  Epeak_90err_low  Epeak_90err_hi  Norm       Nomr_90err_low    Norm_90err_hi    chi2    dof
PL      -1.776     -0.596     0.556       -           -               -         3.29e-03     -1.24e-03          1.18e-03      51.020   57
CPL      0.020     -2.121    -0.020       41.443      N/A           N/A         4.33e-02        N/A               N/A         50.580   56


=== Fluence/Peak Flux Summary ===

              Model    Band1     Band2     Band3     Band4     Band5     Total
                       15-25     25-50    50-100    100-350    15-150    15-350    keV
Fluence         PL   1.03e-07  1.26e-07  1.12e-07  1.71e-07  4.01e-07  5.12e-07   erg/cm2
      90%_error_low -1.82e-08 -1.82e-08 -2.90e-08 -7.25e-08 -6.75e-08 -1.13e-07   erg/cm2
      90%_error_hi   1.86e-08  1.80e-08  3.06e-08  1.02e-07  7.00e-08  1.36e-07   erg/cm2
Peak flux       PL   1.77e-01  1.51e-01  8.83e-02  7.70e-02  4.50e-01  4.93e-01   ph/cm2/s
      90%_error_low -7.96e-02 -4.82e-02 -4.06e-02 -5.14e-02 -1.43e-01 -1.59e-01   ph/cm2/s
      90%_error_hi   8.57e-02  4.82e-02  4.18e-02  9.33e-02  1.43e-01  1.60e-01   ph/cm2/s

Fluence        CPL   9.96e-08  1.39e-07  9.85e-08  3.60e-08  3.63e-07  3.73e-07   erg/cm2
      90%_error_low -2.00e-08    N/A    -4.33e-08 -3.30e-08 -7.33e-08 -8.30e-08   erg/cm2
      90%_error_hi   1.98e-08    N/A     3.80e-08  2.33e-07  8.73e-08  2.55e-07   erg/cm2
Peak flux      CPL   1.55e-01  1.94e-01  6.25e-02  3.05e-03  4.15e-01  4.16e-01   ph/cm2/s
      90%_error_low     N/A       N/A   -5.39e-02 -3.05e-03 -1.49e-01 -1.50e-01   ph/cm2/s
      90%_error_hi      N/A       N/A    6.52e-02  8.80e-02  1.64e-01  2.38e-01   ph/cm2/s

======================================================================
Image
Pre-slew 15.0-350.0 keV image (Event data)
#   RAcent    DECcent   POSerr    Theta     Phi              Peak Cts       SNR   Name
  271.4816    -3.8802   0.0176    16.9258   -88.7082         0.8462499     10.912 TRIG_00505801

Foreground time interval of the image:
 -4.080  37.296 (delta_t =  41.376 [sec])
Background time interval of the image:
-239.000  -4.080 (delta_t = 234.920 [sec])
Light Curves
Note: The mask-weighted lightcurves have units of either count/det or counts/sec/det, where a det is 0.4 x 0.4 = 0.16 sq cm.
Full-time range; 1 s binning
Other quick-look light curves:
- 64 ms binning (zoomed)
- 16 ms binning (zoomed)
- 8 ms binning (zoomed)
- 2 ms binning (zoomed)
- SN=5 or 10 s binning (full-time range)
- Raw light curve
Spectra
- 64 ms binning (zoomed)
- 16 ms binning (zoomed)
- 8 ms binning (zoomed)
- 2 ms binning (zoomed)
- SN=5 or 10 s binning (full-time range)
- Raw light curve
Spectra
Notes:
- 1) The fitting includes the systematic errors.
- 2) When the burst includes telescope slew time periods, the fitting uses an average response file made from multiple 5-s response files through out the slew time plus single time preiod for the non-slew times, and weighted by the total counts in the corresponding time period using addrmf. An average response file is needed becuase a spectral fit using the pre-slew DRM will introduce some errors in both a spectral shape and a normalization if the PHA file contains a lot of the slew/post-slew time interval.
- 3) For fits to more complicated models (e.g. a power-law over a cutoff power-law), the BAT team has decided to require a chi-square improvement of more than 6 for each extra dof.
Time averaged spectrum fit using the average DRM
Power-law model
Time interval is from   -4.080 sec. to   37.296 sec.

Spectral model in power-law:
------------------------------------------------------------
Parameters  : value       lower 90%   higher 90%
Photon index: -2.17522     ( -0.282535   0.259311 )
Norm@50keV  : 1.03425E-03    ( -0.000203817   0.000199043 )
------------------------------------------------------------
#Fit statistic : Chi-Squared =          52.39 using 59 PHA bins.
# Reduced chi-squared =         0.9192 for     57 degrees of freedom
# Null hypothesis probability =   6.482985e-01

Photon flux (15-150 keV)    in 41.38 sec: 0.169040 ( -0.022946  0.022946 ) ph/cm2/s
Energy fluence (15-150 keV)             : 4.01117e-07 ( -6.749e-08  7.00021e-08 ) ergs/cm2
Cutoff power-law model
Time interval is from   -4.080 sec. to   37.296 sec.
Spectral model in the cutoff power-law:
------------------------------------------------------------
Parameters  : value       lower 90%   higher 90%
Photon index: -1.30435     ( -0.908425   1.71978 )
Epeak [keV] : 29.5445      (   )
Norm@50keV  : 3.59902E-03    (     )
------------------------------------------------------------
#Fit statistic : Chi-Squared =          51.01 using 59 PHA bins.
# Reduced chi-squared =         0.9108 for     56 degrees of freedom
# Null hypothesis probability =   6.639129e-01

Photon flux (15-150 keV)    in 41.38 sec: 0.164399 ( -0.02365  0.023813 ) ph/cm2/s
Energy fluence (15-150 keV)             : 3.63053e-07 ( -7.32786e-08  8.72659e-08 ) ergs/cm2
1-s peak spectrum fit
Power-law model
Time interval is from   21.712 sec. to   22.712 sec.

Spectral model in power-law:
------------------------------------------------------------
Parameters  : value       lower 90%   higher 90%
Photon index: -1.77599     ( -0.595708   0.556372 )
Norm@50keV  : 3.29215E-03    ( -0.00123592   0.00117847 )
------------------------------------------------------------
#Fit statistic : Chi-Squared =          51.02 using 59 PHA bins.
# Reduced chi-squared =         0.8952 for     57 degrees of freedom
# Null hypothesis probability =   6.975621e-01

Photon flux (15-150 keV)    in 1 sec: 0.449521 ( -0.143355  0.143448 ) ph/cm2/s
Energy fluence (15-150 keV)             : 3.03417e-08 ( -1.10957e-08  1.16893e-08 ) ergs/cm2
Cutoff power-law model
Time interval is from   21.712 sec. to   22.712 sec.
Spectral model in the cutoff power-law:
------------------------------------------------------------
Parameters  : value       lower 90%   higher 90%
Photon index: 0.0199901     ( -2.17383   -0.0729448 )
Epeak [keV] : 41.4431      (   )
Norm@50keV  : 4.33087E-02    (     )
------------------------------------------------------------
#Fit statistic : Chi-Squared =          50.58 using 59 PHA bins.
# Reduced chi-squared =         0.9031 for     56 degrees of freedom
# Null hypothesis probability =   6.795804e-01

Photon flux (15-150 keV)    in 1 sec: 0.414919 ( -0.148705  0.163679 ) ph/cm2/s
Energy fluence (15-150 keV)             : 2.2752e-08 ( -5.42035e-09  1.68703e-08 ) ergs/cm2
Time-resolved spectra
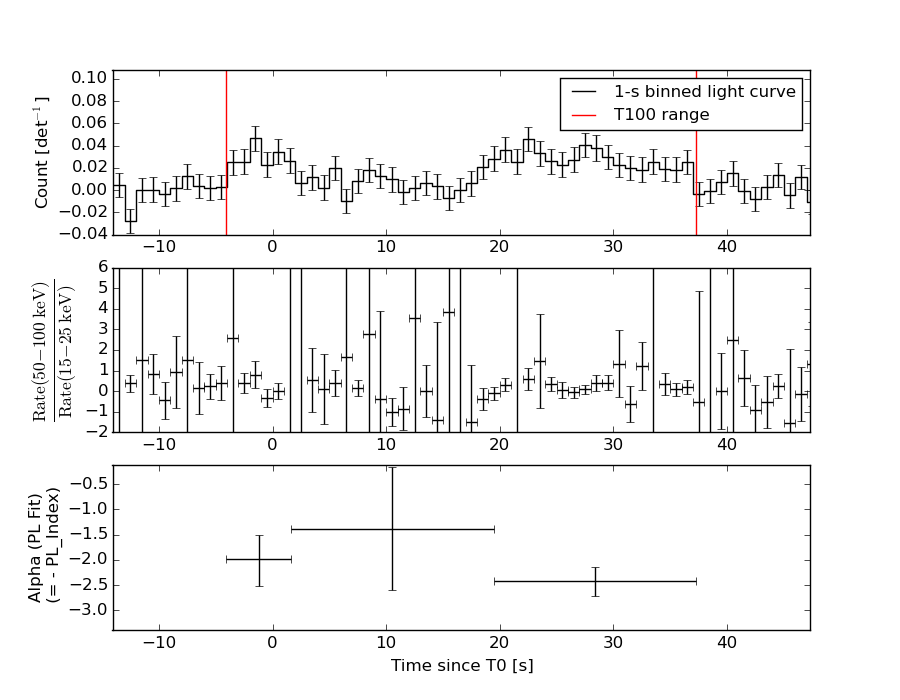
Distribution
T90 vs. Hardness ratio plot
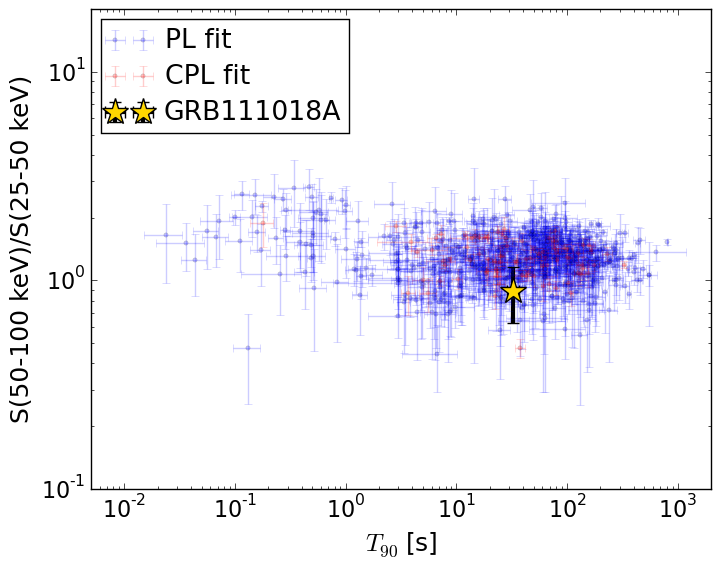
T90                                   = 32.708 sec.
Hardness ratio (energy fluence ratio) = 0.885665823458
S(15-50 keV) vs. S(50-150 keV) plot
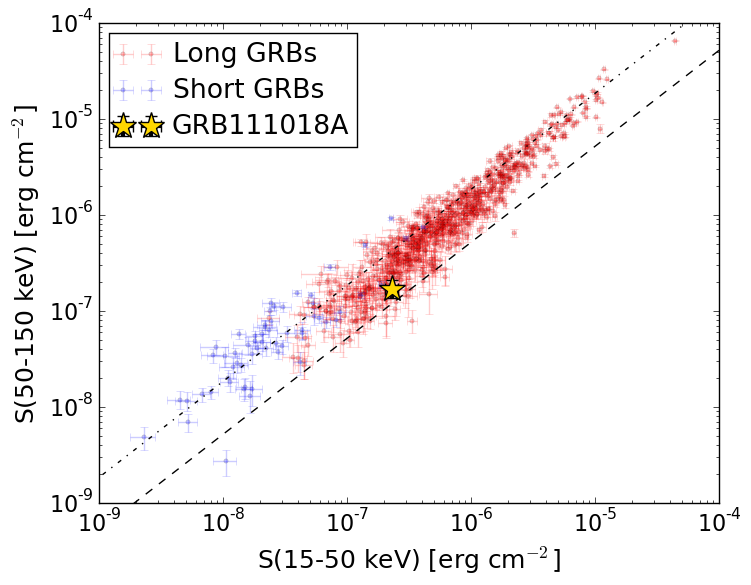
S(15-50 keV)  = 2.297952e-07
S(50-150 keV) = 1.7132129e-07
The dash-dotted line and the dashed line traces the fluences calculated from the Band function with Epeak = 15 and 150 keV, respectively. Both lines assume a canonical values of alpha = -1 and beta = -2.5.
Mask shadow pattern
IMX = 6.860509801925356E-03, IMY = 3.042375419936534E-01
Spacecraft aspect plot
Bright source in the pre-burst/pre-slew/post-slew images
Pre-burst image of 15-350 keV band
Time interval of the image:
-239.000000 -4.080000

# RAcent  DECcent POSerr Theta    Phi  PeakCts   SNR AngSep     Name
#  [deg]    [deg]    ['] [deg]  [deg]                   [']
254.3346  35.2951    6.0  46.6  -21.4  -0.6960  -1.9    6.7	Her X-1
263.0093 -24.7464   54.8  34.9 -121.5   0.0645   0.2    0.1	GX 1+4
264.9216 -44.4488   40.4  49.5 -141.7  -0.1769  -0.3    7.7	4U 1735-44
268.3301  -1.4961    2.5  19.6  -79.4   0.8917   4.5    3.5	SW J1753.5-0127
270.3235 -25.0615    2.3  30.8 -131.0   1.3081   5.0    2.4	GX 5-1
270.3759 -25.6679    4.6  31.2 -131.8   0.6725   2.5    6.0	GRS 1758-258
273.9900 -14.0913    2.7  20.1 -120.8   0.8322   4.2    3.4	GX 17+2
276.0343 -30.4108    2.8  33.0 -144.3   0.9201   4.1    6.2	H1820-303
285.1848 -24.8906   19.8  25.6 -157.6   0.1085   0.6    8.3	HT1900.1-2455
288.8099  10.8096    3.0  10.2   22.4   0.6920   3.9    8.2	GRS 1915+105
299.5315  35.2966    8.1  36.4   33.1   0.4650   1.4    6.4	Cyg X-1
308.1632  40.9544    9.1  44.3   38.9   0.9010   1.3    2.4	Cyg X-3
263.0073 -33.9646    4.7  41.7 -131.6   0.9174   2.4    7.8	GX 354-0
312.0793   6.7335    3.7  25.0   92.1   0.8417   3.1 ------	UNKNOWN
278.6157 -12.8763    2.6  16.3 -129.4   0.8092   4.5 ------	UNKNOWN
239.3411  37.3429    3.6  57.7  -27.9   4.0593   3.2 ------	UNKNOWN
241.5540  18.5338    2.6  48.8  -48.8   3.6841   4.4 ------	UNKNOWN
Pre-slew background subtracted image of 15-350 keV band
Time interval of the image:
-4.080000 37.296000

# RAcent  DECcent POSerr Theta    Phi  PeakCts   SNR AngSep     Name
#  [deg]    [deg]    ['] [deg]  [deg]                   [']
254.2807  35.4184    6.3  46.7  -21.3   0.2479   1.8    9.8	Her X-1
262.9313 -24.8848    5.0  35.1 -121.5   0.2625   2.3    9.4	GX 1+4
264.6704 -44.5337    6.3  49.6 -141.6   0.4277   1.8    5.9	4U 1735-44
268.3011  -1.3251    6.1  19.6  -78.9   0.1491   1.9    8.6	SW J1753.5-0127
270.3244 -25.1695    8.5  30.8 -131.1  -0.1267  -1.4    5.8	GX 5-1
270.4126 -25.5884    0.0  31.1 -131.7  -0.0803  -0.9   11.0	GRS 1758-258
274.1113 -13.8639    0.0  19.8 -120.5   0.2078   2.6   12.0	GX 17+2
276.1135 -30.4285    4.2  33.0 -144.4  -0.2410  -2.7   10.4	H1820-303
285.1836 -24.8872    4.9  25.6 -157.6   0.1678   2.3    8.3	HT1900.1-2455
288.6155  11.0264    6.5  10.4   21.2   0.1213   1.8   11.8	GRS 1915+105
299.5155  35.2688    6.6  36.3   33.1  -0.2248  -1.8    5.4	Cyg X-1
308.1525  41.0875   92.7  44.5   38.8  -0.0296  -0.1    8.3	Cyg X-3
263.0272 -33.8550   11.0  41.6 -131.5  -0.1545  -1.0    2.3	GX 354-0
271.4816  -3.8802    1.1  16.9  -88.7   0.8464  10.9 ------	UNKNOWN
Post-slew image of 15-350 keV band
Time interval of the image:
112.300590 963.111500

# RAcent  DECcent POSerr Theta    Phi  PeakCts   SNR AngSep     Name
#  [deg]    [deg]    ['] [deg]  [deg]                   [']
244.9834 -15.6438    0.3  28.6 -107.0  27.6955  36.8    0.3	Sco X-1
254.5859  35.2417    2.9  42.2  -11.6  -3.2659  -4.0    8.7	Her X-1
256.0273 -37.8102    1.5  36.8 -150.3   5.7052   7.7    2.8	4U 1700-377
256.3996 -36.5004    3.9  35.5 -149.7   2.1071   3.0    5.0	GX 349+2
263.0837 -24.8875    5.8  22.5 -150.6   1.1758   2.0    9.4	GX 1+4
264.8341 -44.4513    3.5  41.0 -163.6   2.7162   3.2    3.9	4U 1735-44
268.3822  -1.3993    2.5   4.0  -42.9   2.6938   4.6    3.3	SW J1753.5-0127
270.3019 -25.0988    2.3  21.3 -167.9   2.8954   5.0    1.5	GX 5-1
270.3378 -25.8203    6.0  22.0 -168.0   1.1473   1.9    5.0	GRS 1758-258
274.0207 -13.9792    1.9  10.4  175.6   3.2525   6.1    3.5	GX 17+2
275.9169 -30.3187    5.3  26.8 -179.3   1.3326   2.2    2.9	H1820-303
284.8974 -24.7995    4.7  24.6  158.8   1.5879   2.5   10.5	HT1900.1-2455
288.7582  10.8988    2.7  22.6   58.2   3.0904   4.3    3.7	GRS 1915+105
299.5350  35.1783   10.9  47.1   40.7   2.6092   1.1    3.1	Cyg X-1
263.1461 -33.8139    6.6  31.0 -157.3   1.1531   1.7    7.9	GX 354-0
310.4065   4.9589    3.3  39.8   86.6   9.1981   3.5 ------	UNKNOWN
283.4088  27.1421    2.5  33.1   28.7   3.6550   4.6 ------	UNKNOWN
287.8592   0.5762    2.1  16.9   84.2   3.4904   5.5 ------	UNKNOWN
266.3519  51.2301    3.1  55.3    5.2  11.6060   3.7 ------	UNKNOWN
276.5173   0.5089    2.7   6.6   58.0   2.0978   4.3 ------	UNKNOWN
262.4714  29.9758    3.4  34.9   -4.7   2.3555   3.4 ------	UNKNOWN