Analysis Summary
Notes:
- 1) No attempt has been made to eliminate the non-significant decimal places.
- 2) This batgrbproduct analysis is done using the HEASARC data.
- 3) This batgrbproduct analysis is using the flight position for the mask-weighting calculation.
======================================================================
BAT GRB EVENT DATA PROCESSING REPORT
Process Script Ver: batgrbproduct v2.46
Process Start Time: Mon Jan 13 19:38:30 EST 2014
Host Name: batevent1
Current Working Dir: /local/data/batevent/batevent_reproc/trigger505926
======================================================================
Trigger: 00505926 Segment: 000
BAT Trigger Time: 340785236.544 [s; MET]
Trigger Stop: 340785236.8 [s; MET]
UTC: 2011-10-20T06:33:49.058300 [includes UTCF correction]
Where From?: TDRSS position message
BAT
RA: 287.026652923869 Dec: -37.9849220218857 [deg; J2000]
Catalogged Source?: NO
Point Source?: YES
GRB Indicated?: YES [ by BAT flight software ]
Image S/N Ratio: 8.92
Image Trigger?: NO
Rate S/N Ratio: 18.7349939951952 [ if not an image trigger ]
Image S/N Ratio: 8.92
Analysis Position: [ source = BAT ]
RA: 287.026652923869 Dec: -37.9849220218857 [deg; J2000]
Refined Position: [ source = BAT pre-slew burst ]
RA: 287.026502922454 Dec: -38.0345928060899 [deg; J2000]
{ 19h 08m 06.4s , -38d 02' 04.5" }
+/- 2.04988437935127 [arcmin] (estimated 90% radius based on SNR)
+/- 1.02539436853358 [arcmin] (formal 1-sigma fit error)
SNR: 10.9091449996154
Angular difference between the analysis and refined position is 2.980255 arcmin
Partial Coding Fraction: 0.7421875 [ including projection effects ]
Duration
T90: 0.38400000333786 +/- 0.0932952353877014
Measured from: -0.00800001621246338
to: 0.375999987125397 [s; relative to TRIGTIME]
T50: 0.17600005865097 +/- 0.0452548414137844
Measured from: 0.0719999670982361
to: 0.248000025749207 [s; relative to TRIGTIME]
Fluence
Peak Flux (peak 1 second)
Measured from: -0.316000044345856
to: 0.683999955654144 [s; relative to TRIGTIME]
Total Fluence
Measured from: -0.0400000214576721
to: 0.391999959945679 [s; relative to TRIGTIME]
Band 1 Band 2 Band 3 Band 4
15-25 25-50 50-100 100-350 keV
Total 0.028389 0.037558 0.027089 0.009823
0.005182 0.005215 0.004547 0.003492 [error]
Peak 0.032269 0.034922 0.032326 0.007801
0.007534 0.007194 0.006372 0.005159 [error]
[ fluence units of on-axis counts / fully illuminated detector ]
======================================================================
====== Table of the duration information =============================
Value tstart tstop
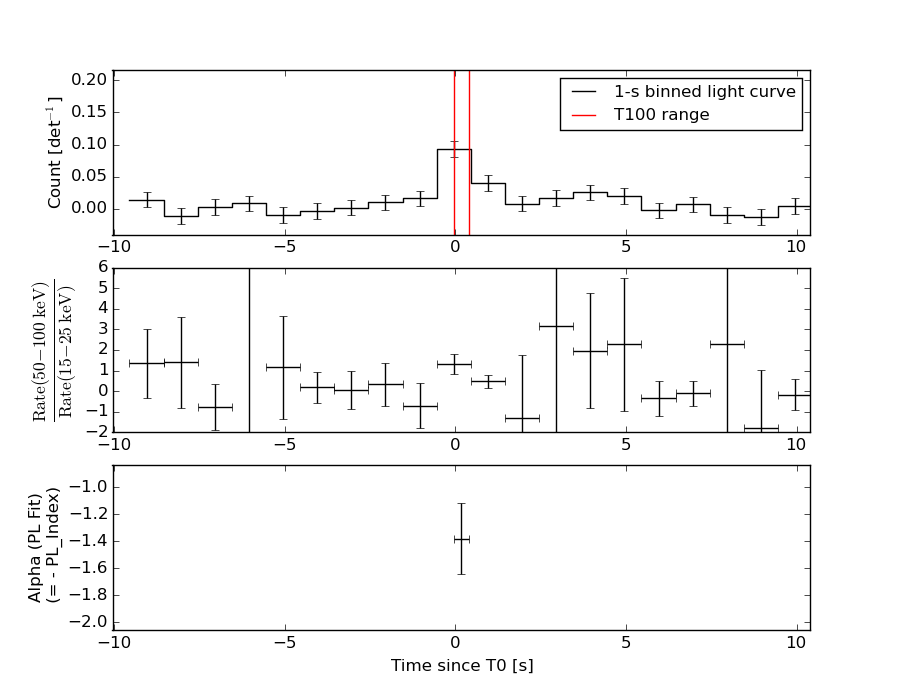
T100 0.432 -0.040 0.392
T90 0.384 -0.008 0.376
T50 0.176 0.072 0.248
Peak 1.000 -0.316 0.684
====== Spectral Analysis Summary =====================================
Model : spectral model: simple power-law (PL) and cutoff power-law (CPL)
Ph_index : photon index: E^{Ph_index}
Ph_90err : 90% error of the photon index
Epeak : Epeak in keV
Epeak_90err: 90% error of Epeak
Norm : normalization at 50 keV in both the PL model and CPL model
Nomr_90err : 90% error of the normalization
chi2 : Chi-Squared
dof : degree of freedo
=== Time-averaged spectral analysis ===
(Best model with acceptable fit: PL)
Model Ph_index Ph_90err_low Ph_90err_hi Epeak Epeak_90err_low Epeak_90err_hi Norm Nomr_90err_low Norm_90err_hi chi2 dof
PL -1.382 -0.263 0.265 - - - 1.50e-02 -2.23e-03 2.22e-03 52.100 57
CPL -1.387 -0.257 0.742 9999.360 -9999.360 -9999.360 1.51e-02 -7.47e-03 1.88e-02 52.110 56
=== 1-s peak spectral analysis ===
(Best model with acceptable fit: PL)
Model Ph_index Ph_90err_low Ph_90err_hi Epeak Epeak_90err_low Epeak_90err_hi Norm Nomr_90err_low Norm_90err_hi chi2 dof
PL -1.416 -0.362 0.361 - - - 7.09e-03 -1.39e-03 1.37e-03 66.070 57
CPL -1.420 N/A N/A 9999.290 N/A N/A 7.09e-03 N/A N/A 66.080 56
=== Fluence/Peak Flux Summary ===
Model Band1 Band2 Band3 Band4 Band5 Total
15-25 25-50 50-100 100-350 15-150 15-350 keV
Fluence PL 7.43e-09 1.47e-08 2.25e-08 7.55e-08 6.30e-08 1.20e-07 erg/cm2
90%_error_low -1.92e-09 -2.38e-09 -4.24e-09 -2.70e-08 -1.03e-08 -3.06e-08 erg/cm2
90%_error_hi 2.05e-09 2.33e-09 4.17e-09 3.59e-08 1.04e-08 3.79e-08 erg/cm2
Peak flux PL 2.69e-01 2.85e-01 2.13e-01 2.59e-01 8.66e-01 1.03e+00 ph/cm2/s
90%_error_low -9.07e-02 -6.12e-02 -5.31e-02 -1.14e-01 -1.69e-01 -2.01e-01 ph/cm2/s
90%_error_hi 1.00e-01 5.95e-02 5.18e-02 1.61e-01 1.70e-01 2.05e-01 ph/cm2/s
Fluence CPL 7.51e-09 1.46e-08 2.23e-08 7.59e-08 6.36e-08 1.21e-07 erg/cm2
90%_error_low N/A -2.43e-09 N/A N/A -1.42e-08 -5.31e-08 erg/cm2
90%_error_hi N/A 2.79e-09 N/A N/A 9.72e-09 1.57e-08 erg/cm2
Peak flux CPL 2.75e-01 2.85e-01 2.12e-01 2.76e-01 8.71e-01 1.03e+00 ph/cm2/s
90%_error_low -1.07e-01 -6.07e-02 -5.19e-02 N/A -1.84e-01 -2.74e-01 ph/cm2/s
90%_error_hi 9.48e-02 6.37e-02 5.61e-02 N/A 1.73e-01 1.98e-01 ph/cm2/s
======================================================================
Image
Pre-slew 15.0-350.0 keV image (Event data)
#   RAcent    DECcent   POSerr    Theta     Phi              Peak Cts       SNR   Name
  287.0265   -38.0346   0.0176    18.4199    68.6073         0.1063044     10.909 TRIG_00505926

Foreground time interval of the image:
 -0.040   0.392 (delta_t =   0.432 [sec])
Background time interval of the image:
-28.443  -0.040 (delta_t =  28.403 [sec])
Light Curves
Note: The mask-weighted lightcurves have units of either count/det or counts/sec/det, where a det is 0.4 x 0.4 = 0.16 sq cm.
Full-time range; 1 s binning
Other quick-look light curves:
- 64 ms binning (zoomed)
- 16 ms binning (zoomed)
- 8 ms binning (zoomed)
- 2 ms binning (zoomed)
- SN=5 or 10 s binning (full-time range)
- Raw light curve
Spectra
- 64 ms binning (zoomed)
- 16 ms binning (zoomed)
- 8 ms binning (zoomed)
- 2 ms binning (zoomed)
- SN=5 or 10 s binning (full-time range)
- Raw light curve
Spectra
Notes:
- 1) The fitting includes the systematic errors.
- 2) When the burst includes telescope slew time periods, the fitting uses an average response file made from multiple 5-s response files through out the slew time plus single time preiod for the non-slew times, and weighted by the total counts in the corresponding time period using addrmf. An average response file is needed becuase a spectral fit using the pre-slew DRM will introduce some errors in both a spectral shape and a normalization if the PHA file contains a lot of the slew/post-slew time interval.
- 3) For fits to more complicated models (e.g. a power-law over a cutoff power-law), the BAT team has decided to require a chi-square improvement of more than 6 for each extra dof.
Time averaged spectrum fit using the average DRM
Power-law model

Time interval is from   -0.040 sec. to    0.392 sec.

Spectral model in power-law:
------------------------------------------------------------
Parameters  : value       lower 90%   higher 90%
Photon index: -1.38215     ( -0.263305   0.264783 )
Norm@50keV  : 1.50394E-02    ( -0.00222714   0.00222054 )
------------------------------------------------------------
#Fit statistic : Chi-Squared =          52.10 using 59 PHA bins.
# Reduced chi-squared =         0.9141 for     57 degrees of freedom
# Null hypothesis probability =   6.589261e-01

Photon flux (15-150 keV)    in 0.432 sec: 1.82427 ( -0.2761  0.27687 ) ph/cm2/s
Energy fluence (15-150 keV)             : 6.30193e-08 ( -1.02922e-08  1.03938e-08 ) ergs/cm2
Cutoff power-law model
Time interval is from   -0.040 sec. to    0.392 sec.
Spectral model in the cutoff power-law:
------------------------------------------------------------
Parameters  : value       lower 90%   higher 90%
Photon index: -1.38672     ( -0.258689   0.73964 )
Epeak [keV] : 9999.36      ( -9999.36 -9999.36 )
Norm@50keV  : 1.50521E-02    ( -0.00750681   0.018763 )
------------------------------------------------------------
#Fit statistic : Chi-Squared =          52.11 using 59 PHA bins.
# Reduced chi-squared =         0.9306 for     56 degrees of freedom
# Null hypothesis probability =   6.228158e-01

Photon flux (15-150 keV)    in 0.432 sec: 1.83520 ( -0.35474  0.33364 ) ph/cm2/s
Energy fluence (15-150 keV)             : 6.36098e-08 ( -1.41874e-08  9.7222e-09 ) ergs/cm2
1-s peak spectrum fit
Power-law model

Time interval is from   -0.316 sec. to    0.684 sec.

Spectral model in power-law:
------------------------------------------------------------
Parameters  : value       lower 90%   higher 90%
Photon index: -1.4163     ( -0.36219   0.361069 )
Norm@50keV  : 7.08742E-03    ( -0.00138676   0.00137382 )
------------------------------------------------------------
#Fit statistic : Chi-Squared =          66.07 using 59 PHA bins.
# Reduced chi-squared =          1.159 for     57 degrees of freedom
# Null hypothesis probability =   1.921262e-01

Photon flux (15-150 keV)    in 1 sec: 0.866378 ( -0.16946  0.170122 ) ph/cm2/s
Energy fluence (15-150 keV)             : 6.82669e-08 ( -1.47982e-08  1.5082e-08 ) ergs/cm2
Cutoff power-law model
Time interval is from   -0.316 sec. to    0.684 sec.
Spectral model in the cutoff power-law:
------------------------------------------------------------
Parameters  : value       lower 90%   higher 90%
Photon index: -1.42041     (       )
Epeak [keV] : 9999.29      (   )
Norm@50keV  : 7.09116E-03    (     )
------------------------------------------------------------
#Fit statistic : Chi-Squared =          66.08 using 59 PHA bins.
# Reduced chi-squared =          1.180 for     56 degrees of freedom
# Null hypothesis probability =   1.678976e-01

Photon flux (15-150 keV)    in 1 sec: 0.870838 ( -0.1843  0.173362 ) ph/cm2/s
Energy fluence (15-150 keV)             : 6.86167e-08 ( -1.62265e-08  1.52752e-08 ) ergs/cm2
Time-resolved spectra
Distribution
T90 vs. Hardness ratio plot
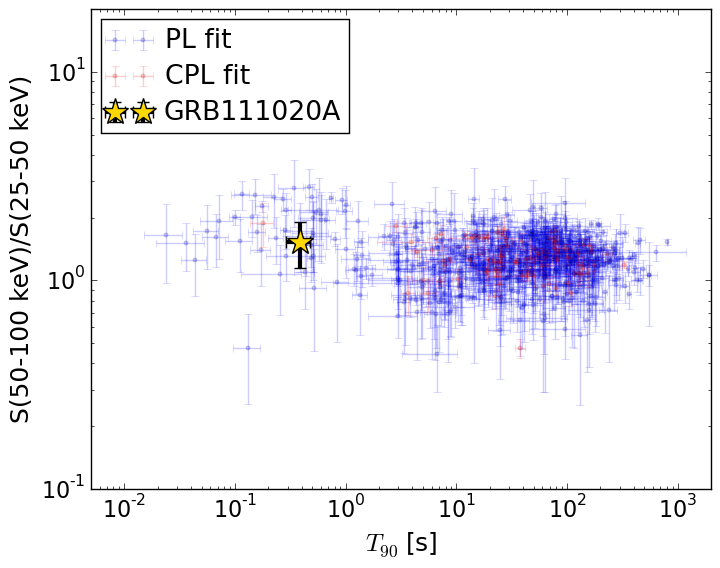
T90                                   = 0.384 sec.
Hardness ratio (energy fluence ratio) = 1.5346522642
S(15-50 keV) vs. S(50-150 keV) plot
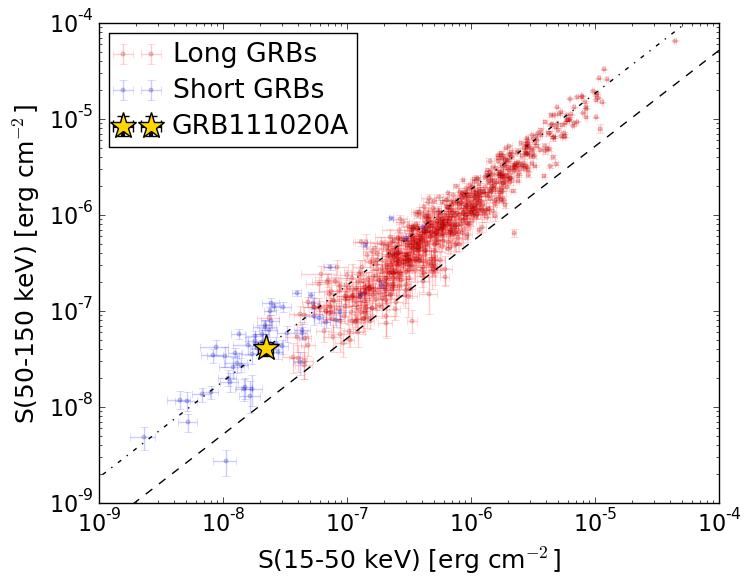
S(15-50 keV)  = 2.2101546e-08
S(50-150 keV) = 4.091827e-08
The dash-dotted line and the dashed line traces the fluences calculated from the Band function with Epeak = 15 and 150 keV, respectively. Both lines assume a canonical values of alpha = -1 and beta = -2.5.
Mask shadow pattern
IMX = 1.214797225773311E-01, IMY = -3.100959680103157E-01
Spacecraft aspect plot
Bright source in the pre-burst/pre-slew/post-slew images
Pre-burst image of 15-350 keV band
Time interval of the image:
-28.443410 -0.040000

# RAcent  DECcent POSerr Theta    Phi  PeakCts   SNR AngSep     Name
#  [deg]    [deg]    ['] [deg]  [deg]                   [']
170.4632 -60.7141    5.1  53.7 -150.9   0.5032   2.3    7.0	Cen X-3
186.6168 -62.7648    1.8  45.9 -149.6   0.8096   6.2    1.1	GX 301-2
244.9676 -15.6658    1.2  33.2  -43.2   0.7845   9.9    1.7	Sco X-1
255.9384 -37.8365    2.6   9.2  -52.4   0.2384   4.5    2.3	4U 1700-377
256.6589 -36.3108    0.0  10.1  -44.3   0.1207   2.3   12.7	GX 349+2
262.9394 -24.7449    5.5  20.0  -11.1  -0.1207  -2.1    3.8	GX 1+4
264.8628 -44.6127    3.9   0.6   71.5   0.1682   2.9   11.0	4U 1735-44
268.2596  -1.4409    5.5  43.4   -2.0   0.2128   2.1    6.5	SW J1753.5-0127
270.2815 -25.1161    3.8  20.2    8.4   0.1771   3.1    2.2	GX 5-1
270.4337 -25.6188    3.5  19.8    9.1   0.2093   3.7   10.3	GRS 1758-258
274.1255 -13.8960    6.8  32.0   10.6   0.1182   1.7   10.9	GX 17+2
275.8708 -30.3318    4.3  17.1   28.8   0.1585   2.7    3.5	H1820-303
285.1306 -25.0484    4.3  26.0   39.8   0.1895   2.7    9.2	HT1900.1-2455
262.9807 -33.9852    5.7  10.8  -12.9  -0.1199  -2.0    9.0	GX 354-0
312.4905 -32.4160    2.2  39.2   80.7   1.2463   5.2 ------	UNKNOWN
324.1864 -57.3348    2.2  38.4  123.0   0.8038   5.4 ------	UNKNOWN
292.8369 -38.1637    2.0  22.4   75.0   0.4153   5.8 ------	UNKNOWN
264.0920 -20.6490    2.1  24.1   -8.0   0.3307   5.6 ------	UNKNOWN
242.3792 -39.1925    2.4  17.0  -86.7   0.3069   4.8 ------	UNKNOWN
Pre-slew background subtracted image of 15-350 keV band
Time interval of the image:
-0.040000 0.392000

# RAcent  DECcent POSerr Theta    Phi  PeakCts   SNR AngSep     Name
#  [deg]    [deg]    ['] [deg]  [deg]                   [']
170.0587 -60.7384    5.7  53.9 -151.0  -0.0644  -2.0   10.2	Cen X-3
186.4401 -62.9406  394.6  45.9 -149.9  -0.0005  -0.0   11.8	GX 301-2
245.0745 -15.5332    9.2  33.3  -42.9   0.0137   1.3    8.4	Sco X-1
255.8045 -37.8039    4.4   9.3  -52.8   0.0209   2.6    9.0	4U 1700-377
256.2986 -36.2457    0.0  10.3  -45.5   0.0116   1.4   12.5	GX 349+2
263.1363 -24.9131    0.0  19.8  -10.6  -0.0314  -4.0   12.2	GX 1+4
264.8047 -44.4039    7.0   0.6   51.8   0.0125   1.6    3.8	4U 1735-44
268.4608  -1.5929   10.0  43.3   -1.7   0.0155   1.2   10.1	SW J1753.5-0127
270.3081 -24.9398    8.1  20.4    8.3   0.0119   1.4    8.5	GX 5-1
270.4510 -25.8630   13.0  19.6    9.3   0.0071   0.9   10.8	GRS 1758-258
274.1196 -13.9277    4.5  32.0   10.6  -0.0272  -2.5    9.3	GX 17+2
275.9558 -30.2194    6.8  17.3   28.8   0.0139   1.7    9.0	H1820-303
285.1816 -24.8409   11.4  26.2   39.6  -0.0101  -1.0    9.3	HT1900.1-2455
262.9658 -33.9833    7.4  10.8  -12.9   0.0121   1.6    9.0	GX 354-0
287.0265 -38.0345    1.1  18.4   68.6   0.1063  10.9 ------	UNKNOWN
280.7747   8.4765    2.3  55.3   12.1   0.2434   5.0 ------	UNKNOWN
259.7095 -57.6366    2.2  13.2 -177.9   0.0397   5.3 ------	UNKNOWN
255.8581 -54.3251    2.3  11.0 -162.2   0.0418   5.1 ------	UNKNOWN
Post-slew image of 15-350 keV band
Time interval of the image:
56.956590 962.509200

# RAcent  DECcent POSerr Theta    Phi  PeakCts   SNR AngSep     Name
#  [deg]    [deg]    ['] [deg]  [deg]                   [']
244.9805 -15.6280    1.6  43.1  -66.8  19.7329   7.2    0.7	Sco X-1
255.9786 -37.7018    6.1  24.4  -95.3   1.3176   1.9    8.6	4U 1700-377
256.4338 -36.4189    1.8  24.3  -92.1   4.2672   6.4    0.3	GX 349+2
263.1801 -24.7169    8.0  24.2  -60.0   0.9224   1.5    9.5	GX 1+4
264.8478 -44.4743    2.6  17.8 -114.7   2.3634   4.4    4.7	4U 1735-44
268.3392  -1.3826    6.2  40.4  -25.9   1.4099   1.9    4.5	SW J1753.5-0127
270.2880 -25.0944    1.8  19.2  -48.9   3.2052   6.6    0.9	GX 5-1
270.2545 -25.8477    4.5  18.6  -50.6   1.2703   2.6    6.8	GRS 1758-258
274.0334 -13.9871    1.9  26.6  -25.4   3.2555   6.0    3.4	GX 17+2
275.8666 -30.3990    2.7  11.9  -50.1   2.0754   4.2    3.6	H1820-303
284.9828 -24.9839   16.7  13.1   -4.4   0.3841   0.7    4.8	HT1900.1-2455
288.7703  10.9522    4.6  49.0    6.0   3.2450   2.5    1.7	GRS 1915+105
262.9605 -33.8559    1.9  19.8  -81.6   3.2220   6.0    1.9	GX 354-0
331.1911 -24.2418    3.3  39.8   86.6  10.0398   3.5 ------	UNKNOWN
303.1417  11.8093    3.1  52.0   23.9  11.8673   3.7 ------	UNKNOWN
287.9898  18.7815    2.9  56.8    4.8  15.1104   4.0 ------	UNKNOWN
287.8728   0.5837    1.7  38.6    5.1   5.0586   6.8 ------	UNKNOWN
282.1209  -3.2450    2.6  35.0   -4.8   3.0651   4.5 ------	UNKNOWN
277.4181 -23.7721    2.7  16.4  -29.0   2.1243   4.3 ------	UNKNOWN
159.9141 -79.0165    2.6  59.1 -166.1  15.4787   4.4 ------	UNKNOWN
257.4512   9.0606    2.9  54.5  -33.0  10.3103   3.9 ------	UNKNOWN
	UNKNOWN