Analysis Summary
Notes:
- 1) No attempt has been made to eliminate the non-significant decimal places.
- 2) This batgrbproduct analysis is done using the HEASARC data.
- 3) This batgrbproduct analysis is using the flight position for the mask-weighting calculation.
======================================================================
                  BAT GRB EVENT DATA PROCESSING REPORT
    Process Script Ver: batgrbproduct v2.46
    Process Start Time: Mon Jan 13 19:26:22 EST 2014
             Host Name: batevent1
   Current Working Dir: /local/data/batevent/batevent_reproc/trigger506070
======================================================================

  Trigger: 00506070      Segment: 000

  BAT Trigger Time: 340992432.448   [s; MET]
      Trigger Stop: 340992433.472   [s; MET]
               UTC: 2011-10-22T16:07:04.954100    [includes UTCF correction]
       Where From?: TDRSS position message

  BAT
    RA: 275.871554015748   Dec: -23.667890214955  [deg; J2000]

     Catalogged Source?: NO
     Point Source?:      YES
     GRB Indicated?:     YES    [ by BAT flight software ]
     Image S/N Ratio:    12.41
     Image Trigger?:     NO
     Rate S/N Ratio:     18.6279360101972  [ if not an image trigger ]
     Image S/N Ratio:    12.41

  Analysis Position:   [ source = BAT ]
    RA: 275.871554015748   Dec: -23.667890214955  [deg; J2000]

  Refined Position:   [ source = BAT pre-slew burst ]
    RA: 275.87151383965   Dec: -23.667052180839  [deg; J2000]
        { 18h 23m 29.2s , -23d 40' 01.4" }
         +/- 0.923147456026262 [arcmin] (estimated 90% radius based on SNR)
         +/- 0.351109484324111 [arcmin] (formal 1-sigma fit error)
    SNR: 34.0981743313111

  Angular difference between the analysis and refined position is 0.050330 arcmin

  Partial Coding Fraction: 0.6640625    [ including projection effects ]

  Duration
     T90: 22.8199999928474 +/- 4.28261648505658
        Measured from: -14.2200000286102
                   to: 8.59999996423721     [s; relative to TRIGTIME]
     T50: 8.17599999904633 +/- 0.984893847997244
        Measured from: -4.66800004243851
                   to: 3.50799995660782     [s; relative to TRIGTIME]


  Fluence
     Peak Flux  (peak 1 second)
        Measured from: -1.46399998664856
                   to: -0.46399998664856     [s; relative to TRIGTIME]
     Total Fluence
        Measured from: -17.6920000314713
                   to: 17.5920000076294     [s; relative to TRIGTIME]

             Band 1     Band 2     Band 3     Band 4
              15-25      25-50     50-100    100-350     keV
 Total     1.002979   1.414873   0.824569   0.199698
           0.048580   0.047392   0.041762   0.039635 [error]
 Peak      0.076016   0.119071   0.071882   0.008056
           0.008818   0.008976   0.007803   0.006799 [error]

     [ fluence units of on-axis counts / fully illuminated detector ]

======================================================================


====== Table of the duration information =============================

        Value   tstart    tstop
T100   35.284  -17.692   17.592
T90    22.820  -14.220    8.600
T50     8.176   -4.668    3.508
Peak    1.000   -1.464   -0.464


====== Spectral Analysis Summary =====================================

Model      : spectral model: simple power-law (PL) and cutoff power-law (CPL)
Ph_index   : photon index: E^{Ph_index}
Ph_90err   : 90% error of the photon index
Epeak      : Epeak in keV
Epeak_90err: 90% error of Epeak
Norm       : normalization at 50 keV in both the PL model and CPL model
Nomr_90err : 90% error of the normalization
chi2       : Chi-Squared
dof        : degree of freedo

=== Time-averaged spectral analysis ===
(Best model with acceptable fit: CPL)

Model Ph_index Ph_90err_low Ph_90err_hi  Epeak  Epeak_90err_low  Epeak_90err_hi  Norm       Nomr_90err_low    Norm_90err_hi    chi2    dof
PL      -1.725    -0.081      0.080       -           -               -         6.33e-03     -2.92e-04          2.91e-04      71.870   57
CPL     -0.933    -0.366      0.401       63.704      -8.098        16.385      1.63e-02     -5.69e-03          9.92e-03      56.810   56


=== 1-s peak spectral analysis ===
(Best model with acceptable fit: PL)

Model Ph_index Ph_90err_low Ph_90err_hi  Epeak  Epeak_90err_low  Epeak_90err_hi  Norm       Nomr_90err_low    Norm_90err_hi    chi2    dof
PL      -1.706     -0.163     0.158       -           -               -         1.82e-02     -1.85e-03          1.83e-03      65.020   57
CPL     -0.905     -0.667     0.796       62.141     -13.494        76.842      4.96e-02     -2.76e-02          8.39e-02      60.680   56


=== Fluence/Peak Flux Summary ===

              Model    Band1     Band2     Band3     Band4     Band5     Total
                       15-25     25-50    50-100    100-350    15-150    15-350    keV
Fluence         PL   3.53e-07  5.65e-07  6.83e-07  1.62e-06  2.07e-06  3.22e-06   erg/cm2
      90%_error_low -2.57e-08 -2.52e-08 -4.24e-08 -2.05e-07 -9.92e-08 -2.41e-07   erg/cm2
      90%_error_hi   2.63e-08  2.51e-08  4.25e-08  2.24e-07  9.98e-08  2.56e-07   erg/cm2
Peak flux       PL   9.14e-01  8.14e-01  4.99e-01  4.64e-01  2.42e+00  2.69e+00   ph/cm2/s
      90%_error_low -1.29e-01 -7.58e-02 -6.52e-02 -1.09e-01 -2.24e-01 -2.49e-01   ph/cm2/s
      90%_error_hi   1.34e-01  7.57e-02  6.52e-02  1.29e-01  2.24e-01  2.50e-01   ph/cm2/s

Fluence        CPL   3.10e-07  6.06e-07  6.91e-07  5.46e-07  1.92e-06  2.15e-06   erg/cm2
      90%_error_low -3.12e-08 -3.15e-08 -4.72e-08 -1.93e-07 -1.17e-07 -2.26e-07   erg/cm2
      90%_error_hi   3.18e-08  3.20e-08  4.70e-08  3.13e-07  1.18e-07  3.30e-07   erg/cm2
Peak flux      CPL   8.20e-01  8.85e-01  5.12e-01  1.85e-01  2.34e+00  2.40e+00   ph/cm2/s
      90%_error_low -1.51e-01 -9.65e-02 -7.37e-02 -1.01e-01 -2.33e-01 -2.60e-01   ph/cm2/s
      90%_error_hi   1.54e-01  1.00e-01  7.34e-02  2.08e-01  2.33e-01  2.95e-01   ph/cm2/s

======================================================================
Image
Pre-slew 15.0-350.0 keV image (Event data)
#   RAcent    DECcent   POSerr    Theta     Phi              Peak Cts       SNR   Name
  275.8715   -23.6671   0.0056    26.7661   145.9096         3.5045242     34.098 TRIG_00506070

Foreground time interval of the image:
-17.692  12.853 (delta_t =  30.545 [sec])
Background time interval of the image:
-90.947 -17.692 (delta_t =  73.255 [sec])
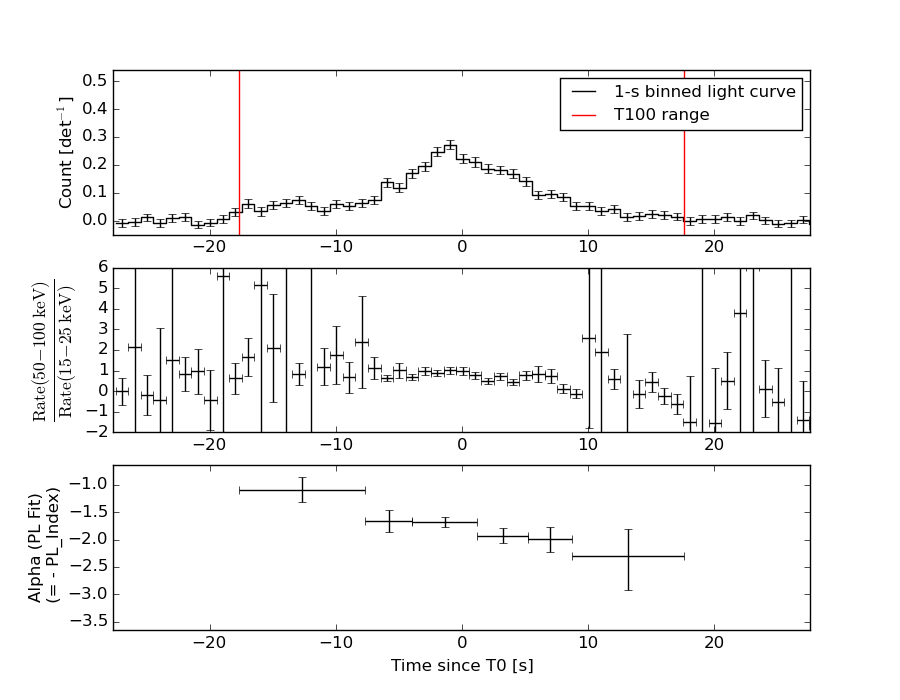
Light Curves
Note: The mask-weighted lightcurves have units of either count/det or counts/sec/det, where a det is 0.4 x 0.4 = 0.16 sq cm.
Full-time range; 1 s binning
Other quick-look light curves:
- 64 ms binning (zoomed)
- 16 ms binning (zoomed)
- 8 ms binning (zoomed)
- 2 ms binning (zoomed)
- SN=5 or 10 s binning (full-time range)
- Raw light curve
Spectra
- 64 ms binning (zoomed)
- 16 ms binning (zoomed)
- 8 ms binning (zoomed)
- 2 ms binning (zoomed)
- SN=5 or 10 s binning (full-time range)
- Raw light curve
Spectra
Notes:
- 1) The fitting includes the systematic errors.
- 2) When the burst includes telescope slew time periods, the fitting uses an average response file made from multiple 5-s response files through out the slew time plus single time preiod for the non-slew times, and weighted by the total counts in the corresponding time period using addrmf. An average response file is needed becuase a spectral fit using the pre-slew DRM will introduce some errors in both a spectral shape and a normalization if the PHA file contains a lot of the slew/post-slew time interval.
- 3) For fits to more complicated models (e.g. a power-law over a cutoff power-law), the BAT team has decided to require a chi-square improvement of more than 6 for each extra dof.
Time averaged spectrum fit using the average DRM
Power-law model
Time interval is from  -17.692 sec. to   17.592 sec.

Spectral model in power-law:
------------------------------------------------------------
Parameters  : value       lower 90%   higher 90%
Photon index: -1.72544     ( -0.0808684   0.0800795 )
Norm@50keV  : 6.33391E-03    ( -0.000292197   0.000290962 )
------------------------------------------------------------
#Fit statistic : Chi-Squared =          71.87 using 59 PHA bins.
# Reduced chi-squared =          1.261 for     57 degrees of freedom
# Null hypothesis probability =   8.877223e-02

Photon flux (15-150 keV)    in 35.28 sec: 0.848867 ( -0.038183  0.038257 ) ph/cm2/s
Energy fluence (15-150 keV)             : 2.06542e-06 ( -9.92176e-08  9.98308e-08 ) ergs/cm2
Cutoff power-law model
Time interval is from  -17.692 sec. to   17.592 sec.
Spectral model in the cutoff power-law:
------------------------------------------------------------
Parameters  : value       lower 90%   higher 90%
Photon index: -0.932674     ( -0.366053   0.401159 )
Epeak [keV] : 63.7036      ( -8.09741 16.3854 )
Norm@50keV  : 1.63145E-02    ( -0.00568673   0.00991532 )
------------------------------------------------------------
#Fit statistic : Chi-Squared =          56.81 using 59 PHA bins.
# Reduced chi-squared =          1.014 for     56 degrees of freedom
# Null hypothesis probability =   4.447187e-01

Photon flux (15-150 keV)    in 35.28 sec: 0.808310 ( -0.041878  0.04201 ) ph/cm2/s
Energy fluence (15-150 keV)             : 1.91725e-06 ( -1.16893e-07  1.18239e-07 ) ergs/cm2
1-s peak spectrum fit
Power-law model
Time interval is from   -1.464 sec. to   -0.464 sec.

Spectral model in power-law:
------------------------------------------------------------
Parameters  : value       lower 90%   higher 90%
Photon index: -1.70637     ( -0.162656   0.158409 )
Norm@50keV  : 1.82041E-02    ( -0.00184915   0.00182709 )
------------------------------------------------------------
#Fit statistic : Chi-Squared =          65.02 using 59 PHA bins.
# Reduced chi-squared =          1.141 for     57 degrees of freedom
# Null hypothesis probability =   2.175120e-01

Photon flux (15-150 keV)    in 1 sec: 2.42321 ( -0.22389  0.22405 ) ph/cm2/s
Energy fluence (15-150 keV)             : 1.68488e-07 ( -1.78377e-08  1.80726e-08 ) ergs/cm2
Cutoff power-law model
Time interval is from   -1.464 sec. to   -0.464 sec.
Spectral model in the cutoff power-law:
------------------------------------------------------------
Parameters  : value       lower 90%   higher 90%
Photon index: -0.904608     ( -0.666636   0.795597 )
Epeak [keV] : 62.1412      ( -13.4945 76.8419 )
Norm@50keV  : 4.95834E-02    ( -0.0276122   0.0838641 )
------------------------------------------------------------
#Fit statistic : Chi-Squared =          60.68 using 59 PHA bins.
# Reduced chi-squared =          1.084 for     56 degrees of freedom
# Null hypothesis probability =   3.110134e-01

Photon flux (15-150 keV)    in 1 sec: 2.34489 ( -0.23281  0.23291 ) ph/cm2/s
Energy fluence (15-150 keV)             : 1.56751e-07 ( -1.97575e-08  2.03414e-08 ) ergs/cm2
Time-resolved spectra
Distribution
T90 vs. Hardness ratio plot
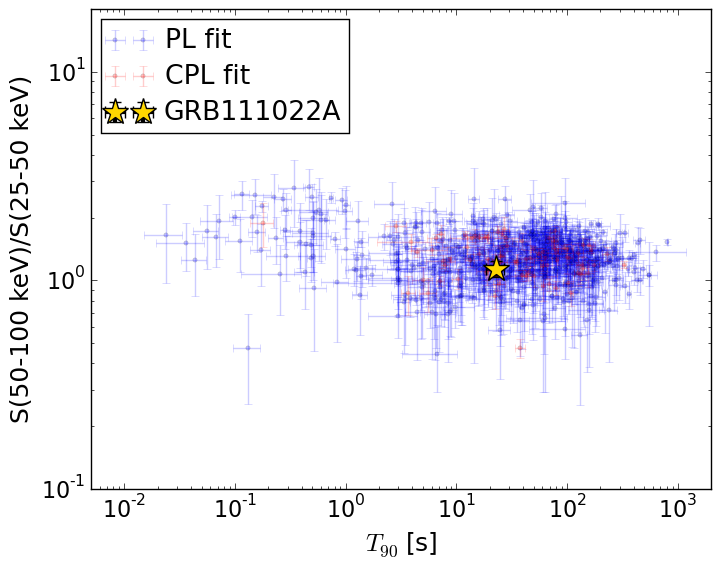
T90                                   = 22.82 sec.
Hardness ratio (energy fluence ratio) = 1.14077460779
S(15-50 keV) vs. S(50-150 keV) plot
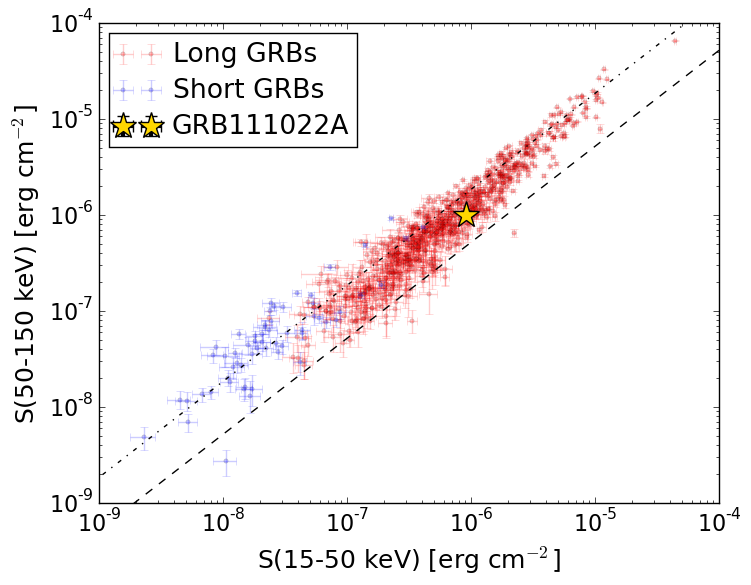
S(15-50 keV)  = 9.159384e-07
S(50-150 keV) = 1.0012988e-06
The dash-dotted line and the dashed line traces the fluences calculated from the Band function with Epeak = 15 and 150 keV, respectively. Both lines assume a canonical values of alpha = -1 and beta = -2.5.
Mask shadow pattern
IMX = -4.177162113801573E-01, IMY = -2.827130661494183E-01
Spacecraft aspect plot
Bright source in the pre-burst/pre-slew/post-slew images
Pre-burst image of 15-350 keV band
Time interval of the image:
-90.947410 -17.692000

# RAcent  DECcent POSerr Theta    Phi  PeakCts   SNR AngSep     Name
#  [deg]    [deg]    ['] [deg]  [deg]                   [']
244.9799 -15.6363    0.5  15.2 -125.8   2.6745  22.2    0.2	Sco X-1
254.2928  35.4181    7.1  40.4    7.5  -0.3167  -1.6    9.3	Her X-1
256.1081 -37.6793    0.0  32.7 -170.5   0.0521   0.3   11.4	4U 1700-377
256.2660 -36.3971    8.0  31.4 -170.8   0.2146   1.4    8.3	GX 349+2
263.1290 -24.5691    0.0  20.8  171.1  -0.1462  -1.1   12.4	GX 1+4
264.9482 -44.5689    0.0  40.4  179.8   0.1322   0.6   11.3	4U 1735-44
268.4496  -1.5226    6.2  12.9   84.6   0.2461   1.8    6.5	SW J1753.5-0127
270.1277 -25.0788   10.1  24.3  157.1  -0.1597  -1.1    8.5	GX 5-1
270.4532 -25.7328   10.8  25.0  157.4   0.1552   1.1    8.2	GRS 1758-258
273.8852 -14.2038    5.9  19.9  128.6  -0.2729  -2.0   12.3	GX 17+2
276.0905 -30.4031   22.5  31.7  155.3   0.0918   0.5    8.8	H1820-303
284.9022 -25.0045   12.8  34.2  138.5  -0.2063  -0.9    8.9	HT1900.1-2455
288.8648  10.9537    9.1  36.4   73.6  -0.4469  -1.3    3.9	GRS 1915+105
262.9233 -33.8455    5.0  29.6  177.9   0.3325   2.3    3.3	GX 354-0
276.0843  31.8441    3.4  41.5   35.8   0.8993   3.4 ------	UNKNOWN
232.6684  38.9634    2.1  48.9  -14.4   1.3782   5.4 ------	UNKNOWN
213.1725  19.6776    3.3  48.8  -48.6   2.3275   3.5 ------	UNKNOWN
Pre-slew background subtracted image of 15-350 keV band
Time interval of the image:
-17.692000 12.852580

# RAcent  DECcent POSerr Theta    Phi  PeakCts   SNR AngSep     Name
#  [deg]    [deg]    ['] [deg]  [deg]                   [']
245.0054 -15.4897   14.5  15.1 -125.4  -0.0676  -0.8    9.2	Sco X-1
254.6371  35.2126    0.0  40.2    7.9  -0.0449  -0.3   11.7	Her X-1
256.1365 -37.9782    5.6  33.0 -170.5   0.2000   2.1   10.7	4U 1700-377
256.4991 -36.3826    9.9  31.4 -171.1   0.1114   1.2    3.9	GX 349+2
263.1914 -24.8634    0.0  21.1  171.2   0.1735   2.0   12.2	GX 1+4
264.6835 -44.5028   25.2  40.3 -179.9  -0.0577  -0.5    4.1	4U 1735-44
268.5229  -1.4651    5.8  13.0   84.4  -0.1750  -2.0    9.3	SW J1753.5-0127
270.4196 -24.9855   15.7  24.3  156.4   0.0658   0.7    9.3	GX 5-1
270.2947 -25.7354    4.6  24.9  157.7   0.2256   2.5    0.6	GRS 1758-258
273.8875 -14.2151    0.0  19.9  128.6   0.1415   1.5   12.7	GX 17+2
275.9301 -30.3766 1399.6  31.6  155.5  -0.0010  -0.0    0.6	H1820-303
285.0577 -24.8391   21.1  34.2  138.1   0.0772   0.5    5.0	HT1900.1-2455
288.9256  11.0783    0.0  36.5   73.4  -0.1503  -0.7   10.9	GRS 1915+105
263.1705 -33.9525  273.4  29.7  177.6  -0.0039  -0.0   11.5	GX 354-0
275.8715 -23.6671    0.3  26.8  145.9   3.5056  34.1 ------	UNKNOWN
265.0294 -55.7953    2.4  51.3 -176.8   1.0029   4.8 ------	UNKNOWN
214.0132   7.5224    2.6  43.7  -64.0   1.5668   4.4 ------	UNKNOWN
Post-slew image of 15-350 keV band
Time interval of the image:
62.452580 962.582000

# RAcent  DECcent POSerr Theta    Phi  PeakCts   SNR AngSep     Name
#  [deg]    [deg]    ['] [deg]  [deg]                   [']
244.9815 -15.6409    0.4  30.1  -77.9  30.7569  32.0    0.1	Sco X-1
255.8236 -37.6748    0.0  22.1 -131.6   0.3615   0.6   12.8	4U 1700-377
256.3770 -36.4866    2.7  21.1 -129.5   2.6723   4.2    4.7	GX 349+2
262.8520 -24.5934   17.7  11.9  -94.8   0.4280   0.7   12.5	GX 1+4
264.8711 -44.3649    2.8  22.6 -156.8   2.5701   4.1    7.5	4U 1735-44
268.3597  -1.4376    2.8  23.4  -16.8   2.4635   4.2    1.0	SW J1753.5-0127
270.4089 -25.0826    4.2   5.2 -104.8   1.6880   2.8    6.8	GX 5-1
270.3364 -25.7461    3.5   5.4 -111.4   2.0629   3.4    1.8	GRS 1758-258
274.0711 -14.0471    3.5   9.8   -7.9   2.1445   3.3    3.9	GX 17+2
275.9640 -30.3358    2.5   6.7 -178.3   2.6939   4.6    2.8	H1820-303
285.0340 -24.9199   39.4   8.4  102.9  -0.1846  -0.3    0.1	HT1900.1-2455
288.8039  11.0215    4.5  36.9   23.9   2.5668   2.5    4.6	GRS 1915+105
262.9250 -33.8098    2.2  15.2 -132.4   2.9800   5.3    3.5	GX 354-0
327.4935 -52.5729    3.7  48.4  142.8   9.7641   3.1 ------	UNKNOWN
271.8947   8.6343    4.4  32.5   -4.9   2.0476   2.6 ------	UNKNOWN
265.8207 -80.5282    3.8  57.0 -175.6  10.2972   3.0 ------	UNKNOWN
255.2399 -41.6542    1.2  24.9 -138.9   6.1754   9.6 ------	UNKNOWN