Analysis Summary
Notes:
- 1) No attempt has been made to eliminate the non-significant decimal places.
- 2) This batgrbproduct analysis is done using the HEASARC data.
- 3) This batgrbproduct analysis is using the flight position for the mask-weighting calculation.
======================================================================
BAT GRB EVENT DATA PROCESSING REPORT
Process Script Ver: batgrbproduct v2.46
Process Start Time: Mon Jan 13 19:06:54 EST 2014
Host Name: batevent1
Current Working Dir: /local/data/batevent/batevent_reproc/trigger506291
======================================================================
Trigger: 00506291 Segment: 000
BAT Trigger Time: 341304456.512 [s; MET]
Trigger Stop: 341304456.768 [s; MET]
UTC: 2011-10-26T06:47:29.005720 [includes UTCF correction]
Where From?: TDRSS position message
BAT
RA: 244.274664858183 Dec: -47.495033090842 [deg; J2000]
Catalogged Source?: NO
Point Source?: YES
GRB Indicated?: YES [ by BAT flight software ]
Image S/N Ratio: 8.37
Image Trigger?: NO
Rate S/N Ratio: 13.0384048104053 [ if not an image trigger ]
Image S/N Ratio: 8.37
Analysis Position: [ source = BAT ]
RA: 244.274664858183 Dec: -47.495033090842 [deg; J2000]
Refined Position: [ source = BAT pre-slew burst ]
RA: 244.25637841273 Dec: -47.4386590119999 [deg; J2000]
{ 16h 17m 01.5s , -47d 26' 19.2" }
+/- 1.80533962154832 [arcmin] (estimated 90% radius based on SNR)
+/- 0.790023749399016 [arcmin] (formal 1-sigma fit error)
SNR: 13.0799368189582
Angular difference between the analysis and refined position is 3.462813 arcmin
Partial Coding Fraction: 1 [ including projection effects ]
Duration
T90: 3.5799999833107 +/- 1.06421802070536
Measured from: 0.0119999647140503
to: 3.59199994802475 [s; relative to TRIGTIME]
T50: 1.54399996995926 +/- 0.518844828199643
Measured from: 0.423999965190887
to: 1.96799993515015 [s; relative to TRIGTIME]
Fluence
Peak Flux (peak 1 second)
Measured from: 0
to: 1 [s; relative to TRIGTIME]
Total Fluence
Measured from: -0.0800000429153442
to: 4.05199998617172 [s; relative to TRIGTIME]
Band 1 Band 2 Band 3 Band 4
15-25 25-50 50-100 100-350 keV
Total 0.092292 0.126686 0.065367 0.010594
0.012936 0.012149 0.010111 0.008339 [error]
Peak 0.039621 0.065672 0.031437 0.009695
0.006632 0.006585 0.005404 0.004220 [error]
[ fluence units of on-axis counts / fully illuminated detector ]
======================================================================
====== Table of the duration information =============================
Value tstart tstop
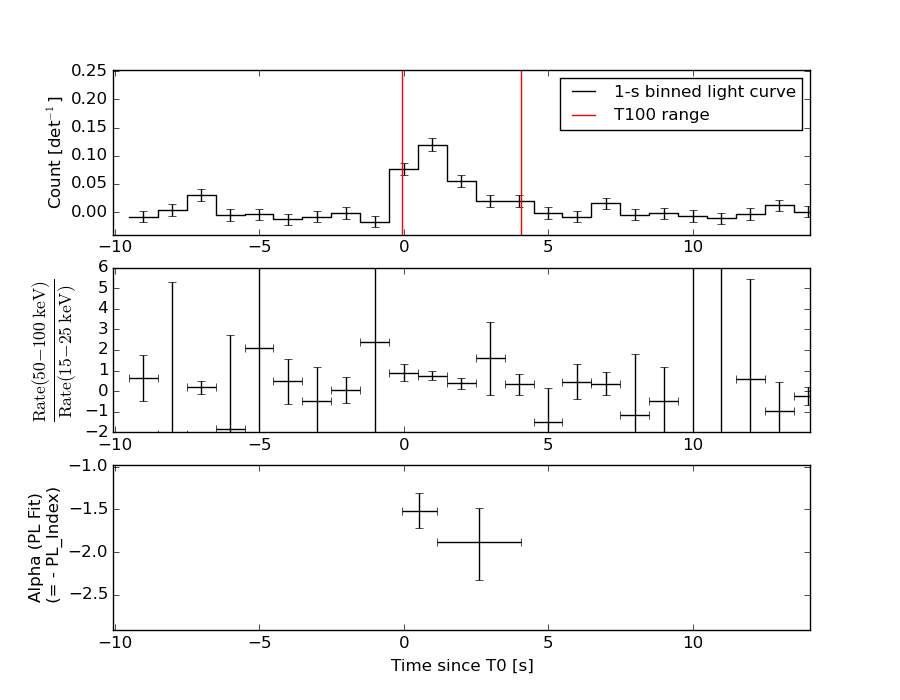
T100 4.132 -0.080 4.052
T90 3.580 0.012 3.592
T50 1.544 0.424 1.968
Peak 1.000 0.000 1.000
====== Spectral Analysis Summary =====================================
Model : spectral model: simple power-law (PL) and cutoff power-law (CPL)
Ph_index : photon index: E^{Ph_index}
Ph_90err : 90% error of the photon index
Epeak : Epeak in keV
Epeak_90err: 90% error of Epeak
Norm : normalization at 50 keV in both the PL model and CPL model
Nomr_90err : 90% error of the normalization
chi2 : Chi-Squared
dof : degree of freedo
=== Time-averaged spectral analysis ===
(Best model with acceptable fit: PL)
Model Ph_index Ph_90err_low Ph_90err_hi Epeak Epeak_90err_low Epeak_90err_hi Norm Nomr_90err_low Norm_90err_hi chi2 dof
PL -1.679 -0.212 0.207 - - - 4.35e-03 -5.64e-04 5.56e-04 53.150 57
CPL -1.089 -0.727 1.030 69.386 -22.341 -69.386 9.18e-03 -5.20e-03 2.47e-02 51.640 56
=== 1-s peak spectral analysis ===
(Best model with acceptable fit: PL)
Model Ph_index Ph_90err_low Ph_90err_hi Epeak Epeak_90err_low Epeak_90err_hi Norm Nomr_90err_low Norm_90err_hi chi2 dof
PL -1.533 -0.218 0.217 - - - 9.11e-03 -1.20e-03 1.19e-03 60.110 57
CPL -1.075 -0.642 1.355 90.512 -39.966 -90.512 1.64e-02 -8.31e-03 7.93e-02 59.530 56
=== Fluence/Peak Flux Summary ===
Model Band1 Band2 Band3 Band4 Band5 Total
15-25 25-50 50-100 100-350 15-150 15-350 keV
Fluence PL 2.72e-08 4.48e-08 5.59e-08 1.39e-07 1.67e-07 2.67e-07 erg/cm2
90%_error_low -4.97e-09 -5.36e-09 -9.60e-09 -4.35e-08 -2.26e-08 -5.35e-08 erg/cm2
90%_error_hi 5.17e-09 5.35e-09 9.65e-09 5.55e-08 2.30e-08 6.29e-08 erg/cm2
Peak flux PL 3.87e-01 3.82e-01 2.64e-01 2.88e-01 1.15e+00 1.32e+00 ph/cm2/s
90%_error_low -7.98e-02 -5.12e-02 -4.37e-02 -8.54e-02 -1.48e-01 -1.70e-01 ph/cm2/s
90%_error_hi 8.39e-02 5.08e-02 4.35e-02 1.06e-01 1.48e-01 1.71e-01 ph/cm2/s
Fluence CPL 2.54e-08 4.80e-08 5.60e-08 5.41e-08 1.57e-07 1.83e-07 erg/cm2
90%_error_low -5.67e-09 -6.91e-09 -1.10e-08 -3.87e-08 -2.61e-08 -4.76e-08 erg/cm2
90%_error_hi 5.74e-09 7.32e-09 1.05e-08 1.01e-07 2.66e-08 1.08e-07 erg/cm2
Peak flux CPL 3.68e-01 4.04e-01 2.68e-01 1.57e-01 1.13e+00 1.20e+00 ph/cm2/s
90%_error_low -9.15e-02 -6.57e-02 -4.81e-02 N/A -1.55e-01 -2.03e-01 ph/cm2/s
90%_error_hi 9.34e-02 7.68e-02 4.74e-02 N/A 1.53e-01 2.48e-01 ph/cm2/s
======================================================================
Image
Pre-slew 15.0-350.0 keV image (Event data)
#   RAcent    DECcent   POSerr    Theta     Phi              Peak Cts       SNR   Name
  244.2564   -47.4387   0.0147    14.6611  -149.8393         0.2937930     13.080 TRIG_00506291

Foreground time interval of the image:
 -0.080   4.052 (delta_t =   4.132 [sec])
Background time interval of the image:
-239.512  -0.080 (delta_t = 239.432 [sec])
Light Curves
Note: The mask-weighted lightcurves have units of either count/det or counts/sec/det, where a det is 0.4 x 0.4 = 0.16 sq cm.
Full-time range; 1 s binning
Other quick-look light curves:
- 64 ms binning (zoomed)
- 16 ms binning (zoomed)
- 8 ms binning (zoomed)
- 2 ms binning (zoomed)
- SN=5 or 10 s binning (full-time range)
- Raw light curve
Spectra
- 64 ms binning (zoomed)
- 16 ms binning (zoomed)
- 8 ms binning (zoomed)
- 2 ms binning (zoomed)
- SN=5 or 10 s binning (full-time range)
- Raw light curve
Spectra
Notes:
- 1) The fitting includes the systematic errors.
- 2) When the burst includes telescope slew time periods, the fitting uses an average response file made from multiple 5-s response files through out the slew time plus single time preiod for the non-slew times, and weighted by the total counts in the corresponding time period using addrmf. An average response file is needed becuase a spectral fit using the pre-slew DRM will introduce some errors in both a spectral shape and a normalization if the PHA file contains a lot of the slew/post-slew time interval.
- 3) For fits to more complicated models (e.g. a power-law over a cutoff power-law), the BAT team has decided to require a chi-square improvement of more than 6 for each extra dof.
Time averaged spectrum fit using the average DRM
Power-law model
Time interval is from   -0.080 sec. to    4.052 sec.

Spectral model in power-law:
------------------------------------------------------------
Parameters  : value       lower 90%   higher 90%
Photon index: -1.67949     ( -0.211847   0.207159 )
Norm@50keV  : 4.35258E-03    ( -0.000564382   0.000556388 )
------------------------------------------------------------
#Fit statistic : Chi-Squared =          53.15 using 59 PHA bins.
# Reduced chi-squared =         0.9324 for     57 degrees of freedom
# Null hypothesis probability =   6.203318e-01

Photon flux (15-150 keV)    in 4.132 sec: 0.574015 ( -0.068703  0.068784 ) ph/cm2/s
Energy fluence (15-150 keV)             : 1.66829e-07 ( -2.2627e-08  2.30037e-08 ) ergs/cm2
Cutoff power-law model
Time interval is from   -0.080 sec. to    4.052 sec.
Spectral model in the cutoff power-law:
------------------------------------------------------------
Parameters  : value       lower 90%   higher 90%
Photon index: -1.08851     ( -0.726518   1.03046 )
Epeak [keV] : 69.3857      ( -22.3411 -69.3856 )
Norm@50keV  : 9.17823E-03    ( -0.00519509   0.0246504 )
------------------------------------------------------------
#Fit statistic : Chi-Squared =          51.64 using 59 PHA bins.
# Reduced chi-squared =         0.9222 for     56 degrees of freedom
# Null hypothesis probability =   6.404075e-01

Photon flux (15-150 keV)    in 4.132 sec: 0.559684 ( -0.071723  0.071595 ) ph/cm2/s
Energy fluence (15-150 keV)             : 1.5704e-07 ( -2.60644e-08  2.65759e-08 ) ergs/cm2
1-s peak spectrum fit
Power-law model
Time interval is from    0.000 sec. to    1.000 sec.

Spectral model in power-law:
------------------------------------------------------------
Parameters  : value       lower 90%   higher 90%
Photon index: -1.53331     ( -0.217612   0.216796 )
Norm@50keV  : 9.11082E-03    ( -0.0012043   0.00119431 )
------------------------------------------------------------
#Fit statistic : Chi-Squared =          60.11 using 59 PHA bins.
# Reduced chi-squared =          1.054 for     57 degrees of freedom
# Null hypothesis probability =   3.639074e-01

Photon flux (15-150 keV)    in 1 sec: 1.14791 ( -0.14759  0.14779 ) ph/cm2/s
Energy fluence (15-150 keV)             : 8.59924e-08 ( -1.22767e-08  1.2445e-08 ) ergs/cm2
Cutoff power-law model
Time interval is from    0.000 sec. to    1.000 sec.
Spectral model in the cutoff power-law:
------------------------------------------------------------
Parameters  : value       lower 90%   higher 90%
Photon index: -1.07473     ( -0.637381   1.35955 )
Epeak [keV] : 90.5116      ( -40.7739 -91.3191 )
Norm@50keV  : 1.63700E-02    ( -0.00813861   0.0795045 )
------------------------------------------------------------
#Fit statistic : Chi-Squared =          59.53 using 59 PHA bins.
# Reduced chi-squared =          1.063 for     56 degrees of freedom
# Null hypothesis probability =   3.485945e-01

Photon flux (15-150 keV)    in 1 sec: 1.12943 ( -0.155278  0.15349 ) ph/cm2/s
Energy fluence (15-150 keV)             : 8.18031e-08 ( -1.6175e-08  1.51452e-08 ) ergs/cm2
Time-resolved spectra
Distribution
T90 vs. Hardness ratio plot
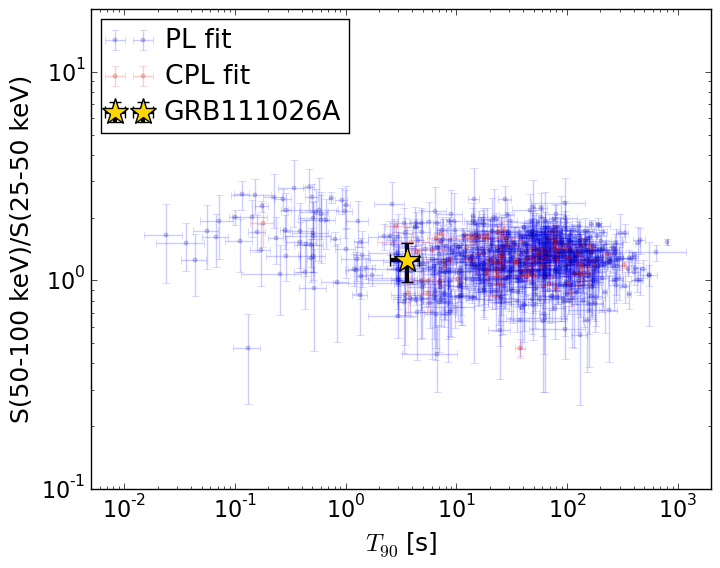
T90                                   = 3.58 sec.
Hardness ratio (energy fluence ratio) = 1.24882083873
S(15-50 keV) vs. S(50-150 keV) plot
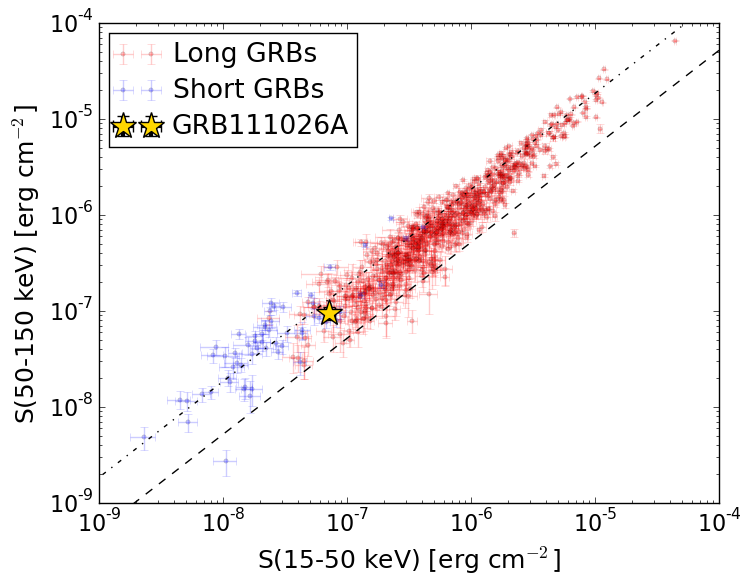
S(15-50 keV)  = 7.195991e-08
S(50-150 keV) = 9.486859e-08
The dash-dotted line and the dashed line traces the fluences calculated from the Band function with Epeak = 15 and 150 keV, respectively. Both lines assume a canonical values of alpha = -1 and beta = -2.5.
Mask shadow pattern
IMX = -2.262009851817328E-01, IMY = 1.314445653782226E-01
Spacecraft aspect plot
Bright source in the pre-burst/pre-slew/post-slew images
Pre-burst image of 15-350 keV band
Time interval of the image:
-239.512000 -0.080000

# RAcent  DECcent POSerr Theta    Phi  PeakCts   SNR AngSep     Name
#  [deg]    [deg]    ['] [deg]  [deg]                   [']
170.3165 -60.6278   41.0  57.5 -151.2   0.5149   0.3    0.3	Cen X-3
186.4947 -62.7025    4.9  49.6 -152.1   1.2524   2.3    6.0	GX 301-2
244.9695 -15.6451    0.3  23.4  -37.8   7.3533  34.7    0.6	Sco X-1
255.8235 -37.6757    0.0   1.7 -146.3  -0.1589  -0.8   12.7	4U 1700-377
256.4488 -36.3758    5.1   0.6  -98.1   0.4902   2.2    2.9	GX 349+2
263.0734 -24.6094    6.8  12.8   17.9   0.3589   1.7    8.9	GX 1+4
264.8354 -44.6007    5.2  10.0  140.6   0.4382   2.2    9.9	4U 1735-44
268.3472  -1.4600    4.0  36.4   12.2   0.8164   2.9    1.3	SW J1753.5-0127
270.2871 -25.0805    1.8  15.9   41.6   1.4030   6.5    0.2	GX 5-1
270.2589 -25.8862    3.6  15.3   43.6   0.6576   3.2    8.9	GRS 1758-258
273.9961 -14.0953    4.7  26.8   31.5   0.5944   2.4    3.6	GX 17+2
275.9578 -30.2209    3.6  16.8   67.2   0.6947   3.2    8.9	H1820-303
285.1159 -24.8579   15.7  26.5   65.3   0.2131   0.7    5.7	HT1900.1-2455
263.0020 -33.8054    2.4   5.4   56.4   1.0466   4.8    1.9	GX 354-0
293.3534 -21.1135    3.1  34.9   67.3   1.8354   3.7 ------	UNKNOWN
279.8787   5.5175    2.3  46.9   24.9   2.8593   5.1 ------	UNKNOWN
344.9495 -80.0295    3.8  53.9  160.9   3.8322   3.0 ------	UNKNOWN
155.5851 -72.0313    3.4  59.1 -166.1   4.4149   3.4 ------	UNKNOWN
204.7790 -33.6885    2.8  42.5 -109.2   4.2086   4.1 ------	UNKNOWN
Pre-slew background subtracted image of 15-350 keV band
Time interval of the image:
-0.080000 4.052000

# RAcent  DECcent POSerr Theta    Phi  PeakCts   SNR AngSep     Name
#  [deg]    [deg]    ['] [deg]  [deg]                   [']
170.1717 -60.6097    5.4  57.5 -151.2  -0.3290  -2.1    4.3	Cen X-3
186.4948 -62.8511    8.3  49.6 -152.3  -0.0765  -1.4    6.6	GX 301-2
245.1325 -15.6394   32.6  23.4  -37.4  -0.0086  -0.4    8.8	Sco X-1
255.9220 -37.6861    6.7   1.7 -148.5  -0.0379  -1.7   10.0	4U 1700-377
256.3082 -36.4041    7.1   0.8 -100.1   0.0357   1.6    6.2	GX 349+2
262.8547 -24.6340    8.4  12.7   17.1  -0.0293  -1.4   10.8	GX 1+4
264.9473 -44.5260    5.5  10.0  140.0  -0.0432  -2.1    9.9	4U 1735-44
268.2460  -1.4052   24.8  36.4   12.0   0.0151   0.5    7.8	SW J1753.5-0127
270.2833 -25.0752   31.9  15.9   41.6  -0.0085  -0.4    0.2	GX 5-1
270.1728 -25.8877  728.8  15.2   43.3  -0.0004  -0.0   11.2	GRS 1758-258
274.0050 -14.0365   42.6  26.9   31.4   0.0076   0.3    0.0	GX 17+2
275.9253 -30.3891  280.5  16.7   67.6  -0.0010  -0.0    1.3	H1820-303
285.1057 -24.9979    4.9  26.4   65.6  -0.0773  -2.4    6.0	HT1900.1-2455
263.0080 -33.7301   28.1   5.4   55.7   0.0086   0.4    6.3	GX 354-0
298.6803 -19.1733    2.4  40.1   69.3   0.4025   4.8 ------	UNKNOWN
244.2564 -47.4386    0.9  14.7 -149.8   0.2937  13.1 ------	UNKNOWN
197.6267 -48.0425    2.1  44.5 -131.4   0.3280   5.4 ------	UNKNOWN
230.0260   6.4746    2.3  49.9  -43.2   0.4762   4.9 ------	UNKNOWN
Post-slew image of 15-350 keV band
Time interval of the image:
491.888600 962.508000

# RAcent  DECcent POSerr Theta    Phi  PeakCts   SNR AngSep     Name
#  [deg]    [deg]    ['] [deg]  [deg]                   [']
244.9778 -15.6398    1.3  43.1  -61.6  12.4216   8.9    0.1	Sco X-1
255.9705 -37.7028   17.9  24.4  -90.1  -0.2657  -0.6    8.5	4U 1700-377
256.4551 -36.4094   10.9  24.3  -86.8   0.4373   1.1    1.3	GX 349+2
263.0195 -24.7705    3.2  24.3  -55.0   1.2982   3.6    1.6	GX 1+4
264.8159 -44.6008    5.0  17.8 -109.8   0.8247   2.3    9.6	4U 1735-44
268.3508  -1.4218    3.6  40.4  -20.7   1.4655   3.2    2.1	SW J1753.5-0127
270.2965 -25.0738    1.1  19.2  -43.5   3.0831  10.1    0.7	GX 5-1
270.2789 -25.7628    4.3  18.7  -45.1   0.8325   2.7    1.7	GRS 1758-258
274.0687 -13.8945    3.2  26.7  -20.0   1.2555   3.7    9.3	GX 17+2
275.8583 -30.3673    2.6  12.0  -44.7   1.3747   4.5    3.5	H1820-303
285.1368 -24.9411   12.6  13.2    1.4   0.2817   0.9    5.6	HT1900.1-2455
288.7649  10.9532    3.2  49.0   11.2   3.0355   3.7    2.0	GRS 1915+105
263.0963 -33.8320    2.2  19.7  -76.2   1.9379   5.2    5.3	GX 354-0
307.0439 -12.9702    3.4  30.7   49.7   1.8548   3.4 ------	UNKNOWN
293.7557  15.1872    3.3  53.6   17.0   6.7483   3.5 ------	UNKNOWN
301.6046 -13.9386    2.7  27.3   41.1   1.7797   4.3 ------	UNKNOWN
 34.4964 -77.0521    2.5  56.8  174.1  11.0852   4.7 ------	UNKNOWN
138.6310 -81.8189    3.1  59.1 -166.1   8.8081   3.7 ------	UNKNOWN
165.9418 -78.0741    3.8  58.8 -159.2   7.3308   3.0 ------	UNKNOWN
243.4066 -16.5896    2.5  43.7  -64.1   6.4880   4.6 ------	UNKNOWN