Analysis Summary
Notes:
- 1) No attempt has been made to eliminate the non-significant decimal places.
- 2) This batgrbproduct analysis is done using the HEASARC data.
- 3) This batgrbproduct analysis is using the flight position for the mask-weighting calculation.
======================================================================
                  BAT GRB EVENT DATA PROCESSING REPORT
    Process Script Ver: batgrbproduct v2.46
    Process Start Time: Mon Jan 13 18:51:39 EST 2014
             Host Name: batevent1
   Current Working Dir: /local/data/batevent/batevent_reproc/trigger506902
======================================================================

  Trigger: 00506902      Segment: 000

  BAT Trigger Time: 342009321.024   [s; MET]
      Trigger Stop: 342009322.048   [s; MET]
               UTC: 2011-11-03T10:35:13.489780    [includes UTCF correction]
       Where From?: TDRSS position message

  BAT
    RA: 327.121853512217   Dec: -10.5472597757318  [deg; J2000]

     Catalogged Source?: NO
     Point Source?:      YES
     GRB Indicated?:     YES    [ by BAT flight software ]
     Image S/N Ratio:    12.23
     Image Trigger?:     NO
     Rate S/N Ratio:     37.5765884561119  [ if not an image trigger ]
     Image S/N Ratio:    12.23

  Analysis Position:   [ source = BAT ]
    RA: 327.121853512217   Dec: -10.5472597757318  [deg; J2000]

  Refined Position:   [ source = BAT pre-slew burst ]
    RA: 327.111159425537   Dec: -10.5323174969455  [deg; J2000]
        { 21h 48m 26.7s , -10d 31' 56.3" }
         +/- 1.14170619401164 [arcmin] (estimated 90% radius based on SNR)
         +/- 0.330791758220111 [arcmin] (formal 1-sigma fit error)
    SNR: 25.1708493109033

  Angular difference between the analysis and refined position is 1.096226 arcmin

  Partial Coding Fraction: 0.3164062    [ including projection effects ]

  Duration
     T90: 11.6159999370575 +/- 0.449319487061713
        Measured from: -0.015999972820282
                   to: 11.5999999642372     [s; relative to TRIGTIME]
     T50: 7.04399996995926 +/- 2.1141391096008
        Measured from: 1.11599999666214
                   to: 8.1599999666214     [s; relative to TRIGTIME]


  Fluence
     Peak Flux  (peak 1 second)
        Measured from: 6.04000002145767
                   to: 7.04000002145767     [s; relative to TRIGTIME]
     Total Fluence
        Measured from: -0.416000008583069
                   to: 12.1399999856949     [s; relative to TRIGTIME]

             Band 1     Band 2     Band 3     Band 4
              15-25      25-50     50-100    100-350     keV
 Total     0.475862   0.772121   0.657359   0.205564
           0.038958   0.041178   0.037433   0.031494 [error]
 Peak      0.070147   0.157680   0.132102   0.040089
           0.012154   0.014073   0.012459   0.010025 [error]

     [ fluence units of on-axis counts / fully illuminated detector ]

======================================================================


====== Table of the duration information =============================

        Value   tstart    tstop
T100   12.556   -0.416   12.140
T90    11.616   -0.016   11.600
T50     7.044    1.116    8.160
Peak    1.000    6.040    7.040


====== Spectral Analysis Summary =====================================

Model      : spectral model: simple power-law (PL) and cutoff power-law (CPL)
Ph_index   : photon index: E^{Ph_index}
Ph_90err   : 90% error of the photon index
Epeak      : Epeak in keV
Epeak_90err: 90% error of Epeak
Norm       : normalization at 50 keV in both the PL model and CPL model
Nomr_90err : 90% error of the normalization
chi2       : Chi-Squared
dof        : degree of freedo

=== Time-averaged spectral analysis ===
(Best model with acceptable fit: PL)

Model Ph_index Ph_90err_low Ph_90err_hi  Epeak  Epeak_90err_low  Epeak_90err_hi  Norm       Nomr_90err_low    Norm_90err_hi    chi2    dof
PL      -1.292    -0.101      0.102       -           -               -         1.13e-02     -6.59e-04          6.59e-04      65.160   57
CPL     -0.928    -0.347      0.436      155.913     -57.779      -155.913      1.69e-02     -5.78e-03          1.01e-02      62.680   56


=== 1-s peak spectral analysis ===
(Best model with acceptable fit: PL)

Model Ph_index Ph_90err_low Ph_90err_hi  Epeak  Epeak_90err_low  Epeak_90err_hi  Norm       Nomr_90err_low    Norm_90err_hi    chi2    dof
PL      -1.184     -0.159     0.162       -           -               -         2.70e-02     -2.65e-03          2.65e-03      51.800   57
CPL     -0.364     -0.690     0.826      106.161     -29.770       240.874      6.70e-02     -3.53e-02          9.50e-02      47.580   56


=== Fluence/Peak Flux Summary ===

              Model    Band1     Band2     Band3     Band4     Band5     Total
                       15-25     25-50    50-100    100-350    15-150    15-350    keV
Fluence         PL   1.49e-07  3.10e-07  5.07e-07  1.87e-06  1.40e-06  2.83e-06   erg/cm2
      90%_error_low -1.61e-08 -2.06e-08 -3.58e-08 -2.76e-07 -8.97e-08 -3.01e-07   erg/cm2
      90%_error_hi   1.66e-08  2.04e-08  3.57e-08  3.08e-07  9.01e-08  3.28e-07   erg/cm2
Peak flux       PL   8.22e-01  9.98e-01  8.79e-01  1.33e+00  3.16e+00  4.03e+00   ph/cm2/s
      90%_error_low -1.47e-01 -1.16e-01 -9.74e-02 -2.79e-01 -3.20e-01 -4.13e-01   ph/cm2/s
      90%_error_hi   1.55e-01  1.14e-01  9.66e-02  3.22e-01  3.21e-01  4.18e-01   ph/cm2/s

Fluence        CPL   1.38e-07  3.21e-07  5.23e-07  1.12e-06  1.37e-06  2.10e-06   erg/cm2
      90%_error_low -1.95e-08 -2.37e-08 -4.02e-08 -4.49e-07 -9.79e-08 -4.53e-07   erg/cm2
      90%_error_hi   1.98e-08  2.42e-08  4.09e-08  7.31e-07  9.74e-08  7.45e-07   erg/cm2
Peak flux      CPL   6.93e-01  1.07e+00  9.57e-01  6.12e-01  3.08e+00  3.33e+00   ph/cm2/s
      90%_error_low -1.77e-01 -1.35e-01 -1.18e-01 -2.81e-01 -3.30e-01 -4.40e-01   ph/cm2/s
      90%_error_hi   1.86e-01  1.39e-01  1.21e-01  5.55e-01  3.29e-01  5.99e-01   ph/cm2/s

======================================================================
Image
Pre-slew 15.0-350.0 keV image (Event data)
#   RAcent    DECcent   POSerr    Theta     Phi              Peak Cts       SNR   Name
  327.1112   -10.5323   0.0076    31.5589   101.4708         2.2703735     25.171 TRIG_00506902

Foreground time interval of the image:
 -0.416  12.140 (delta_t =  12.556 [sec])
Background time interval of the image:
-109.523  -0.416 (delta_t = 109.107 [sec])
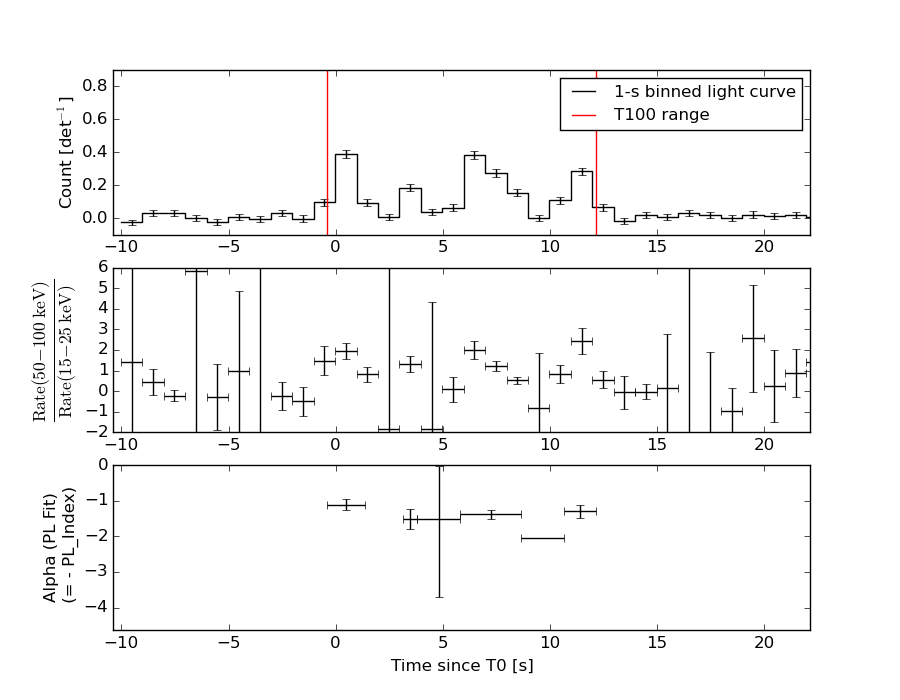
Light Curves
Note: The mask-weighted lightcurves have units of either count/det or counts/sec/det, where a det is 0.4 x 0.4 = 0.16 sq cm.
Full-time range; 1 s binning
Other quick-look light curves:
- 64 ms binning (zoomed)
- 16 ms binning (zoomed)
- 8 ms binning (zoomed)
- 2 ms binning (zoomed)
- SN=5 or 10 s binning (full-time range)
- Raw light curve
Spectra
- 64 ms binning (zoomed)
- 16 ms binning (zoomed)
- 8 ms binning (zoomed)
- 2 ms binning (zoomed)
- SN=5 or 10 s binning (full-time range)
- Raw light curve
Spectra
Notes:
- 1) The fitting includes the systematic errors.
- 2) When the burst includes telescope slew time periods, the fitting uses an average response file made from multiple 5-s response files through out the slew time plus single time preiod for the non-slew times, and weighted by the total counts in the corresponding time period using addrmf. An average response file is needed becuase a spectral fit using the pre-slew DRM will introduce some errors in both a spectral shape and a normalization if the PHA file contains a lot of the slew/post-slew time interval.
- 3) For fits to more complicated models (e.g. a power-law over a cutoff power-law), the BAT team has decided to require a chi-square improvement of more than 6 for each extra dof.
Time averaged spectrum fit using the average DRM
Power-law model
Time interval is from   -0.416 sec. to   12.140 sec.

Spectral model in power-law:
------------------------------------------------------------
Parameters  : value       lower 90%   higher 90%
Photon index: -1.29207     ( -0.101387   0.102096 )
Norm@50keV  : 1.12661E-02    ( -0.000658653   0.000658625 )
------------------------------------------------------------
#Fit statistic : Chi-Squared =          65.16 using 59 PHA bins.
# Reduced chi-squared =          1.143 for     57 degrees of freedom
# Null hypothesis probability =   2.141087e-01

Photon flux (15-150 keV)    in 12.56 sec: 1.34214 ( -0.08158  0.08171 ) ph/cm2/s
Energy fluence (15-150 keV)             : 1.40117e-06 ( -8.96946e-08  9.01131e-08 ) ergs/cm2
Cutoff power-law model
Time interval is from   -0.416 sec. to   12.140 sec.
Spectral model in the cutoff power-law:
------------------------------------------------------------
Parameters  : value       lower 90%   higher 90%
Photon index: -0.927809     ( -0.347129   0.435702 )
Epeak [keV] : 155.913      ( -57.7794 -155.913 )
Norm@50keV  : 1.68791E-02    ( -0.00577492   0.0100619 )
------------------------------------------------------------
#Fit statistic : Chi-Squared =          62.68 using 59 PHA bins.
# Reduced chi-squared =          1.119 for     56 degrees of freedom
# Null hypothesis probability =   2.512991e-01

Photon flux (15-150 keV)    in 12.56 sec: 1.32082 ( -0.08491  0.08487 ) ph/cm2/s
Energy fluence (15-150 keV)             : 1.36811e-06 ( -9.78885e-08  9.73686e-08 ) ergs/cm2
1-s peak spectrum fit
Power-law model
Time interval is from    6.040 sec. to    7.040 sec.

Spectral model in power-law:
------------------------------------------------------------
Parameters  : value       lower 90%   higher 90%
Photon index: -1.18388     ( -0.159007   0.161979 )
Norm@50keV  : 2.70122E-02    ( -0.00265387   0.00265341 )
------------------------------------------------------------
#Fit statistic : Chi-Squared =          51.80 using 59 PHA bins.
# Reduced chi-squared =         0.9087 for     57 degrees of freedom
# Null hypothesis probability =   6.700499e-01

Photon flux (15-150 keV)    in 1 sec: 3.16369 ( -0.3203  0.32088 ) ph/cm2/s
Energy fluence (15-150 keV)             : 2.7534e-07 ( -2.93372e-08  2.94846e-08 ) ergs/cm2
Cutoff power-law model
Time interval is from    6.040 sec. to    7.040 sec.
Spectral model in the cutoff power-law:
------------------------------------------------------------
Parameters  : value       lower 90%   higher 90%
Photon index: -0.363833     ( -0.689633   0.825911 )
Epeak [keV] : 106.161      ( -29.7707 240.873 )
Norm@50keV  : 6.70443E-02    ( -0.0352791   0.0949648 )
------------------------------------------------------------
#Fit statistic : Chi-Squared =          47.58 using 59 PHA bins.
# Reduced chi-squared =         0.8496 for     56 degrees of freedom
# Null hypothesis probability =   7.809998e-01

Photon flux (15-150 keV)    in 1 sec: 3.08297 ( -0.32966  0.3292 ) ph/cm2/s
Energy fluence (15-150 keV)             : 2.62997e-07 ( -3.20087e-08  3.17979e-08 ) ergs/cm2
Time-resolved spectra
Distribution
T90 vs. Hardness ratio plot
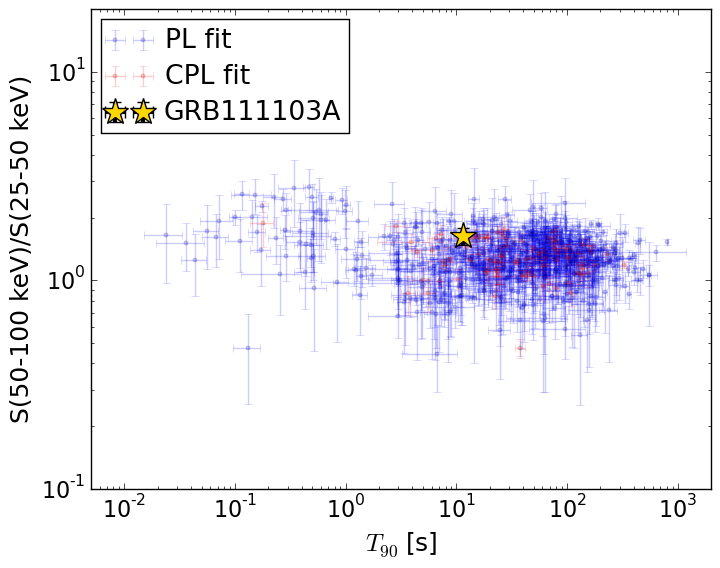
T90                                   = 11.616 sec.
Hardness ratio (energy fluence ratio) = 1.63350287879
S(15-50 keV) vs. S(50-150 keV) plot
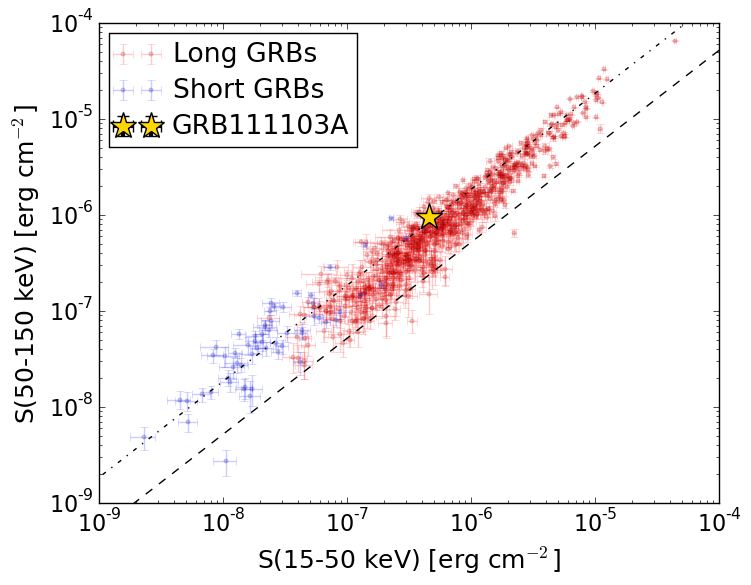
S(15-50 keV)  = 4.592213e-07
S(50-150 keV) = 9.419655e-07
The dash-dotted line and the dashed line traces the fluences calculated from the Band function with Epeak = 15 and 150 keV, respectively. Both lines assume a canonical values of alpha = -1 and beta = -2.5.
Mask shadow pattern
IMX = -1.221479280713655E-01, IMY = -6.019483966175959E-01
Spacecraft aspect plot
Bright source in the pre-burst/pre-slew/post-slew images
Pre-burst image of 15-350 keV band
Time interval of the image:
-109.523410 -0.416000

# RAcent  DECcent POSerr Theta    Phi  PeakCts   SNR AngSep     Name
#  [deg]    [deg]    ['] [deg]  [deg]                   [']
256.0286 -37.8428    1.9  44.4 -126.5   2.5039   6.0    2.0	4U 1700-377
256.3973 -36.5433    7.6  43.5 -125.1   0.6125   1.5    7.4	GX 349+2
262.9086 -24.6077   18.6  33.6 -111.0   0.1405   0.6    9.9	GX 1+4
264.7843 -44.4043    4.7  42.8 -139.8  -0.6042  -2.4    3.3	4U 1735-44
268.5075  -1.2949    0.0  27.9  -64.4   0.3435   2.1   12.6	SW J1753.5-0127
270.2894 -25.0738   33.8  27.7 -117.1  -0.0610  -0.3    0.4	GX 5-1
270.4312 -25.6803    5.6  27.8 -118.4   0.3691   2.1    7.9	GRS 1758-258
273.9960 -13.9379    4.2  20.8  -93.7   0.4104   2.7    5.9	GX 17+2
276.0780 -30.2291    0.0  26.5 -132.9   0.1004   0.7   11.5	H1820-303
284.8929 -25.0719    5.2  17.5 -139.9   0.2700   2.2   12.0	HT1900.1-2455
288.7462  10.9220    1.5  22.2   -8.2   1.0099   7.4    3.4	GRS 1915+105
299.5151  35.1983    2.8  45.8   13.4   1.0906   4.1    3.7	Cyg X-1
308.0992  40.9510    5.9  52.8   20.7   1.3985   2.0    0.5	Cyg X-3
262.9563 -33.8506    5.2  37.5 -125.4   0.4934   2.2    1.9	GX 354-0
286.9479 -28.2535    2.5  19.4 -149.9   0.5787   4.5 ------	UNKNOWN
253.4890 -33.5908    2.1  44.5 -119.8   3.2272   5.6 ------	UNKNOWN
Pre-slew background subtracted image of 15-350 keV band
Time interval of the image:
-0.416000 12.140000

# RAcent  DECcent POSerr Theta    Phi  PeakCts   SNR AngSep     Name
#  [deg]    [deg]    ['] [deg]  [deg]                   [']
255.8143 -37.6688    0.0  44.5 -126.2   0.3337   2.3   13.3	4U 1700-377
256.6068 -36.4142   14.9  43.3 -125.0   0.1030   0.8    8.3	GX 349+2
263.0049 -24.7692   23.1  33.6 -111.3   0.0376   0.5    1.4	GX 1+4
264.6769 -44.4377   15.6  42.9 -139.8   0.0550   0.7    2.9	4U 1735-44
268.4718  -1.5342    4.9  27.8  -64.9   0.1292   2.4    7.9	SW J1753.5-0127
270.1615 -25.0744    8.5  27.8 -117.0  -0.0764  -1.4    6.7	GX 5-1
270.1480 -25.8732    0.0  28.1 -118.4  -0.0545  -1.0   11.4	GRS 1758-258
274.0592 -14.1738    5.6  20.8  -94.3   0.1039   2.1    8.8	GX 17+2
276.0190 -30.3589    6.7  26.6 -133.0  -0.0874  -1.7    4.9	H1820-303
284.8569 -24.7839    0.0  17.3 -139.2  -0.1095  -2.6   12.7	HT1900.1-2455
288.6923  10.8330    3.7  22.1   -8.4  -0.1357  -3.1    9.2	GRS 1915+105
299.4972  35.0492    0.0  45.6   13.4  -0.0930  -1.0   10.2	Cyg X-1
308.1814  40.9201    8.0  52.7   20.7   0.3979   1.4    3.8	Cyg X-3
262.9933 -33.9681   12.5  37.6 -125.6  -0.0700  -0.9    8.0	GX 354-0
332.5723   2.9673    2.3  39.7   80.6   1.0615   5.1 ------	UNKNOWN
327.1112 -10.5323    0.5  31.6  101.5   2.2704  25.2 ------	UNKNOWN
288.1263  40.0707    2.9  50.9    1.5   0.4696   3.9 ------	UNKNOWN
Post-slew image of 15-350 keV band
Time interval of the image:
337.876600 879.576600

# RAcent  DECcent POSerr Theta    Phi  PeakCts   SNR AngSep     Name
#  [deg]    [deg]    ['] [deg]  [deg]                   [']
254.2951  35.3044   10.2  37.9  -45.0  -0.6954  -1.1    8.3	Her X-1
268.3731  -1.4536   26.6  34.3 -113.9   0.3046   0.4    0.3	SW J1753.5-0127
273.9533 -14.0508    3.2  40.7 -133.9   2.9441   3.6    3.2	GX 17+2
275.9283 -30.4129   12.2  54.7 -145.8   2.3949   0.9    2.8	H1820-303
285.0370 -24.9231   72.8  47.1 -153.7   0.1415   0.2    0.2	HT1900.1-2455
288.8046  10.9294    0.6  11.7 -136.2   7.6067  20.7    1.0	GRS 1915+105
299.5884  35.2026    1.7  14.6   30.6   2.5035   6.8    0.1	Cyg X-1
308.1119  40.9540    1.0  22.8   41.4   5.0351  11.8    0.1	Cyg X-3
325.9807  38.4679   46.1  31.9   64.7  -0.1716  -0.3   12.6	Cyg X-2
314.6646 -31.1004    2.7  55.8  173.6   8.1221   4.3 ------	UNKNOWN
274.4171  67.8611    2.4  48.3    4.3   3.7214   4.9 ------	UNKNOWN
277.4009   6.9777    2.7  21.9 -113.7   1.6301   4.3 ------	UNKNOWN
242.6634  48.1214    3.2  49.2  -29.6   2.9220   3.6 ------	UNKNOWN
287.7780 -37.1953    4.7  58.8 -159.2   7.6699   2.5 ------	UNKNOWN