Analysis Summary
Notes:
- 1) No attempt has been made to eliminate the non-significant decimal places.
- 2) This batgrbproduct analysis is done using the HEASARC data.
- 3) This batgrbproduct analysis is using the flight position for the mask-weighting calculation.
======================================================================
BAT GRB EVENT DATA PROCESSING REPORT
Process Script Ver: batgrbproduct v2.46
Process Start Time: Mon Jan 13 18:44:38 EST 2014
Host Name: batevent1
Current Working Dir: /local/data/batevent/batevent_reproc/trigger506903
======================================================================
Trigger: 00506903 Segment: 000
BAT Trigger Time: 342010751.488 [s; MET]
Trigger Stop: 342010752.512 [s; MET]
UTC: 2011-11-03T10:59:03.953720 [includes UTCF correction]
Where From?: TDRSS position message
BAT
RA: 265.703554097257 Dec: 1.58984331586706 [deg; J2000]
Catalogged Source?: NO
Point Source?: YES
GRB Indicated?: YES [ by BAT flight software ]
Image S/N Ratio: 16.72
Image Trigger?: NO
Rate S/N Ratio: 47.3392015141785 [ if not an image trigger ]
Image S/N Ratio: 16.72
Analysis Position: [ source = BAT ]
RA: 265.703554097257 Dec: 1.58984331586706 [deg; J2000]
Refined Position: [ source = BAT pre-slew burst ]
RA: 265.690925621519 Dec: 1.60511682143793 [deg; J2000]
{ 17h 42m 45.8s , +01d 36' 18.4" }
+/- 0.49099454723273 [arcmin] (estimated 90% radius based on SNR)
+/- 0.174806748210728 [arcmin] (formal 1-sigma fit error)
SNR: 84.030592192161
Angular difference between the analysis and refined position is 1.188900 arcmin
Partial Coding Fraction: 0.90625 [ including projection effects ]
Duration
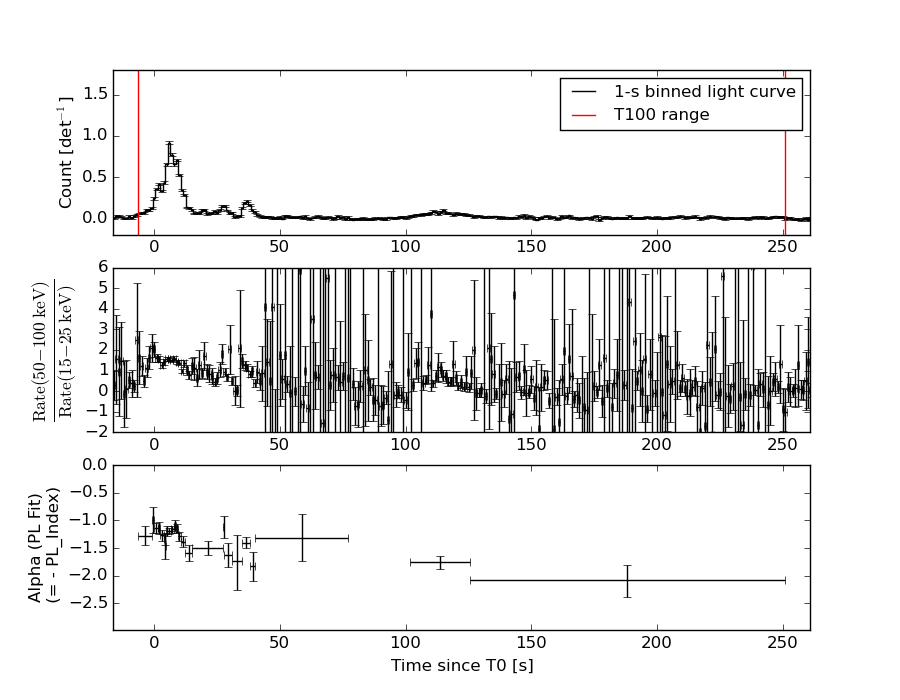
T90: 144.775999963284 +/- 33.9018423536708
Measured from: 0.0960000157356262
to: 144.871999979019 [s; relative to TRIGTIME]
T50: 31.6159999370575 +/- 0.906342099393471
Measured from: 5.70000004768372
to: 37.3159999847412 [s; relative to TRIGTIME]
Fluence
Peak Flux (peak 1 second)
Measured from: 5.47600001096725
to: 6.47600001096725 [s; relative to TRIGTIME]
Total Fluence
Measured from: -6.54799997806549
to: 250.780000030994 [s; relative to TRIGTIME]
Band 1 Band 2 Band 3 Band 4
15-25 25-50 50-100 100-350 keV
Total 3.329865 4.660685 3.702335 0.983548
0.102482 0.093691 0.079090 0.064263 [error]
Peak 0.190407 0.339086 0.304593 0.088306
0.008861 0.010233 0.009927 0.007115 [error]
[ fluence units of on-axis counts / fully illuminated detector ]
======================================================================
====== Table of the duration information =============================
Value tstart tstop
T100 257.328 -6.548 250.780
T90 144.776 0.096 144.872
T50 31.616 5.700 37.316
Peak 1.000 5.476 6.476
====== Spectral Analysis Summary =====================================
Model : spectral model: simple power-law (PL) and cutoff power-law (CPL)
Ph_index : photon index: E^{Ph_index}
Ph_90err : 90% error of the photon index
Epeak : Epeak in keV
Epeak_90err: 90% error of Epeak
Norm : normalization at 50 keV in both the PL model and CPL model
Nomr_90err : 90% error of the normalization
chi2 : Chi-Squared
dof : degree of freedo
=== Time-averaged spectral analysis ===
(Best model with acceptable fit: PL)
Model Ph_index Ph_90err_low Ph_90err_hi Epeak Epeak_90err_low Epeak_90err_hi Norm Nomr_90err_low Norm_90err_hi chi2 dof
PL -1.415 -0.048 0.048 - - - 3.19e-03 -7.85e-05 7.85e-05 51.470 57
CPL -1.411 -0.049 0.152 9997.350 -9997.350 -9997.350 3.20e-03 -7.88e-05 5.18e-04 51.490 56
=== 1-s peak spectral analysis ===
(Best model with acceptable fit: N/A)
Model Ph_index Ph_90err_low Ph_90err_hi Epeak Epeak_90err_low Epeak_90err_hi Norm Nomr_90err_low Norm_90err_hi chi2 dof
PL -1.168 -0.061 0.062 - - - 6.14e-02 -2.13e-03 2.13e-03 50.970 57
CPL -0.838 -0.245 0.259 193.743 -61.730 358.291 8.74e-02 -1.97e-02 2.71e-02 45.590 56
=== Fluence/Peak Flux Summary ===
Model Band1 Band2 Band3 Band4 Band5 Total
15-25 25-50 50-100 100-350 15-150 15-350 keV
Fluence PL 9.68e-07 1.87e-06 2.81e-06 9.12e-06 7.91e-06 1.48e-05 erg/cm2
90%_error_low -5.09e-08 -5.67e-08 -8.21e-08 -6.21e-07 -2.03e-07 -6.55e-07 erg/cm2
90%_error_hi 5.21e-08 5.65e-08 8.19e-08 6.53e-07 2.03e-07 6.82e-07 erg/cm2
Peak flux PL 5.21e-04 6.19e-03 9.55e-02 8.63e+00 4.32e-01 8.69e+00 ph/cm2/s
90%_error_low N/A N/A N/A N/A N/A N/A ph/cm2/s
90%_error_hi N/A N/A N/A N/A N/A N/A ph/cm2/s
Fluence CPL 9.73e-07 1.87e-06 2.81e-06 9.37e-06 7.93e-06 1.49e-05 erg/cm2
90%_error_low N/A -5.80e-08 -9.60e-08 -2.06e-06 -2.57e-07 -2.51e-06 erg/cm2
90%_error_hi N/A 5.70e-08 1.17e-07 -2.84e-07 1.64e-07 3.28e-07 erg/cm2
Peak flux CPL 1.70e+00 2.31e+00 2.08e+00 2.18e+00 7.07e+00 8.27e+00 ph/cm2/s
90%_error_low -1.57e-01 -1.02e-01 -9.61e-02 -4.77e-01 -2.69e-01 -5.55e-01 ph/cm2/s
90%_error_hi 1.60e-01 1.03e-01 9.70e-02 6.41e-01 2.69e-01 6.87e-01 ph/cm2/s
======================================================================
Image
Pre-slew 15.0-350.0 keV image (Event data)
#   RAcent    DECcent   POSerr    Theta     Phi              Peak Cts       SNR   Name
  265.6909     1.6051   0.0023    13.6157   -84.0718         7.2529527     84.031 TRIG_00506903

Foreground time interval of the image:
 -6.548  12.413 (delta_t =  18.961 [sec])
Background time interval of the image:
-239.488  -6.548 (delta_t = 232.940 [sec])
Light Curves
Note: The mask-weighted lightcurves have units of either count/det or counts/sec/det, where a det is 0.4 x 0.4 = 0.16 sq cm.
Full-time range; 1 s binning
Other quick-look light curves:
- 64 ms binning (zoomed)
- 16 ms binning (zoomed)
- 8 ms binning (zoomed)
- 2 ms binning (zoomed)
- SN=5 or 10 s binning (full-time range)
- Raw light curve
Spectra
- 64 ms binning (zoomed)
- 16 ms binning (zoomed)
- 8 ms binning (zoomed)
- 2 ms binning (zoomed)
- SN=5 or 10 s binning (full-time range)
- Raw light curve
Spectra
Notes:
- 1) The fitting includes the systematic errors.
- 2) When the burst includes telescope slew time periods, the fitting uses an average response file made from multiple 5-s response files through out the slew time plus single time preiod for the non-slew times, and weighted by the total counts in the corresponding time period using addrmf. An average response file is needed becuase a spectral fit using the pre-slew DRM will introduce some errors in both a spectral shape and a normalization if the PHA file contains a lot of the slew/post-slew time interval.
- 3) For fits to more complicated models (e.g. a power-law over a cutoff power-law), the BAT team has decided to require a chi-square improvement of more than 6 for each extra dof.
Time averaged spectrum fit using the average DRM
Power-law model
Time interval is from   -6.548 sec. to  250.780 sec.

Spectral model in power-law:
------------------------------------------------------------
Parameters  : value       lower 90%   higher 90%
Photon index: -1.41459     ( -0.048216   0.0483438 )
Norm@50keV  : 3.19188E-03    ( -7.85227e-05   7.8499e-05 )
------------------------------------------------------------
#Fit statistic : Chi-Squared =          51.47 using 59 PHA bins.
# Reduced chi-squared =         0.9029 for     57 degrees of freedom
# Null hypothesis probability =   6.818615e-01

Photon flux (15-150 keV)    in 257.3 sec: 0.390025 ( -0.010855  0.010914 ) ph/cm2/s
Energy fluence (15-150 keV)             : 7.91334e-06 ( -2.0271e-07  2.02993e-07 ) ergs/cm2
Cutoff power-law model
Time interval is from   -6.548 sec. to  250.780 sec.
Spectral model in the cutoff power-law:
------------------------------------------------------------
Parameters  : value       lower 90%   higher 90%
Photon index: -1.41121     ( -0.0485912   0.151597 )
Epeak [keV] : 9997.35      ( -9997.86 -9997.86 )
Norm@50keV  : 3.20325E-03    ( -7.85088e-05   0.000518118 )
------------------------------------------------------------
#Fit statistic : Chi-Squared =          51.49 using 59 PHA bins.
# Reduced chi-squared =         0.9194 for     56 degrees of freedom
# Null hypothesis probability =   6.461376e-01

Photon flux (15-150 keV)    in 257.3 sec: 0.390824 ( -0.014436  0.012041 ) ph/cm2/s
Energy fluence (15-150 keV)             : 7.92664e-06 ( -2.57447e-07  1.63569e-07 ) ergs/cm2
1-s peak spectrum fit
Power-law model
Time interval is from    5.476 sec. to    6.476 sec.

Spectral model in power-law:
------------------------------------------------------------
Parameters  : value       lower 90%   higher 90%
Photon index: -1.16762     ( -0.061414   0.0616049 )
Norm@50keV  : 6.14101E-02    ( -0.00213163   0.00213156 )
------------------------------------------------------------
#Fit statistic : Chi-Squared =          50.97 using 59 PHA bins.
# Reduced chi-squared =         0.8942 for     57 degrees of freedom
# Null hypothesis probability =   6.995474e-01

Photon flux (15-150 keV)    in 1 sec: 0.431637 (    ) ph/cm2/s
Energy fluence (15-150 keV)             : 6.28941e-07 ( -2.42827e-08  2.4355e-08 ) ergs/cm2
Cutoff power-law model
Time interval is from    5.476 sec. to    6.476 sec.
Spectral model in the cutoff power-law:
------------------------------------------------------------
Parameters  : value       lower 90%   higher 90%
Photon index: -0.838237     ( -0.244585   0.258923 )
Epeak [keV] : 193.743      ( -61.7349 358.286 )
Norm@50keV  : 8.73607E-02    ( -0.0196567   0.0270685 )
------------------------------------------------------------
#Fit statistic : Chi-Squared =          45.59 using 59 PHA bins.
# Reduced chi-squared =         0.8141 for     56 degrees of freedom
# Null hypothesis probability =   8.383933e-01

Photon flux (15-150 keV)    in 1 sec: 7.06805 ( -0.2686  0.26866 ) ph/cm2/s
Energy fluence (15-150 keV)             : 6.16311e-07 ( -2.6436e-08  2.62731e-08 ) ergs/cm2
Time-resolved spectra
Distribution
T90 vs. Hardness ratio plot
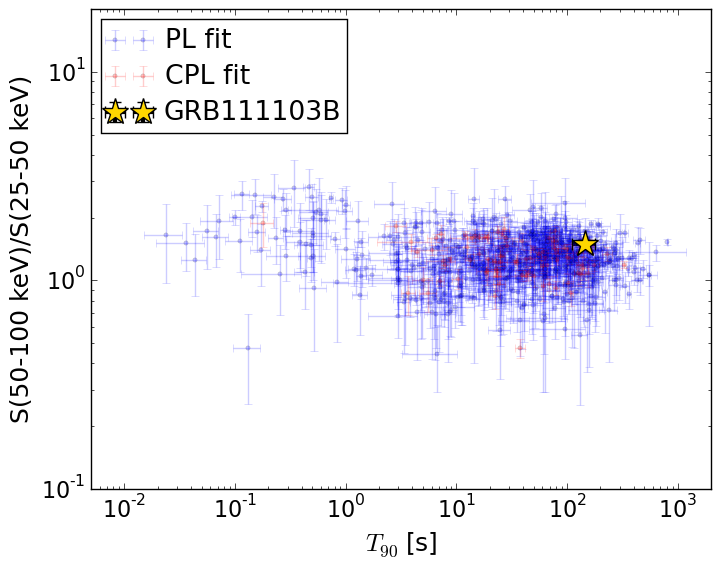
T90                                   = 144.776 sec.
Hardness ratio (energy fluence ratio) = 1.50051408135
S(15-50 keV) vs. S(50-150 keV) plot
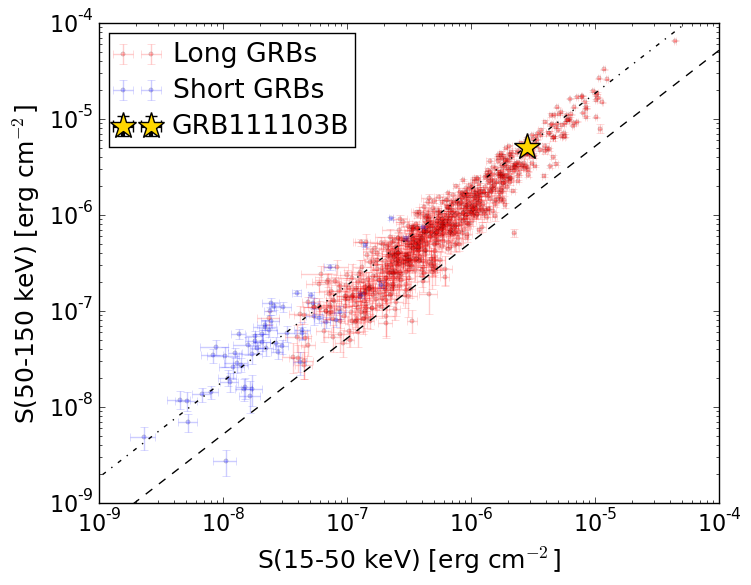
S(15-50 keV)  = 2.8422491e-06
S(50-150 keV) = 5.071099e-06
The dash-dotted line and the dashed line traces the fluences calculated from the Band function with Epeak = 15 and 150 keV, respectively. Both lines assume a canonical values of alpha = -1 and beta = -2.5.
Mask shadow pattern
IMX = 2.501653598879804E-02, IMY = 2.409202475006707E-01
Spacecraft aspect plot
Bright source in the pre-burst/pre-slew/post-slew images
Pre-burst image of 15-350 keV band
Time interval of the image:
-239.488000 -6.548000

# RAcent  DECcent POSerr Theta    Phi  PeakCts   SNR AngSep     Name
#  [deg]    [deg]    ['] [deg]  [deg]                   [']
244.9904 -15.6501    0.5  39.0 -106.2  16.0478  24.8    0.9	Sco X-1
254.5346  35.5325  726.1  39.1  -18.1   0.0041   0.0   12.0	Her X-1
256.0209 -37.8542    2.4  46.8 -140.4   2.7899   4.9    1.7	4U 1700-377
256.3290 -36.3815    5.6  45.4 -139.5  -1.0551  -2.1    5.7	GX 349+2
262.9185 -24.7362    6.3  32.5 -137.4   0.4552   1.8    5.0	GX 1+4
264.7464 -44.4692  467.8  49.9 -152.1   0.0123   0.0    1.2	4U 1735-44
268.4152  -1.3715    7.0  11.9 -100.7   0.3412   1.7    5.6	SW J1753.5-0127
270.2144 -25.0238    4.1  30.0 -149.2   0.6116   2.8    5.0	GX 5-1
270.3534 -25.7461    3.7  30.7 -149.9   0.6915   3.1    2.8	GRS 1758-258
274.0655 -14.0773    1.9  18.5 -149.8   1.2273   6.1    4.3	GX 17+2
275.8303 -30.5320    0.0  34.4 -160.5   0.1437   0.6   11.0	H1820-303
285.1399 -24.7740    3.7  29.1 -176.8   0.7269   3.1   10.5	HT1900.1-2455
288.7638  10.9747    1.7  12.0   66.6   1.1931   6.6    2.7	GRS 1915+105
299.5427  35.1729    2.0  36.7   42.9   2.0079   5.8    2.9	Cyg X-1
308.1226  41.0619    4.1  45.5   45.2   2.6100   2.8    6.6	Cyg X-3
263.0715 -33.8629    2.7  40.5 -144.8   1.3585   4.2    4.4	GX 354-0
312.2583  -1.9139    2.5  33.6  113.5   1.8345   4.6 ------	UNKNOWN
293.7818  49.0780    3.0  47.1   27.5   2.3477   3.9 ------	UNKNOWN
268.1324  10.5323    2.6  12.9  -43.0   0.7735   4.4 ------	UNKNOWN
270.4429 -20.5118    2.8  25.7 -146.4   0.8517   4.2 ------	UNKNOWN
267.6127 -50.5985    2.9  55.2 -156.7   2.9999   4.0 ------	UNKNOWN
	UNKNOWN
Pre-slew background subtracted image of 15-350 keV band
Time interval of the image:
-6.548000 12.412600

# RAcent  DECcent POSerr Theta    Phi  PeakCts   SNR AngSep     Name
#  [deg]    [deg]    ['] [deg]  [deg]                   [']
245.1141 -15.7345    4.4  38.9 -106.4   0.6483   2.6    9.6	Sco X-1
254.5789  35.4263   60.1  39.0  -18.1  -0.0240  -0.2    7.8	Her X-1
255.9961 -37.9307    3.1  46.8 -140.4  -0.8028  -3.7    5.2	4U 1700-377
256.4952 -36.4284    5.5  45.4 -139.7  -0.4228  -2.1    2.9	GX 349+2
262.9612 -24.7149   10.9  32.5 -137.4  -0.1163  -1.1    3.2	GX 1+4
264.5820 -44.4217    7.5  49.9 -152.0   0.3289   1.5    7.1	4U 1735-44
268.3673  -1.4456   34.8  12.0 -100.9   0.0270   0.3    0.4	SW J1753.5-0127
270.0992 -24.9901    5.5  30.0 -149.0   0.2062   2.1   11.4	GX 5-1
270.2534 -25.8053    4.3  30.7 -149.7  -0.2726  -2.7    4.6	GRS 1758-258
274.0586 -14.0398   46.6  18.5 -149.7  -0.0213  -0.2    3.1	GX 17+2
275.9072 -30.4123    4.4  34.3 -160.6  -0.2607  -2.6    2.9	H1820-303
285.1980 -24.9572    6.7  29.3 -176.8  -0.1673  -1.7    9.1	HT1900.1-2455
288.8112  11.0993    4.7  12.1   66.2  -0.2078  -2.4    9.3	GRS 1915+105
299.7658  35.1823   16.5  36.8   43.1  -0.1113  -0.7    8.7	Cyg X-1
308.3262  40.8165    9.4  45.4   45.6  -0.5301  -1.2   12.8	Cyg X-3
263.0439 -33.9298    8.8  40.6 -144.8  -0.1825  -1.3    6.3	GX 354-0
302.3673  30.1959    2.7  34.4   51.5   0.6863   4.3 ------	UNKNOWN
264.0222  32.6952    2.4  32.3   -9.9   0.4561   4.9 ------	UNKNOWN
265.6909   1.6051    0.1  13.6  -84.1   7.2534  84.2 ------	UNKNOWN
255.6891 -36.7235    2.2  46.0 -139.2   1.0652   5.2 ------	UNKNOWN
Post-slew image of 15-350 keV band
Time interval of the image:
48.412600 384.112600

# RAcent  DECcent POSerr Theta    Phi  PeakCts   SNR AngSep     Name
#  [deg]    [deg]    ['] [deg]  [deg]                   [']
244.9826 -15.6371    0.2  26.8 -109.4  22.5591  53.1    0.3	Sco X-1
254.4707  35.3493  136.9  35.3    5.5   0.0348   0.1    0.8	Her X-1
255.9355 -37.8782    2.0  40.5 -146.6   2.9653   5.9    3.2	4U 1700-377
256.4390 -36.4295   23.1  39.0 -146.7   0.2488   0.5    0.4	GX 349+2
262.9754 -24.7512    3.5  26.5 -153.0   1.0938   3.3    1.9	GX 1+4
264.7200 -44.6033   25.7  46.2 -157.6  -0.2937  -0.4    9.2	4U 1735-44
268.4048  -1.5204   18.7   4.1  160.7   0.1829   0.6    4.6	SW J1753.5-0127
270.4421 -25.0704    6.3  27.1 -168.0   0.5765   1.8    8.6	GX 5-1
270.3186 -25.7746    4.4  27.7 -167.5   0.8124   2.6    2.1	GRS 1758-258
273.9688 -13.9575    2.7  17.6  174.0   1.2759   4.3    5.2	GX 17+2
275.8561 -30.3534    5.5  33.4 -174.6   0.7881   2.1    3.7	H1820-303
285.1829 -24.9070   11.5  32.5  167.3  -0.4432  -1.0    8.0	HT1900.1-2455
288.8026  10.9747    1.0  24.8   88.3   5.1196  11.4    1.8	GRS 1915+105
262.9472 -33.8491    2.2  35.6 -154.6   1.9989   5.3    2.3	GX 354-0
289.7506  42.7374    3.7  46.4   45.8   4.7088   3.1 ------	UNKNOWN
288.0901  13.6935    3.2  25.2   81.7   1.4773   3.6 ------	UNKNOWN
265.7373   1.6404    1.1   0.0   59.0   3.1680  10.9 ------	UNKNOWN
229.8815 -20.6236    3.8  41.5 -102.8   4.9004   3.0 ------	UNKNOWN