Analysis Summary
Notes:
- 1) No attempt has been made to eliminate the non-significant decimal places.
- 2) This batgrbproduct analysis is done using the HEASARC data.
- 3) This batgrbproduct analysis is using the flight position for the mask-weighting calculation.
======================================================================
BAT GRB EVENT DATA PROCESSING REPORT
Process Script Ver: batgrbproduct v2.46
Process Start Time: Mon Jan 13 18:37:06 EST 2014
Host Name: batevent1
Current Working Dir: /local/data/batevent/batevent_reproc/trigger507185
======================================================================
Trigger: 00507185 Segment: 000
BAT Trigger Time: 342319831.552 [s; MET]
Trigger Stop: 342319832.576 [s; MET]
UTC: 2011-11-07T00:50:24.005480 [includes UTCF correction]
Where From?: TDRSS position message
BAT
RA: 129.483957089502 Dec: -66.5062128673647 [deg; J2000]
Catalogged Source?: NO
Point Source?: YES
GRB Indicated?: YES [ by BAT flight software ]
Image S/N Ratio: 8.26
Image Trigger?: NO
Rate S/N Ratio: 13.856406460551 [ if not an image trigger ]
Image S/N Ratio: 8.26
Analysis Position: [ source = BAT ]
RA: 129.483957089502 Dec: -66.5062128673647 [deg; J2000]
Refined Position: [ source = BAT pre-slew burst ]
RA: 129.485162907022 Dec: -66.5197154018901 [deg; J2000]
{ 08h 37m 56.4s , -66d 31' 11.0" }
+/- 1.15762095738858 [arcmin] (estimated 90% radius based on SNR)
+/- 0.365520213246293 [arcmin] (formal 1-sigma fit error)
SNR: 24.6779605066306
Angular difference between the analysis and refined position is 0.810665 arcmin
Partial Coding Fraction: 0.71875 [ including projection effects ]
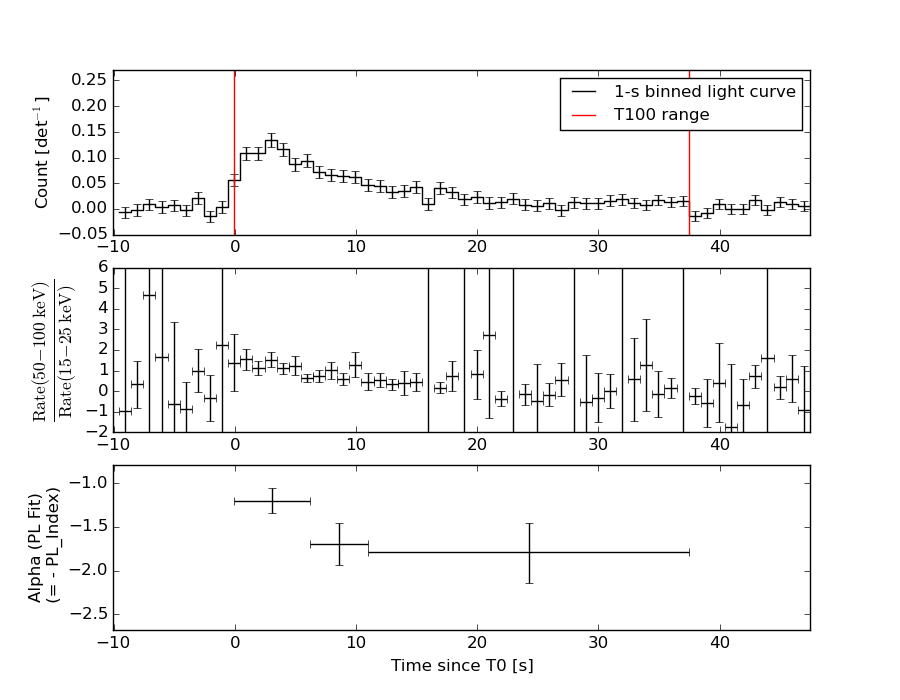
Duration
T90: 31.0720000267029 +/- 7.15255476285363
Measured from: 0.76800000667572
to: 31.8400000333786 [s; relative to TRIGTIME]
T50: 11.0880000591278 +/- 2.66984338721389
Measured from: 3.15200001001358
to: 14.2400000691414 [s; relative to TRIGTIME]
Fluence
Peak Flux (peak 1 second)
Measured from: 2.13200002908707
to: 3.13200002908707 [s; relative to TRIGTIME]
Total Fluence
Measured from: -0.0960000157356262
to: 37.4560000300407 [s; relative to TRIGTIME]
Band 1 Band 2 Band 3 Band 4
15-25 25-50 50-100 100-350 keV
Total 0.424469 0.549489 0.400311 0.112398
0.037682 0.038448 0.033017 0.028420 [error]
Peak 0.036081 0.052270 0.055092 0.011930
0.006782 0.007235 0.006573 0.005240 [error]
[ fluence units of on-axis counts / fully illuminated detector ]
======================================================================
====== Table of the duration information =============================
Value tstart tstop
T100 37.552 -0.096 37.456
T90 31.072 0.768 31.840
T50 11.088 3.152 14.240
Peak 1.000 2.132 3.132
====== Spectral Analysis Summary =====================================
Model : spectral model: simple power-law (PL) and cutoff power-law (CPL)
Ph_index : photon index: E^{Ph_index}
Ph_90err : 90% error of the photon index
Epeak : Epeak in keV
Epeak_90err: 90% error of Epeak
Norm : normalization at 50 keV in both the PL model and CPL model
Nomr_90err : 90% error of the normalization
chi2 : Chi-Squared
dof : degree of freedo
=== Time-averaged spectral analysis ===
(Best model with acceptable fit: PL)
Model Ph_index Ph_90err_low Ph_90err_hi Epeak Epeak_90err_low Epeak_90err_hi Norm Nomr_90err_low Norm_90err_hi chi2 dof
PL -1.483 -0.145 0.144 - - - 2.55e-03 -2.00e-04 1.99e-04 60.320 57
CPL -1.480 -0.147 0.333 9999.360 -9999.360 -9999.360 2.56e-03 -2.01e-03 -1.14e-03 60.340 56
=== 1-s peak spectral analysis ===
(Best model with acceptable fit: PL)
Model Ph_index Ph_90err_low Ph_90err_hi Epeak Epeak_90err_low Epeak_90err_hi Norm Nomr_90err_low Norm_90err_hi chi2 dof
PL -1.104 -0.234 0.239 - - - 1.07e-02 -1.39e-03 1.38e-03 53.890 57
CPL -0.980 -0.341 0.835 473.544 -473.544 -473.544 1.21e-02 -1.21e-02 -8.49e-03 53.920 56
=== Fluence/Peak Flux Summary ===
Model Band1 Band2 Band3 Band4 Band5 Total
15-25 25-50 50-100 100-350 15-150 15-350 keV
Fluence PL 1.21e-07 2.24e-07 3.20e-07 9.68e-07 9.12e-07 1.63e-06 erg/cm2
90%_error_low -1.65e-08 -1.83e-08 -3.33e-08 -2.06e-07 -7.88e-08 -2.32e-07 erg/cm2
90%_error_hi 1.72e-08 1.82e-08 3.31e-08 2.42e-07 7.96e-08 2.61e-07 erg/cm2
Peak flux PL 3.01e-01 3.84e-01 3.57e-01 5.84e-01 1.24e+00 1.63e+00 ph/cm2/s
90%_error_low -7.68e-02 -6.20e-02 -5.26e-02 -1.69e-01 -1.65e-01 -2.25e-01 ph/cm2/s
90%_error_hi 8.39e-02 6.06e-02 5.18e-02 2.09e-01 1.66e-01 2.32e-01 ph/cm2/s
Fluence CPL 1.22e-07 2.22e-07 3.18e-07 1.03e-06 9.18e-07 1.58e-06 erg/cm2
90%_error_low N/A -2.16e-08 N/A -4.60e-07 -1.05e-07 -3.66e-07 erg/cm2
90%_error_hi N/A 1.26e-08 N/A 5.20e-08 9.54e-08 3.01e-07 erg/cm2
Peak flux CPL 3.02e-01 3.84e-01 3.58e-01 5.50e-01 1.24e+00 1.62e+00 ph/cm2/s
90%_error_low -1.02e-01 -6.05e-02 -5.24e-02 -3.06e-01 -1.74e-01 -3.97e-01 ph/cm2/s
90%_error_hi 5.89e-02 6.52e-02 6.47e-02 2.34e-01 1.65e-01 2.20e-01 ph/cm2/s
======================================================================
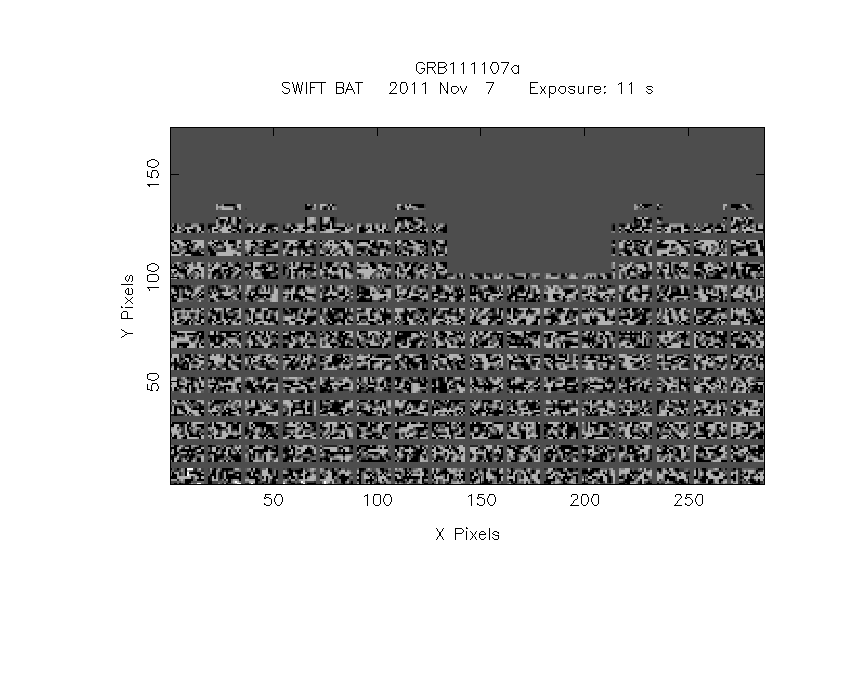
Image
Pre-slew 15.0-350.0 keV image (Event data)
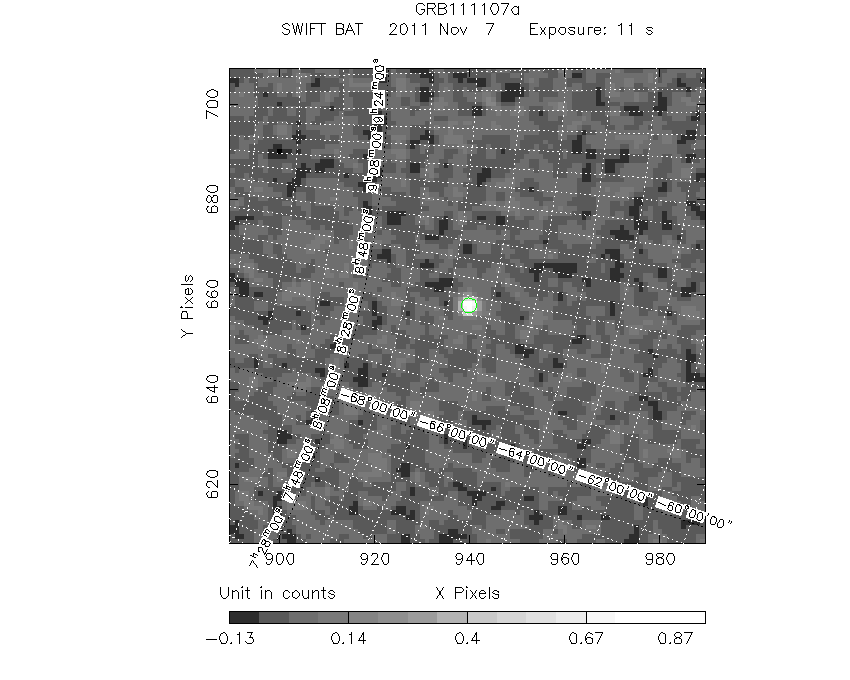
#   RAcent    DECcent   POSerr    Theta     Phi              Peak Cts       SNR   Name
  129.4852   -66.5197   0.0078    21.8382  -108.3915         0.9915774     24.678 TRIG_00507185

Foreground time interval of the image:
 -0.096  10.749 (delta_t =  10.845 [sec])
Background time interval of the image:
-239.552  -0.096 (delta_t = 239.456 [sec])
Light Curves
Note: The mask-weighted lightcurves have units of either count/det or counts/sec/det, where a det is 0.4 x 0.4 = 0.16 sq cm.
Full-time range; 1 s binning
Other quick-look light curves:
- 64 ms binning (zoomed)
- 16 ms binning (zoomed)
- 8 ms binning (zoomed)
- 2 ms binning (zoomed)
- SN=5 or 10 s binning (full-time range)
- Raw light curve
Spectra
- 64 ms binning (zoomed)
- 16 ms binning (zoomed)
- 8 ms binning (zoomed)
- 2 ms binning (zoomed)
- SN=5 or 10 s binning (full-time range)
- Raw light curve
Spectra
Notes:
- 1) The fitting includes the systematic errors.
- 2) When the burst includes telescope slew time periods, the fitting uses an average response file made from multiple 5-s response files through out the slew time plus single time preiod for the non-slew times, and weighted by the total counts in the corresponding time period using addrmf. An average response file is needed becuase a spectral fit using the pre-slew DRM will introduce some errors in both a spectral shape and a normalization if the PHA file contains a lot of the slew/post-slew time interval.
- 3) For fits to more complicated models (e.g. a power-law over a cutoff power-law), the BAT team has decided to require a chi-square improvement of more than 6 for each extra dof.
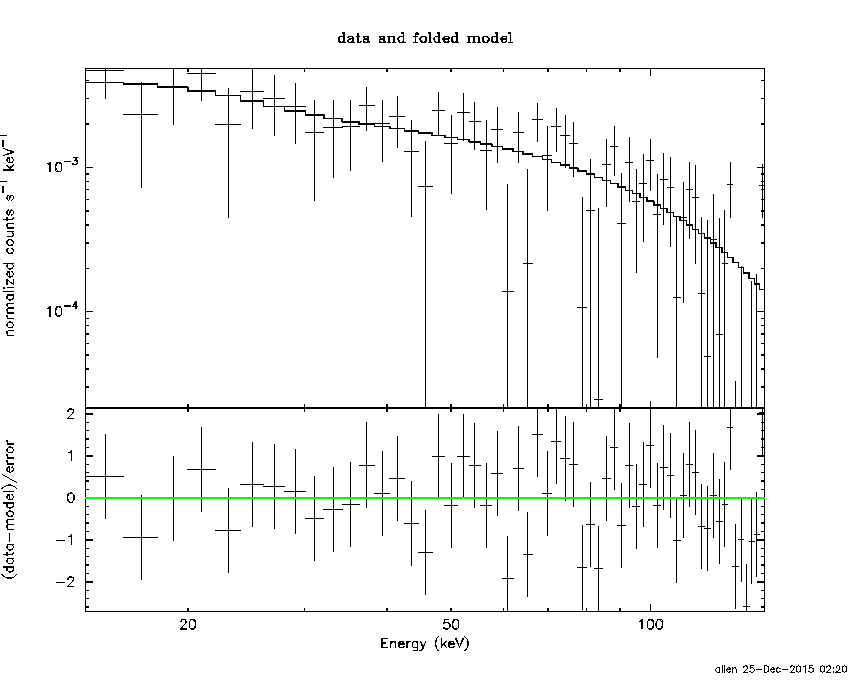
Time averaged spectrum fit using the average DRM
Power-law model
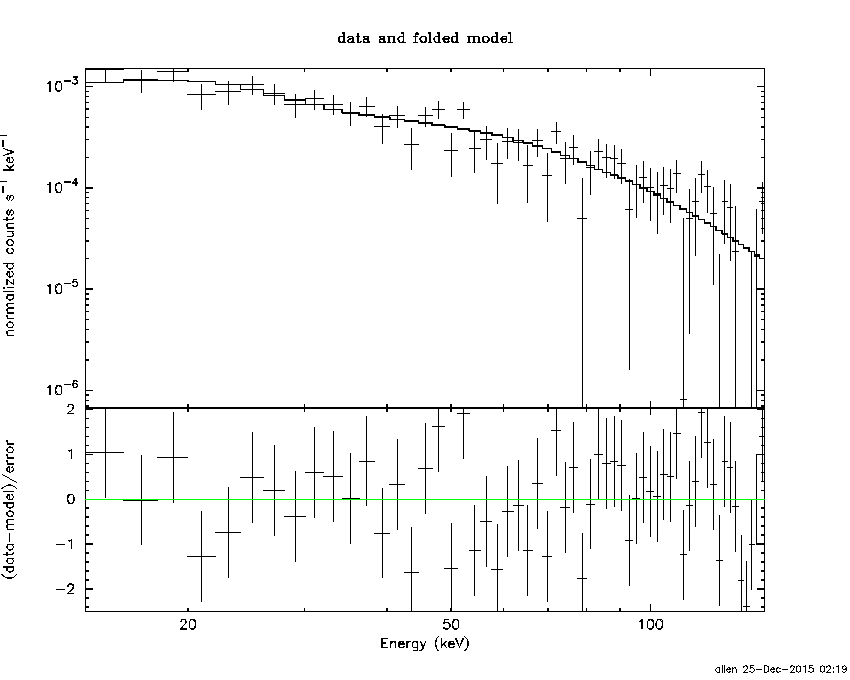
Time interval is from   -0.096 sec. to   37.456 sec.

Spectral model in power-law:
------------------------------------------------------------
Parameters  : value       lower 90%   higher 90%
Photon index: -1.48341     ( -0.144997   0.144281 )
Norm@50keV  : 2.55402E-03    ( -0.000199761   0.000198868 )
------------------------------------------------------------
#Fit statistic : Chi-Squared =          60.32 using 59 PHA bins.
# Reduced chi-squared =          1.058 for     57 degrees of freedom
# Null hypothesis probability =   3.566235e-01

Photon flux (15-150 keV)    in 37.55 sec: 0.317449 ( -0.024929  0.025018 ) ph/cm2/s
Energy fluence (15-150 keV)             : 9.12431e-07 ( -7.88268e-08  7.95876e-08 ) ergs/cm2
Cutoff power-law model
Time interval is from   -0.096 sec. to   37.456 sec.
Spectral model in the cutoff power-law:
------------------------------------------------------------
Parameters  : value       lower 90%   higher 90%
Photon index: -2.30536     ( -0.146767   0.33296 )
Epeak [keV] : 108.424      ( -9999.36 -9999.36 )
Norm@50keV  : 9.70436E-04    ( -0.000413545   0.000456037 )
------------------------------------------------------------
#Fit statistic : Chi-Squared =          58.55 using 59 PHA bins.
# Reduced chi-squared =          1.046 for     56 degrees of freedom
# Null hypothesis probability =   3.820580e-01

Photon flux (15-150 keV)    in 37.55 sec: 0.319304 (    ) ph/cm2/s
Energy fluence (15-150 keV)             : 9.17594e-07 ( -1.05194e-07  9.54303e-08 ) ergs/cm2
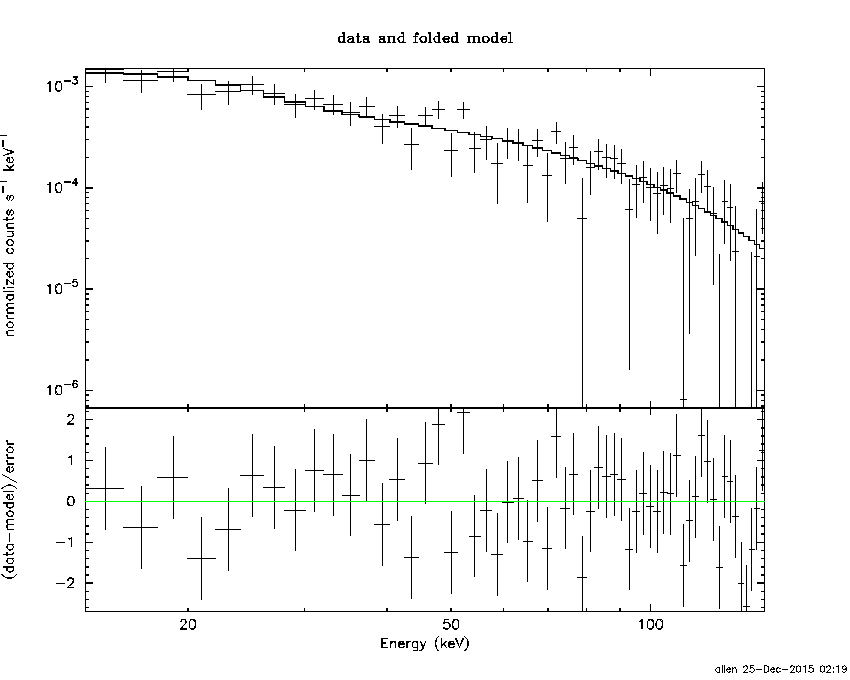
1-s peak spectrum fit
Power-law model
Time interval is from    2.132 sec. to    3.132 sec.

Spectral model in power-law:
------------------------------------------------------------
Parameters  : value       lower 90%   higher 90%
Photon index: -1.10355     ( -0.233593   0.239105 )
Norm@50keV  : 1.06788E-02    ( -0.00138525   0.00138337 )
------------------------------------------------------------
#Fit statistic : Chi-Squared =          53.89 using 59 PHA bins.
# Reduced chi-squared =         0.9455 for     57 degrees of freedom
# Null hypothesis probability =   5.923465e-01

Photon flux (15-150 keV)    in 1 sec: 1.23909 ( -0.16543  0.16603 ) ph/cm2/s
Energy fluence (15-150 keV)             : 1.11535e-07 ( -1.59301e-08  1.6056e-08 ) ergs/cm2
Cutoff power-law model
Time interval is from    2.132 sec. to    3.132 sec.
Spectral model in the cutoff power-law:
------------------------------------------------------------
Parameters  : value       lower 90%   higher 90%
Photon index: -2.39412     ( -0.332973   0.843874 )
Epeak [keV] : 128.609      ( -9996.4 -9996.4 )
Norm@50keV  : 1.71947E-03    ( -0.00171891   0.00192211 )
------------------------------------------------------------
#Fit statistic : Chi-Squared =          53.77 using 59 PHA bins.
# Reduced chi-squared =         0.9602 for     56 degrees of freedom
# Null hypothesis probability =   5.597694e-01

Photon flux (15-150 keV)    in 1 sec: 1.23917 ( -0.17383  0.16506 ) ph/cm2/s
Energy fluence (15-150 keV)             : 1.11383e-07 ( -1.66176e-08  1.52742e-08 ) ergs/cm2
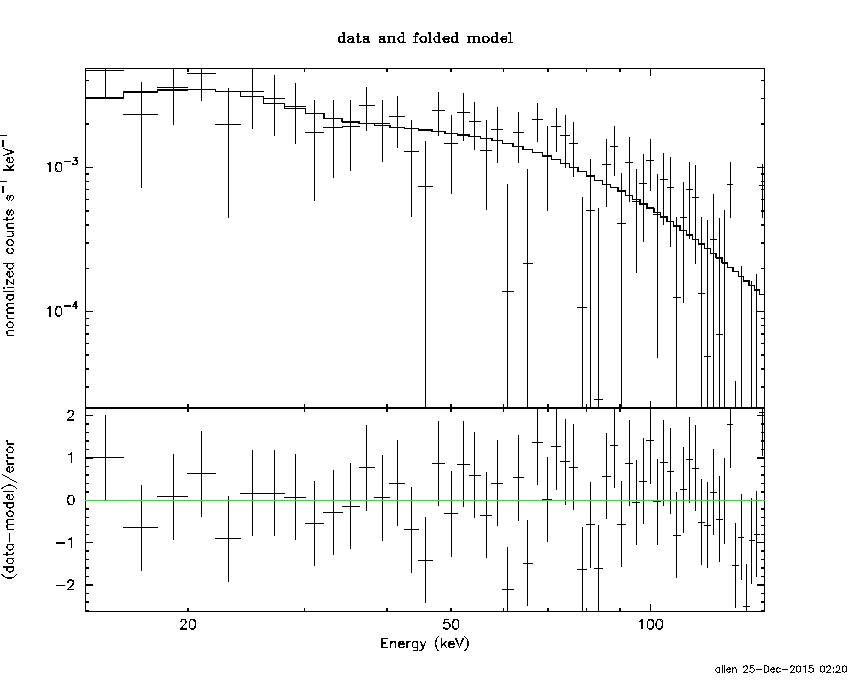
Time-resolved spectra
Distribution
T90 vs. Hardness ratio plot
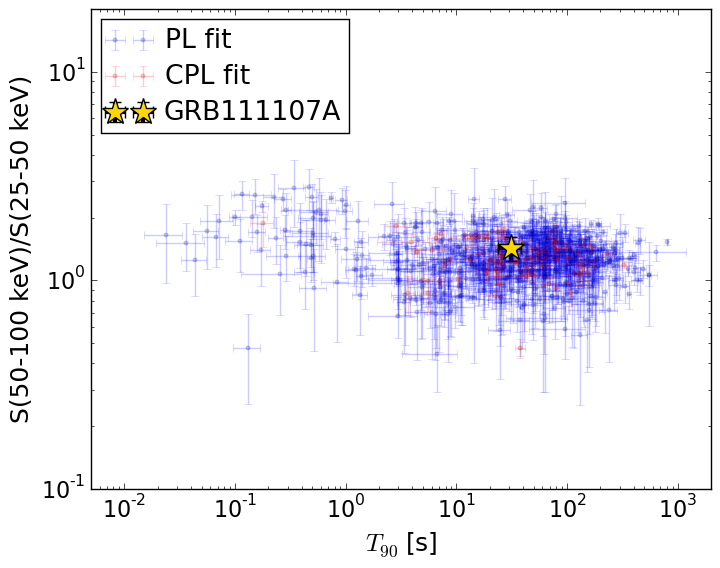
T90                                   = 31.072 sec.
Hardness ratio (energy fluence ratio) = 1.43057331614
S(15-50 keV) vs. S(50-150 keV) plot
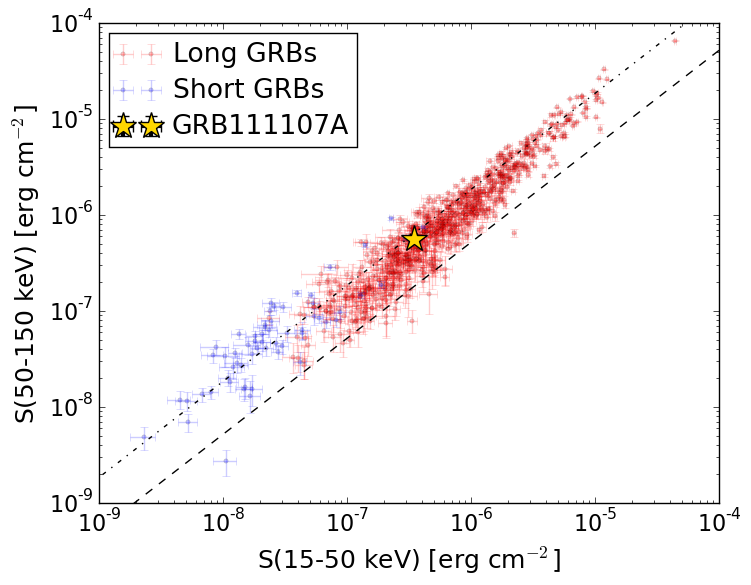
S(15-50 keV)  = 3.443776e-07
S(50-150 keV) = 5.680446e-07
The dash-dotted line and the dashed line traces the fluences calculated from the Band function with Epeak = 15 and 150 keV, respectively. Both lines assume a canonical values of alpha = -1 and beta = -2.5.
Mask shadow pattern
IMX = -1.264382464052418E-01, IMY = 3.802761465076993E-01
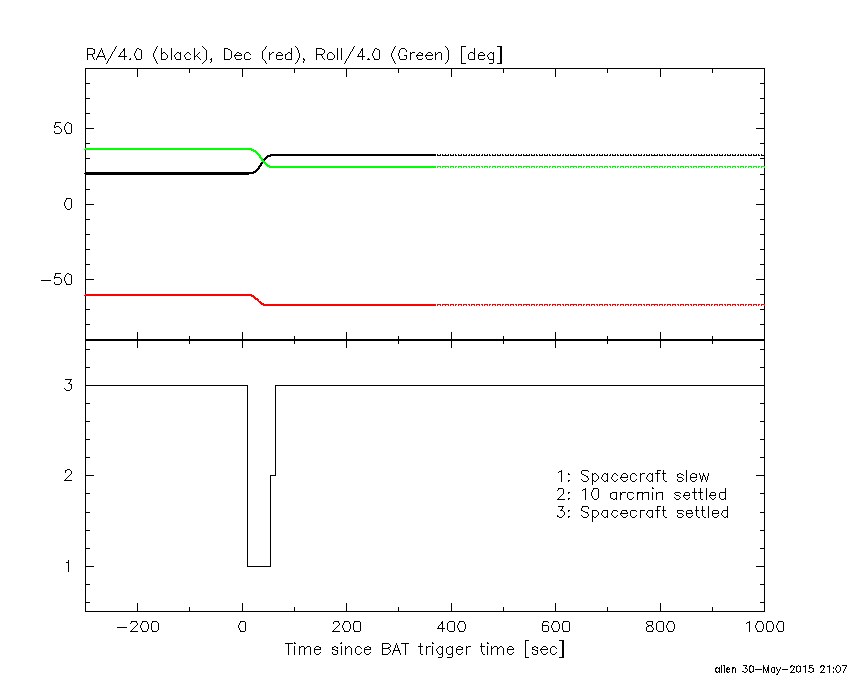
Spacecraft aspect plot
Bright source in the pre-burst/pre-slew/post-slew images
Pre-burst image of 15-350 keV band
Time interval of the image:
-239.552000 -0.096000

# RAcent  DECcent POSerr Theta    Phi  PeakCts   SNR AngSep     Name
#  [deg]    [deg]    ['] [deg]  [deg]                   [']
135.5285 -40.5516    0.9  38.2 -151.4   3.3390  13.4    0.2	Vela X-1
170.4690 -60.7191    9.4  40.5 -104.5   1.1651   1.2    7.3	Cen X-3
 38.2852 -59.8912    2.2  21.1   16.4   0.9807   5.2 ------	UNKNOWN
317.8631 -55.8309    2.2  55.7  -21.0   3.5692   5.3 ------	UNKNOWN
146.6383 -35.1560    3.3  47.9 -146.4   1.4581   3.5 ------	UNKNOWN
277.3610 -70.2728    3.1  49.0  -48.5   3.4795   3.8 ------	UNKNOWN
Pre-slew background subtracted image of 15-350 keV band
Time interval of the image:
-0.096000 10.748590

# RAcent  DECcent POSerr Theta    Phi  PeakCts   SNR AngSep     Name
#  [deg]    [deg]    ['] [deg]  [deg]                   [']
135.5635 -40.7127    5.5  38.1 -151.2   0.1090   2.1    9.6	Vela X-1
170.3460 -60.4921    7.4  40.6 -104.8   0.2187   1.6    7.9	Cen X-3
129.4852 -66.5197    0.5  21.8 -108.4   0.9915  24.7 ------	UNKNOWN
157.1983 -57.8023    2.3  36.9 -114.8   0.3737   5.0 ------	UNKNOWN
148.9944 -32.5026    2.0  51.2 -146.4   0.6269   5.8 ------	UNKNOWN
191.8870 -75.8841    2.3  36.9  -77.9   0.4470   5.1 ------	UNKNOWN
Post-slew image of 15-350 keV band
Time interval of the image:
54.148600 962.552900

# RAcent  DECcent POSerr Theta    Phi  PeakCts   SNR AngSep     Name
#  [deg]    [deg]    ['] [deg]  [deg]                   [']
135.5338 -40.5639    0.6  26.2 -178.0  12.2693  20.3    0.6	Vela X-1
170.3111 -60.6227    0.8  18.7  -97.3   7.9450  13.7    0.1	Cen X-3
186.6369 -62.7714    0.5  23.9  -80.3  14.5545  21.7    0.5	GX 301-2
 48.3677 -61.7643    2.3  33.1   50.2   4.5863   5.1 ------	UNKNOWN
125.2887 -23.7827    2.6  42.8  165.9   4.8326   4.4 ------	UNKNOWN
337.1023 -70.5617    2.9  41.6    4.9   3.3941   3.9 ------	UNKNOWN
 86.1292 -88.9719    3.0  22.7   -6.7   2.1351   3.9 ------	UNKNOWN
148.7780  -8.9281    4.2  59.1 -166.1   9.6301   2.8 ------	UNKNOWN
272.4265 -55.8456    3.6  54.5  -33.0   9.7656   3.2 ------	UNKNOWN