Analysis Summary
Notes:
- 1) No attempt has been made to eliminate the non-significant decimal places.
- 2) This batgrbproduct analysis is done using the HEASARC data.
- 3) This batgrbproduct analysis is using the flight position for the mask-weighting calculation.
======================================================================
                  BAT GRB EVENT DATA PROCESSING REPORT
    Process Script Ver: batgrbproduct v2.46
    Process Start Time: Mon Jan 13 18:21:03 EST 2014
             Host Name: batevent1
   Current Working Dir: /local/data/batevent/batevent_reproc/trigger507342
======================================================================

  Trigger: 00507342      Segment: 000

  BAT Trigger Time: 342500273.6   [s; MET]
      Trigger Stop: 342500277.696   [s; MET]
               UTC: 2011-11-09T02:57:46.046320    [includes UTCF correction]
       Where From?: TDRSS position message

  BAT
    RA: 118.196067983082   Dec: -41.5986755526321  [deg; J2000]

     Catalogged Source?: NO
     Point Source?:      YES
     GRB Indicated?:     YES    [ by BAT flight software ]
     Image S/N Ratio:    8.62
     Image Trigger?:     NO
     Rate S/N Ratio:     13.856406460551  [ if not an image trigger ]
     Image S/N Ratio:    8.62

  Analysis Position:   [ source = BAT ]
    RA: 118.196067983082   Dec: -41.5986755526321  [deg; J2000]

  Refined Position:   [ source = BAT pre-slew burst ]
    RA: 118.247685673307   Dec: -41.588936780625  [deg; J2000]
        { 07h 52m 59.4s , -41d 35' 20.2" }
         +/- 1.92908741729053 [arcmin] (estimated 90% radius based on SNR)
         +/- 0.820417587419659 [arcmin] (formal 1-sigma fit error)
    SNR: 11.8979680043782

  Angular difference between the analysis and refined position is 2.388768 arcmin

  Partial Coding Fraction: 0.9140625    [ including projection effects ]

  Duration
     T90: 13 +/- 3.16227766016838
        Measured from: -5.60000002384186
                   to: 7.39999997615814     [s; relative to TRIGTIME]
     T50: 6 +/- 2.82842712474619
        Measured from: -3.60000002384186
                   to: 2.39999997615814     [s; relative to TRIGTIME]


  Fluence
     Peak Flux  (peak 1 second)
        Measured from: 1.39999997615814
                   to: 2.39999997615814     [s; relative to TRIGTIME]
     Total Fluence
        Measured from: -5.60000002384186
                   to: 8.39999997615814     [s; relative to TRIGTIME]

             Band 1     Band 2     Band 3     Band 4
              15-25      25-50     50-100    100-350     keV
 Total     0.155543   0.197678   0.090641   0.009748
           0.021964   0.022106   0.019480   0.017833 [error]
 Peak      0.027079   0.025092   0.013938   0.003615
           0.006095   0.006118   0.005397   0.004866 [error]

     [ fluence units of on-axis counts / fully illuminated detector ]

======================================================================


====== Table of the duration information =============================

        Value   tstart    tstop
T100   14.000   -5.600    8.400
T90    13.000   -5.600    7.400
T50     6.000   -3.600    2.400
Peak    1.000    1.400    2.400


====== Spectral Analysis Summary =====================================

Model      : spectral model: simple power-law (PL) and cutoff power-law (CPL)
Ph_index   : photon index: E^{Ph_index}
Ph_90err   : 90% error of the photon index
Epeak      : Epeak in keV
Epeak_90err: 90% error of Epeak
Norm       : normalization at 50 keV in both the PL model and CPL model
Nomr_90err : 90% error of the normalization
chi2       : Chi-Squared
dof        : degree of freedo

=== Time-averaged spectral analysis ===
(Best model with acceptable fit: PL)

Model Ph_index Ph_90err_low Ph_90err_hi  Epeak  Epeak_90err_low  Epeak_90err_hi  Norm       Nomr_90err_low    Norm_90err_hi    chi2    dof
PL      -1.856    -0.263      0.249       -           -               -         1.89e-03     -3.30e-04          3.22e-04      57.210   57
CPL     -1.057    -1.057      1.451       47.390     -47.174       -47.390      5.63e-03     -5.63e-03          3.64e-02      55.710   56


=== 1-s peak spectral analysis ===
(Best model with acceptable fit: PL)

Model Ph_index Ph_90err_low Ph_90err_hi  Epeak  Epeak_90err_low  Epeak_90err_hi  Norm       Nomr_90err_low    Norm_90err_hi    chi2    dof
PL      -1.845     -0.511     0.456       -           -               -         3.95e-03     -1.30e-03          1.23e-03      68.080   57
CPL     -1.640     -0.622     2.160       72.646      N/A           N/A         5.22e-03        N/A               N/A         68.030   56


=== Fluence/Peak Flux Summary ===

              Model    Band1     Band2     Band3     Band4     Band5     Total
                       15-25     25-50    50-100    100-350    15-150    15-350    keV
Fluence         PL   4.73e-08  7.00e-08  7.73e-08  1.61e-07  2.43e-07  3.55e-07   erg/cm2
      90%_error_low -9.09e-09 -9.76e-09 -1.79e-08 -6.34e-08 -4.15e-08 -8.54e-08   erg/cm2
      90%_error_hi   9.32e-09  9.74e-09  1.85e-08  8.71e-08  4.29e-08  1.04e-07   erg/cm2
Peak flux       PL   2.27e-01  1.86e-01  1.04e-01  8.51e-02  5.55e-01  6.02e-01   ph/cm2/s
      90%_error_low -7.89e-02 -4.71e-02 -4.27e-02 -5.22e-02 -1.40e-01 -1.57e-01   ph/cm2/s
      90%_error_hi   8.29e-02  4.70e-02  4.43e-02  8.76e-02  1.40e-01  1.60e-01   ph/cm2/s

Fluence        CPL   4.48e-08  7.71e-08  7.26e-08  4.06e-08  2.21e-07  2.35e-07   erg/cm2
      90%_error_low -1.02e-08 -8.70e-09 -2.40e-08 -3.44e-08 -4.58e-08 -5.92e-08   erg/cm2
      90%_error_hi   1.01e-08  1.44e-08  2.13e-08  1.44e-07  5.25e-08  1.46e-07   erg/cm2
Peak flux      CPL   2.23e-01  1.91e-01  1.03e-01  6.12e-02  5.51e-01  5.80e-01   ph/cm2/s
      90%_error_low -8.61e-02     N/A   -4.39e-02 -6.12e-02 -1.40e-01 -1.65e-01   ph/cm2/s
      90%_error_hi   4.39e-02     N/A    4.61e-02  3.76e-02  1.42e-01  1.75e-01   ph/cm2/s

======================================================================
Image
Pre-slew 15.0-350.0 keV image (Event data)

#   RAcent    DECcent   POSerr    Theta     Phi              Peak Cts       SNR   Name
  118.2477   -41.5889   0.0162    16.9931    34.9004         0.5006448     11.898 TRIG_00507342

Foreground time interval of the image:
 -5.600   8.400 (delta_t =  14.000 [sec])
Background time interval of the image:
-239.600  -5.600 (delta_t = 234.000 [sec])
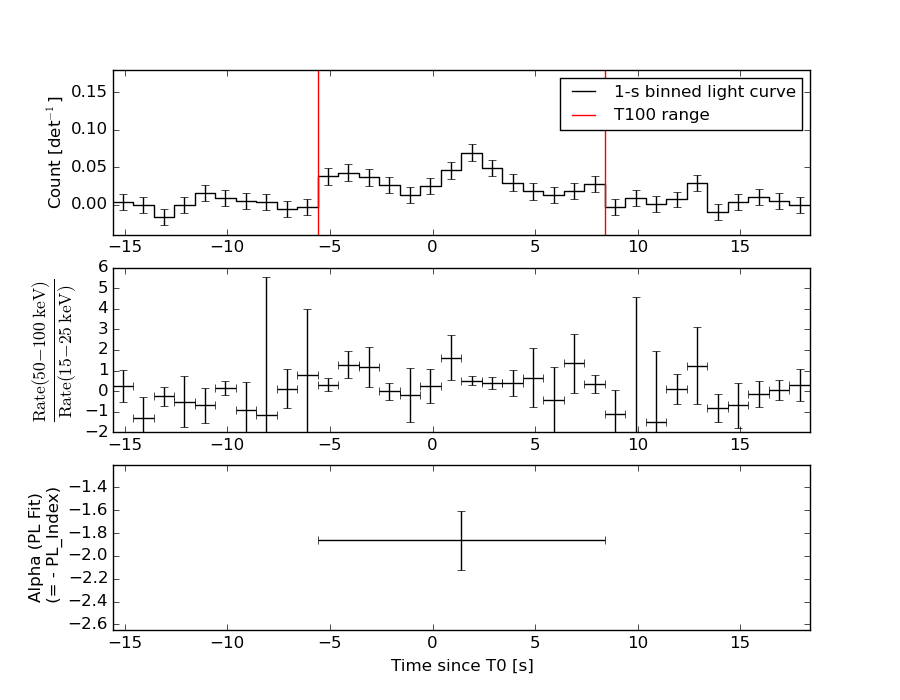
Light Curves
Note: The mask-weighted lightcurves have units of either count/det or counts/sec/det, where a det is 0.4 x 0.4 = 0.16 sq cm.
Full-time range; 1 s binning
Other quick-look light curves:
- 64 ms binning (zoomed)
- 16 ms binning (zoomed)
- 8 ms binning (zoomed)
- 2 ms binning (zoomed)
- SN=5 or 10 s binning (full-time range)
- Raw light curve
Spectra
- 64 ms binning (zoomed)
- 16 ms binning (zoomed)
- 8 ms binning (zoomed)
- 2 ms binning (zoomed)
- SN=5 or 10 s binning (full-time range)
- Raw light curve
Spectra
Notes:
- 1) The fitting includes the systematic errors.
- 2) When the burst includes telescope slew time periods, the fitting uses an average response file made from multiple 5-s response files through out the slew time plus single time preiod for the non-slew times, and weighted by the total counts in the corresponding time period using addrmf. An average response file is needed becuase a spectral fit using the pre-slew DRM will introduce some errors in both a spectral shape and a normalization if the PHA file contains a lot of the slew/post-slew time interval.
- 3) For fits to more complicated models (e.g. a power-law over a cutoff power-law), the BAT team has decided to require a chi-square improvement of more than 6 for each extra dof.
Time averaged spectrum fit using the average DRM
Power-law model
Time interval is from   -5.600 sec. to    8.400 sec.

Spectral model in power-law:
------------------------------------------------------------
Parameters  : value       lower 90%   higher 90%
Photon index: -1.8563     ( -0.263331   0.248692 )
Norm@50keV  : 1.89106E-03    ( -0.000330024   0.000321523 )
------------------------------------------------------------
#Fit statistic : Chi-Squared =          57.21 using 59 PHA bins.
# Reduced chi-squared =          1.004 for     57 degrees of freedom
# Null hypothesis probability =   4.671410e-01

Photon flux (15-150 keV)    in 14 sec: 0.266507 ( -0.036889  0.036889 ) ph/cm2/s
Energy fluence (15-150 keV)             : 2.43454e-07 ( -4.15351e-08  4.29423e-08 ) ergs/cm2
Cutoff power-law model
Time interval is from   -5.600 sec. to    8.400 sec.
Spectral model in the cutoff power-law:
------------------------------------------------------------
Parameters  : value       lower 90%   higher 90%
Photon index: -1.05742     ( -1.05722   1.45052 )
Epeak [keV] : 47.3897      ( -47.1732 -47.3891 )
Norm@50keV  : 5.62933E-03    ( -0.00562973   0.0363801 )
------------------------------------------------------------
#Fit statistic : Chi-Squared =          55.71 using 59 PHA bins.
# Reduced chi-squared =         0.9949 for     56 degrees of freedom
# Null hypothesis probability =   4.856560e-01

Photon flux (15-150 keV)    in 14 sec: 0.258625 ( -0.038137  0.038359 ) ph/cm2/s
Energy fluence (15-150 keV)             : 2.20556e-07 ( -4.58419e-08  5.25228e-08 ) ergs/cm2
1-s peak spectrum fit
Power-law model

Time interval is from    1.400 sec. to    2.400 sec.

Spectral model in power-law:
------------------------------------------------------------
Parameters  : value       lower 90%   higher 90%
Photon index: -1.84504     ( -0.510966   0.455955 )
Norm@50keV  : 3.95497E-03    ( -0.00130033   0.00122933 )
------------------------------------------------------------
#Fit statistic : Chi-Squared =          68.08 using 59 PHA bins.
# Reduced chi-squared =          1.194 for     57 degrees of freedom
# Null hypothesis probability =   1.494907e-01

Photon flux (15-150 keV)    in 1 sec: 0.554826 ( -0.139679  0.139685 ) ph/cm2/s
Energy fluence (15-150 keV)             : 3.63739e-08 ( -1.1352e-08  1.20478e-08 ) ergs/cm2
Cutoff power-law model
Time interval is from    1.400 sec. to    2.400 sec.
Spectral model in the cutoff power-law:
------------------------------------------------------------
Parameters  : value       lower 90%   higher 90%
Photon index: -1.64002     ( -0.621954   2.1604 )
Epeak [keV] : 72.6463      (   )
Norm@50keV  : 5.22281E-03    (     )
------------------------------------------------------------
#Fit statistic : Chi-Squared =          68.03 using 59 PHA bins.
# Reduced chi-squared =          1.215 for     56 degrees of freedom
# Null hypothesis probability =   1.300496e-01

Photon flux (15-150 keV)    in 1 sec: 0.551144 ( -0.140324  0.141586 ) ph/cm2/s
Energy fluence (15-150 keV)             : 3.54585e-08 ( -1.26109e-08  1.12956e-08 ) ergs/cm2
Time-resolved spectra
Distribution
T90 vs. Hardness ratio plot
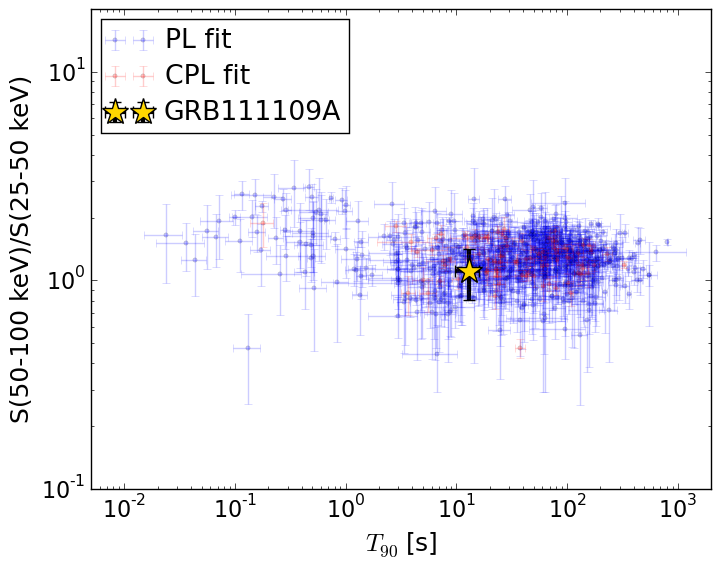
T90                                   = 13.0 sec.
Hardness ratio (energy fluence ratio) = 1.10479076494
S(15-50 keV) vs. S(50-150 keV) plot
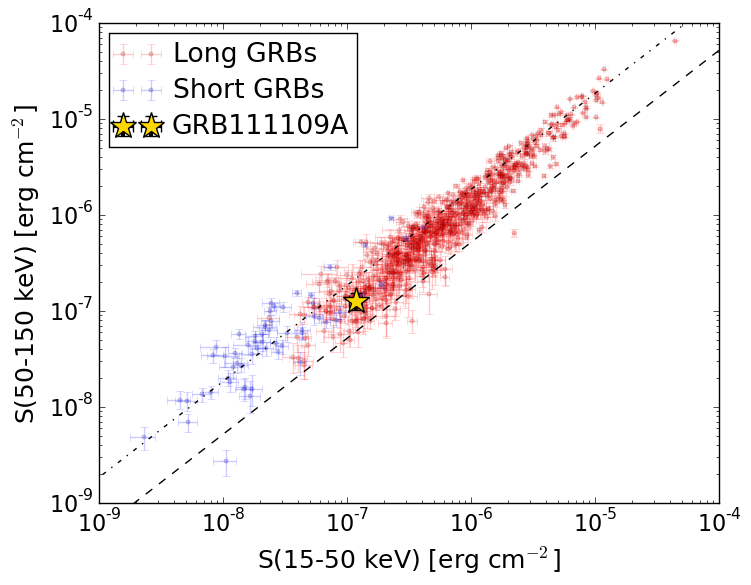
S(15-50 keV)  = 1.1724844e-07
S(50-150 keV) = 1.2620783e-07
The dash-dotted line and the dashed line traces the fluences calculated from the Band function with Epeak = 15 and 150 keV, respectively. Both lines assume a canonical values of alpha = -1 and beta = -2.5.
Mask shadow pattern

IMX = 2.506366746392414E-01, IMY = -1.748493670789323E-01
Spacecraft aspect plot
Bright source in the pre-burst/pre-slew/post-slew images
Pre-burst image of 15-350 keV band
Time interval of the image:
-239.600000 -5.600000

# RAcent  DECcent POSerr Theta    Phi  PeakCts   SNR AngSep     Name
#  [deg]    [deg]    ['] [deg]  [deg]                   [']
135.5126 -40.5483    1.2   8.2  -13.5   2.0397  10.0    0.8	Vela X-1
170.2622 -60.5856    2.0  35.9  -45.2   1.7150   5.6    2.7	Cen X-3
186.6556 -62.7183    5.3  43.7  -48.0   1.1526   2.2    3.1	GX 301-2
114.3120 -32.2557    2.4  18.5   67.3   1.1019   4.8 ------	UNKNOWN
 96.2382 -66.7674    2.6  41.6    5.2   1.4109   4.5 ------	UNKNOWN
 92.5749 -78.8272    2.9  49.9   -7.2   1.8138   4.0 ------	UNKNOWN
150.6959 -50.3127    3.1  20.9  -43.9   0.7442   3.8 ------	UNKNOWN
169.5947  16.9877    3.4  58.8 -159.3   4.7582   3.4 ------	UNKNOWN
Pre-slew background subtracted image of 15-350 keV band
Time interval of the image:
-5.600000 8.400000

# RAcent  DECcent POSerr Theta    Phi  PeakCts   SNR AngSep     Name
#  [deg]    [deg]    ['] [deg]  [deg]                   [']
135.2819 -40.6525   21.9   8.3  -12.3   0.0212   0.5   12.7	Vela X-1
170.2358 -60.4923   27.9  35.8  -45.3  -0.0242  -0.4    8.2	Cen X-3
186.5070 -62.7333    7.3  43.7  -47.9   0.1573   1.6    4.7	GX 301-2
 72.2043 -55.5630    2.4  49.4   24.8   0.7781   4.7 ------	UNKNOWN
118.2477 -41.5889    1.0  17.0   34.9   0.5006  11.9 ------	UNKNOWN
156.3569  17.9217    1.9  53.9 -173.3   0.7014   6.0 ------	UNKNOWN
Post-slew image of 15-350 keV band
Time interval of the image:
243.300610 546.300630

# RAcent  DECcent POSerr Theta    Phi  PeakCts   SNR AngSep     Name
#  [deg]    [deg]    ['] [deg]  [deg]                   [']
244.9823 -15.6296    0.2  29.0  -72.6  31.9594  64.0    0.7	Sco X-1
254.3040  35.4095    4.3  55.1    0.0   4.3188   2.7    8.5	Her X-1
256.2074 -37.9358    5.8  27.5 -125.6   0.9156   2.0   11.8	4U 1700-377
256.5154 -36.3905    3.8  26.2 -123.6   1.3660   3.1    4.3	GX 349+2
262.8176 -24.6435   15.4  14.4 -107.8   0.2718   0.7   12.1	GX 1+4
264.7714 -44.4631    6.9  29.7 -144.2   0.6836   1.7    1.5	4U 1735-44
268.3120  -1.4613    5.3  16.1   -4.8   0.7013   2.2    3.4	SW J1753.5-0127
270.2850 -25.1467    6.1  10.2 -133.3   0.7689   1.9    4.0	GX 5-1
270.2008 -25.9303    8.4  10.9 -134.9   0.5671   1.4   12.5	GRS 1758-258
274.0519 -14.0346    1.9   2.3   -7.7   2.1894   6.0    2.7	GX 17+2
275.7846 -30.3041    4.8  14.3 -161.4   0.7597   2.4    8.2	H1820-303
284.9244 -25.0555    7.6  12.8  156.9   0.4729   1.5   10.1	HT1900.1-2455
288.8077  10.9608    1.5  30.2   48.1   3.9739   7.5    1.1	GRS 1915+105
262.9547 -33.8995    2.3  21.0 -129.8   1.9083   4.9    4.2	GX 354-0
302.3189  -5.1262    2.8  28.8   91.4   2.4452   4.2 ------	UNKNOWN
269.8776  33.3409    2.6  49.7   14.9   4.2569   4.5 ------	UNKNOWN
276.5964  -9.3641    3.3   6.8   32.6   1.0798   3.6 ------	UNKNOWN
293.9929 -50.9288    2.7  38.0 -178.5   2.1082   4.4 ------	UNKNOWN
253.6981 -45.8593    2.4  34.8 -132.7   2.3883   4.7 ------	UNKNOWN
241.1350  -9.8269    3.0  33.7  -62.9   2.1559   3.8 ------	UNKNOWN
251.9772 -71.3095    2.3  57.0 -150.6   9.9105   4.9 ------	UNKNOWN