Analysis Summary
Notes:
- 1) No attempt has been made to eliminate the non-significant decimal places.
- 2) This batgrbproduct analysis is done using the HEASARC data.
- 3) This batgrbproduct analysis is using the flight position for the mask-weighting calculation.
==========================================================================
           BAT GROUND-DETECTED GRB DATA PROCESSING REPORT
            (This burst occurred during telescope slew)
    Process Script Ver: batgrbproduct v2.46
    Process Start Time: Mon Mar 23 21:48:16 EDT 2015
             Host Name: bat1
   Current Working Dir: /local/data/bat1/alien/Swift_3rdBATcatalog/event/batevent_reproc/GRB111126A
======================================================================

  Trigger: 00048079      Segment: 001

  BAT Trigger Time: 344026670.796
               UTC: 2011-11-26T18:57:43.182   [includes UTCF correction]
       Where From?: Ground analysis (best_duration.txt)
  NOTE: BAT trigger time for ground-detected burst during slew is the T100 start time.

  Refined Position:   [ source = BAT mosaic image ]
    RA: 276.029547698203   Dec: 51.4683728140965  [deg; J2000]
        { 18h 24m 07.1s , +51d 28' 06.1" }
        +/- 2.47271567058 [arcmin] (estimated 90% radius based on SNR)
    SNR: 8.34637312641


  Angular difference between the analysis and refined position is Usage: arcmin

  Partial Coding Fraction: Unavailable because the burst occurred during slew.

  Duration
     T90: 0.671999931335449 +/- 0.0393954323691675
        Measured from: 0.00800002
                   to: 0.68     [s; relative to TRIGTIME]
     T50: 0.551999926567078 +/- 0.33604763049332
        Measured from: 0.056
                   to: 0.608     [s; relative to TRIGTIME]


====== Table of the duration information =============================

        Value   tstart    tstop
T100    0.712    0.000    0.712
T90     0.672    0.008    0.680
T50     0.552    0.056    0.608
Peak    1.000   -0.144    0.856


====== Spectral Analysis Summary =====================================

Model      : spectral model: simple power-law (PL) and cutoff power-law (CPL)
Ph_index   : photon index: E^{Ph_index}
Ph_90err   : 90% error of the photon index
Epeak      : Epeak in keV
Epeak_90err: 90% error of Epeak
Norm       : normalization at 50 keV in both the PL model and CPL model
Nomr_90err : 90% error of the normalization
chi2       : Chi-Squared
dof        : degree of freedo

=== Time-averaged spectral analysis ===
(Best model with acceptable fit: PL)

Model Ph_index Ph_90err_low Ph_90err_hi  Epeak  Epeak_90err_low  Epeak_90err_hi  Norm       Nomr_90err_low    Norm_90err_hi    chi2    dof
PL      -1.040    -0.299      0.312       -           -               -         8.81e-03     -1.40e-03          1.40e-03      62.570   57
CPL     -1.039    -0.297      0.319     9999.360    -9999.360      -9999.360      8.86e-03     -1.41e-03          1.41e-03      62.590   56


=== 1-s peak spectral analysis ===
(Best model with acceptable fit: N/A)

Model Ph_index Ph_90err_low Ph_90err_hi  Epeak  Epeak_90err_low  Epeak_90err_hi  Norm       Nomr_90err_low    Norm_90err_hi    chi2    dof
PL      -1.188     -0.334     0.344       -           -               -         6.27e-03     -1.14e-03          1.14e-03      71.290   57
CPL     -1.193     -0.327     0.355     9999.350    -9999.350      -9999.350      6.29e-03     -1.15e-03          1.01e-02      71.300   56


=== Fluence/Peak Flux Summary ===

              Model    Band1     Band2     Band3     Band4     Band5     Total
                       15-25     25-50    50-100    100-350    15-150    15-350    keV
Fluence         PL   5.21e-09  1.27e-08  2.47e-08  1.19e-07  6.69e-08  1.61e-07   erg/cm2
      90%_error_low -1.63e-09 -2.46e-09 -4.79e-09 -4.56e-08 -1.22e-08 -4.92e-08   erg/cm2
      90%_error_hi   1.79e-09  2.36e-09  4.67e-09  6.42e-08  1.24e-08  6.57e-08   erg/cm2
Peak flux       PL   1.91e-01  2.32e-01  2.04e-01  3.07e-01  7.34e-01  9.34e-01   ph/cm2/s
      90%_error_low -6.40e-02 -4.93e-02 -4.58e-02 -1.26e-01 -1.35e-01 -1.83e-01   ph/cm2/s
      90%_error_hi   6.99e-02  4.76e-02  4.47e-02  1.76e-01  1.35e-01  1.94e-01   ph/cm2/s

Fluence        CPL   5.21e-09  1.25e-08  2.42e-08  1.20e-07  6.73e-08  1.50e-07   erg/cm2
      90%_error_low -1.64e-09 -3.36e-09 -6.23e-09 -7.79e-08    N/A    -6.43e-08   erg/cm2
      90%_error_hi   1.78e-09  3.57e-09  7.10e-09  6.46e-08    N/A     7.47e-08   erg/cm2
Peak flux      CPL   1.95e-01  2.32e-01  2.02e-01  3.05e-01  7.39e-01  9.37e-01   ph/cm2/s
      90%_error_low     N/A   -4.95e-02 -4.49e-02     N/A       N/A   -2.47e-01   ph/cm2/s
      90%_error_hi      N/A    4.89e-02  4.65e-02     N/A       N/A    1.71e-01   ph/cm2/s

======================================================================
Image
Note1: The mosaic image is made with timebin = 0.05 s; energybin = 15-350 keV
Note2: The mosaic image uses Galactic coordinate.
#RAcent DECcent POSerr Theta  Phi  Peak_Cts  SNR Name
276.030 51.468 0.008 24.902 -110.619 0.122 8.346 UNKNOWN

Image time interval: 0.000 to 0.712 [sec]
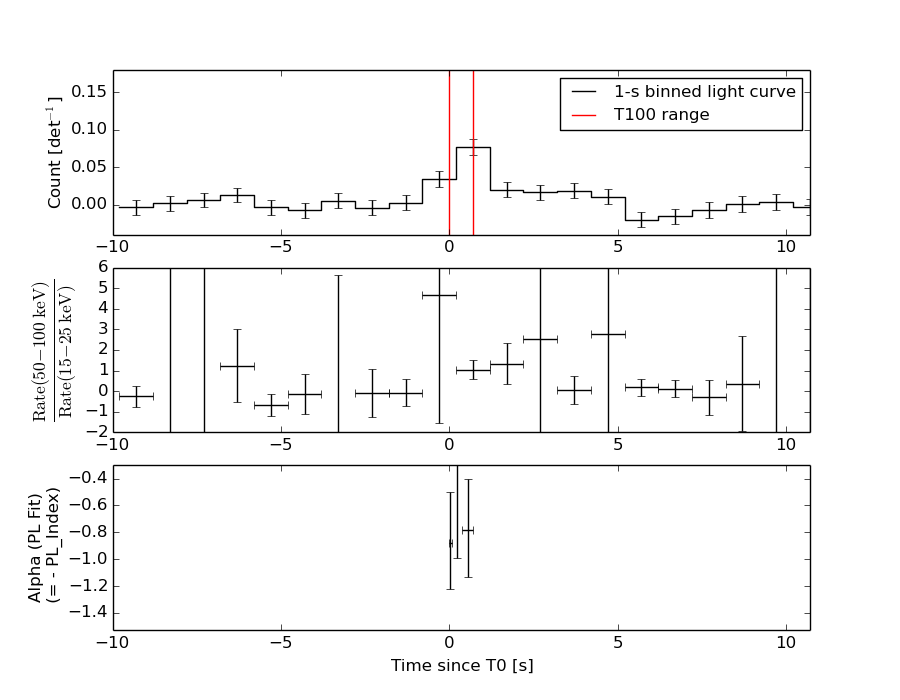
Light Curves
Note: The mask-weighted lightcurves have units of either count/det or counts/sec/det, where a det is 0.4 x 0.4 = 0.16 sq cm.
Best duration plot
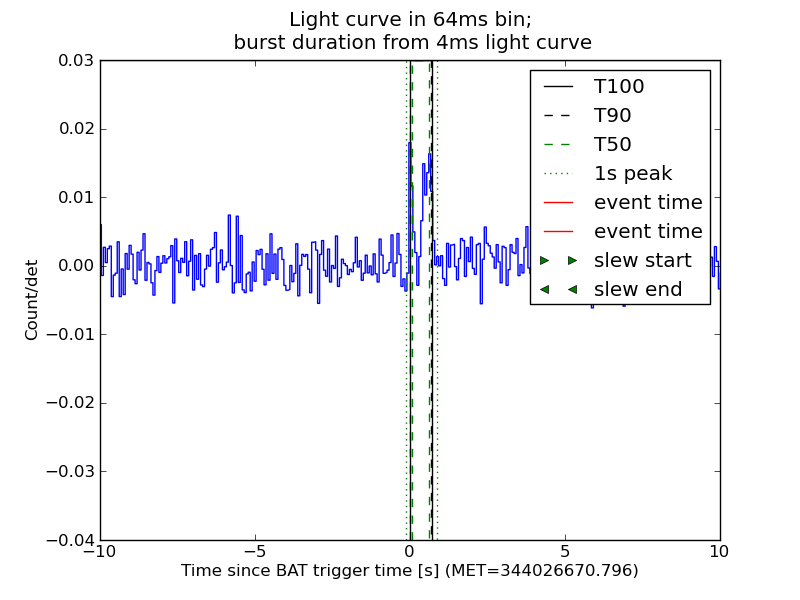
Full-time range; 1 s binning
Other quick-look light curves:
- 64 ms binning (zoomed)
- 16 ms binning (zoomed)
- 8 ms binning (zoomed)
- 2 ms binning (zoomed)
- SN=5 or 10 s binning (full-time range)
- Raw light curve
Spectra
- 64 ms binning (zoomed)
- 16 ms binning (zoomed)
- 8 ms binning (zoomed)
- 2 ms binning (zoomed)
- SN=5 or 10 s binning (full-time range)
- Raw light curve
Spectra
Notes:
- 1) The fitting includes the systematic errors.
- 2) When the burst includes telescope slew time periods, the fitting uses an average response file made from multiple 5-s response files through out the slew time plus single time preiod for the non-slew times, and weighted by the total counts in the corresponding time period using addrmf. An average response file is needed becuase a spectral fit using the pre-slew DRM will introduce some errors in both a spectral shape and a normalization if the PHA file contains a lot of the slew/post-slew time interval.
- 3) For fits to more complicated models (e.g. a power-law over a cutoff power-law), the BAT team has decided to require a chi-square improvement of more than 6 for each extra dof.
Time averaged spectrum fit using the average DRM
Power-law model
Time interval is from    0.000 sec. to    0.712 sec.

Spectral model in power-law:
------------------------------------------------------------
Parameters  : value       lower 90%   higher 90%
Photon index: -1.03954     ( -0.299295   0.312496 )
Norm@50keV  : 8.80822E-03    ( -0.00140328   0.00140203 )
------------------------------------------------------------
#Fit statistic : Chi-Squared =          62.57 using 59 PHA bins.
# Reduced chi-squared =          1.098 for     57 degrees of freedom
# Null hypothesis probability =   2.850734e-01

Photon flux (15-150 keV)    in 0.712 sec: 1.01655 ( -0.164297  0.16468 ) ph/cm2/s
Energy fluence (15-150 keV)             : 6.68975e-08 ( -1.22236e-08  1.23891e-08 ) ergs/cm2
Cutoff power-law model
Time interval is from    0.000 sec. to    0.712 sec.
Spectral model in the cutoff power-law:
------------------------------------------------------------
Parameters  : value       lower 90%   higher 90%
Photon index: -1.03862     ( -0.297256   0.318641 )
Epeak [keV] : 9999.36      ( -9999.36 -9999.36 )
Norm@50keV  : 8.85839E-03    ( -0.00140731   0.00140831 )
------------------------------------------------------------
#Fit statistic : Chi-Squared =          62.59 using 59 PHA bins.
# Reduced chi-squared =          1.118 for     56 degrees of freedom
# Null hypothesis probability =   2.538394e-01

Photon flux (15-150 keV)    in 0.712 sec: 1.01632 ( -0.164441  0.16458 ) ph/cm2/s
Energy fluence (15-150 keV)             : 6.72713e-08 ( 0  0 ) ergs/cm2
1-s peak spectrum fit
Power-law model
Time interval is from   -0.144 sec. to    0.856 sec.

Spectral model in power-law:
------------------------------------------------------------
Parameters  : value       lower 90%   higher 90%
Photon index: -1.18795     ( -0.334123   0.344485 )
Norm@50keV  : 6.26712E-03    ( -0.00114236   0.00114017 )
------------------------------------------------------------
#Fit statistic : Chi-Squared =          71.29 using 59 PHA bins.
# Reduced chi-squared =          1.251 for     57 degrees of freedom
# Null hypothesis probability =   9.648203e-02

Photon flux (15-150 keV)    in 1 sec: 0.734412 ( -0.134748  0.135016 ) ph/cm2/s
Energy fluence (15-150 keV)             : 6.38087e-08 ( -1.34215e-08  1.36785e-08 ) ergs/cm2
Cutoff power-law model
Time interval is from   -0.144 sec. to    0.856 sec.
Spectral model in the cutoff power-law:
------------------------------------------------------------
Parameters  : value       lower 90%   higher 90%
Photon index: -1.19251     ( -0.32805   0.35468 )
Epeak [keV] : 9999.35      ( -9999.36 -9999.36 )
Norm@50keV  : 6.29336E-03    ( -0.0011467   0.0100751 )
------------------------------------------------------------
#Fit statistic : Chi-Squared =          71.30 using 59 PHA bins.
# Reduced chi-squared =          1.273 for     56 degrees of freedom
# Null hypothesis probability =   8.170985e-02

Photon flux (15-150 keV)    in 1 sec: 0.739362 (    ) ph/cm2/s
Energy fluence (15-150 keV)             : 6.48724e-08 ( -1.46104e-08  1.23459e-08 ) ergs/cm2
Time-resolved spectra
Distribution
T90 vs. Hardness ratio plot
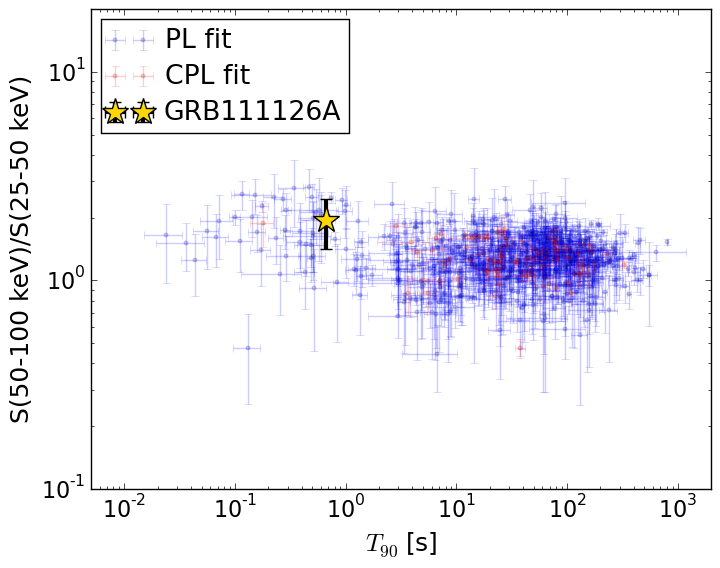
T90                                   = 0.6719999 sec.
Hardness ratio (energy fluence ratio) = 1.94594231078
S(15-50 keV) vs. S(50-150 keV) plot
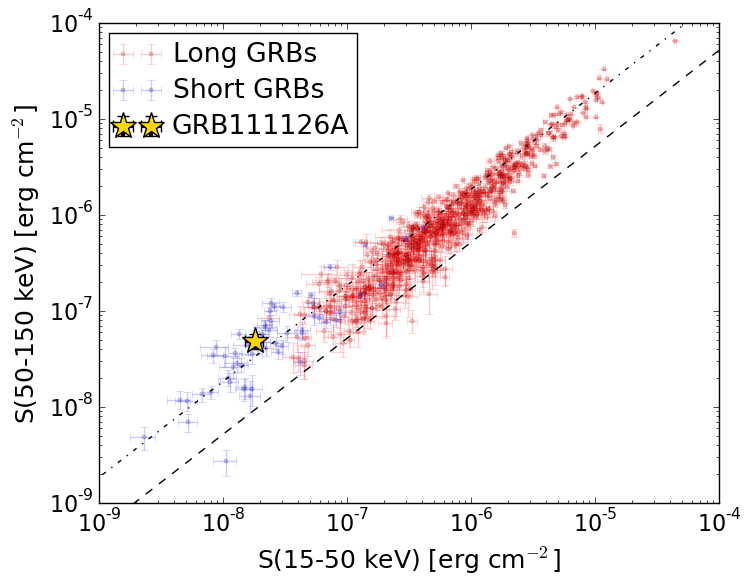
S(15-50 keV)  = 1.7925467e-08
S(50-150 keV) = 4.897205e-08
The dash-dotted line and the dashed line traces the fluences calculated from the Band function with Epeak = 15 and 150 keV, respectively. Both lines assume a canonical values of alpha = -1 and beta = -2.5.
Mask shadow pattern
Mask shadow pattern unavailable because this burst occurs during telescope slews.Spacecraft aspect plot