Analysis Summary
Notes:
- 1) No attempt has been made to eliminate the non-significant decimal places.
- 2) This batgrbproduct analysis is done using the HEASARC data.
- 3) This batgrbproduct analysis is using the flight position for the mask-weighting calculation.
==========================================================================
           BAT GROUND-DETECTED GRB DATA PROCESSING REPORT
    Process Script: hand-made scripts that follow steps in batgrbproduct
                    but without using TDRSS info
    Process Start Time: Mon Sep 29 23:58:16 EDT 2014
             Host Name: bat1
   Current Working Dir: /local/data/bat1/alien/Swift_3rdBATcatalog/event/ground_detect_bursts/scripts
==========================================================================

  BAT Trigger Time: 344442169.6
               UTC: 2011-12-01T14:22:41.969   [includes UTCF correction]
       Where From?: Ground analysis (best_duration.txt)
  NOTE: BAT trigger time for ground-detected burst is the T100 start time.

  Refined Position:   [ source = BAT pre-slew image ]
    RA: 190.486350489   Dec: 32.9936753105  [deg; J2000]
        { 12h 41m 56.7s , +32d 59' 37.2" }
        +/- 1.94741615116 [arcmin] (estimated 90% radius based on SNR)
    SNR: 11.7398533684


  Angular difference between the analysis and refined position is Usage: arcmin

  Partial Coding Fraction: 2.812500e-01    [ including projection effects ]

  Duration
     T90: 20.8000000119209 +/- 1.6
        Measured from: 0
                   to: 20.8     [s; relative to TRIGTIME]
     T50: 11.2000000476837 +/- 1.6
        Measured from: 4.8
                   to: 16     [s; relative to TRIGTIME]


====== Table of the duration information =============================

        Value   tstart    tstop
T100   20.800    0.000   20.800
T90    20.800    0.000   20.800
T50    11.200    4.800   16.000
Peak    1.000    1.900    2.900


====== Spectral Analysis Summary =====================================

Model      : spectral model: simple power-law (PL) and cutoff power-law (CPL)
Ph_index   : photon index: E^{Ph_index}
Ph_90err   : 90% error of the photon index
Epeak      : Epeak in keV
Epeak_90err: 90% error of Epeak
Norm       : normalization at 50 keV in both the PL model and CPL model
Nomr_90err : 90% error of the normalization
chi2       : Chi-Squared
dof        : degree of freedo

=== Time-averaged spectral analysis ===
(Best model with acceptable fit: PL)

Model Ph_index Ph_90err_low Ph_90err_hi  Epeak  Epeak_90err_low  Epeak_90err_hi  Norm       Nomr_90err_low    Norm_90err_hi    chi2    dof
PL      -1.670    -0.298      0.287       -           -               -         5.05e-03     -8.24e-04          7.97e-04      62.440   57
CPL     -1.680    -0.341     -0.306     9999.360      N/A           N/A         5.05e-03        N/A               N/A         62.450   56


=== 1-s peak spectral analysis ===
(Best model with acceptable fit: N/A)

Model Ph_index Ph_90err_low Ph_90err_hi  Epeak  Epeak_90err_low  Epeak_90err_hi  Norm       Nomr_90err_low    Norm_90err_hi    chi2    dof
PL      -1.127     -1.268     1.127       -           -               -         5.23e-03     -5.23e-03          2.38e-03      51.410   57
CPL     -1.190      1.190     1.104     9999.340      N/A           N/A         5.29e-03        N/A               N/A         51.440   56


=== Fluence/Peak Flux Summary ===

              Model    Band1     Band2     Band3     Band4     Band5     Total
                       15-25     25-50    50-100    100-350    15-150    15-350    keV
Fluence         PL   7.19e-08  1.19e-07  1.50e-07  3.75e-07  4.45e-07  7.15e-07   erg/cm2
      90%_error_low -1.76e-08 -1.78e-08 -3.37e-08 -1.53e-07 -7.62e-08 -1.86e-07   erg/cm2
      90%_error_hi   1.85e-08  1.76e-08  3.32e-08  2.13e-07  7.73e-08  2.33e-07   erg/cm2
Peak flux       PL   1.48e-01  1.88e-01  1.74e-01  2.83e-01  6.05e-01  7.91e-01   ph/cm2/s
      90%_error_low -1.48e-01 -1.88e-01 -1.07e-01 -2.83e-01 -6.05e-01 -3.57e-01   ph/cm2/s
      90%_error_hi   2.32e-01  1.21e-01  8.24e-02  2.28e+00  3.18e-01  1.85e+00   ph/cm2/s

Fluence        CPL   6.55e-08  8.63e-08  8.71e-08  1.95e-07  2.93e-07  4.35e-07   erg/cm2
      90%_error_low -2.25e-08 -2.88e-08 -2.78e-08    N/A       N/A       N/A      erg/cm2
      90%_error_hi   2.11e-08  2.49e-08  2.13e-08    N/A       N/A       N/A      erg/cm2
Peak flux      CPL   1.55e-01  1.93e-01  1.72e-01  2.64e-01  6.12e-01  7.90e-01   ph/cm2/s
      90%_error_low     N/A       N/A       N/A       N/A       N/A       N/A     ph/cm2/s
      90%_error_hi      N/A       N/A       N/A       N/A       N/A       N/A     ph/cm2/s

======================================================================
Image
15.0-350.0 keV image (Event data)
#RAcent DECcent POSerr Theta  Phi  Peak_Cts  SNR Name
190.486 32.994 0.016 36.532 39.805 0.796 11.740 TRIG_00508800

Image time interval: -0.600 to 9.498 [sec]
Light Curves
Note: The mask-weighted lightcurves have units of either count/det or counts/sec/det, where a det is 0.4 x 0.4 = 0.16 sq cm.
Best duration plot

Full-time range; 1 s binning
Other quick-look light curves:
Spectra
Notes:
- 1) The fitting includes the systematic errors.
- 2) When the burst includes telescope slew time periods, the fitting uses an average response file made from multiple 5-s response files through out the slew time plus single time preiod for the non-slew times, and weighted by the total counts in the corresponding time period using addrmf. An average response file is needed becuase a spectral fit using the pre-slew DRM will introduce some errors in both a spectral shape and a normalization if the PHA file contains a lot of the slew/post-slew time interval.
- 3) For fits to more complicated models (e.g. a power-law over a cutoff power-law), the BAT team has decided to require a chi-square improvement of more than 6 for each extra dof.
Time averaged spectrum fit using the average DRM
Power-law model
Time interval is from    0.000 sec. to    9.498 sec.

Spectral model in power-law:
------------------------------------------------------------
Parameters  : value       lower 90%   higher 90%
Photon index: -1.66981     ( -0.298192   0.287146 )
Norm@50keV  : 5.05147E-03    ( -0.000824046   0.000796622 )
------------------------------------------------------------
#Fit statistic : Chi-Squared =          62.44 using 59 PHA bins.
# Reduced chi-squared =          1.095 for     57 degrees of freedom
# Null hypothesis probability =   2.891309e-01

Photon flux (15-150 keV)    in 9.498 sec: 0.663997 ( -0.098622  0.09878 ) ph/cm2/s
Energy fluence (15-150 keV)             : 4.45432e-07 ( -7.61981e-08  7.73152e-08 ) ergs/cm2
Cutoff power-law model
Time interval is from    0.000 sec. to    9.498 sec.
Spectral model in the cutoff power-law:
------------------------------------------------------------
Parameters  : value       lower 90%   higher 90%
Photon index: -2.01724     ( -0.00388965   0.0314367 )
Epeak [keV] : 7.18149      (   )
Norm@50keV  : 3.20660E-03    (     )
------------------------------------------------------------
#Fit statistic : Chi-Squared =          61.15 using 59 PHA bins.
# Reduced chi-squared =          1.092 for     56 degrees of freedom
# Null hypothesis probability =   2.964143e-01

Photon flux (15-150 keV)    in 9.498 sec: 0.498189 (    ) ph/cm2/s
Energy fluence (15-150 keV)             : 2.93368e-07 ( 0  0 ) ergs/cm2
1-s peak spectrum fit
Power-law model
Time interval is from    1.900 sec. to    2.900 sec.

Spectral model in power-law:
------------------------------------------------------------
Parameters  : value       lower 90%   higher 90%
Photon index: -1.1272     ( -1.27631   1.11876 )
Norm@50keV  : 5.22603E-03    ( -0.00521569   0.00238973 )
------------------------------------------------------------
#Fit statistic : Chi-Squared =          51.41 using 59 PHA bins.
# Reduced chi-squared =         0.9020 for     57 degrees of freedom
# Null hypothesis probability =   6.838042e-01

Photon flux (15-150 keV)    in 1 sec: 0.604858 ( -0.604858  0.318195 ) ph/cm2/s
Energy fluence (15-150 keV)             : 5.43676e-08 ( -2.74721e-08  2.61406e-08 ) ergs/cm2
Cutoff power-law model
Time interval is from    1.900 sec. to    2.900 sec.
Spectral model in the cutoff power-law:
------------------------------------------------------------
Parameters  : value       lower 90%   higher 90%
Photon index: -2.47819     ( 2.47974   2.39352 )
Epeak [keV] : 160.450      (   )
Norm@50keV  : 1.41016E-03    (     )
------------------------------------------------------------
#Fit statistic : Chi-Squared =          50.66 using 59 PHA bins.
# Reduced chi-squared =         0.9046 for     56 degrees of freedom
# Null hypothesis probability =   6.766248e-01

Photon flux (15-150 keV)    in 1 sec: 0.612396 (    ) ph/cm2/s
Energy fluence (15-150 keV)             : 2.1425e-08 ( 0  0 ) ergs/cm2
Time-resolved spectra

Distribution
T90 vs. Hardness ratio plot
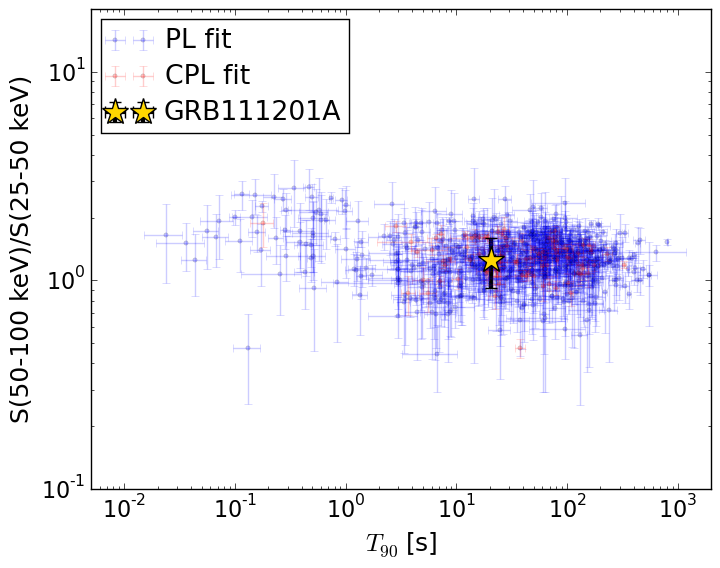
T90                                   = 20.8 sec.
Hardness ratio (energy fluence ratio) = 1.25718665093
S(15-50 keV) vs. S(50-150 keV) plot
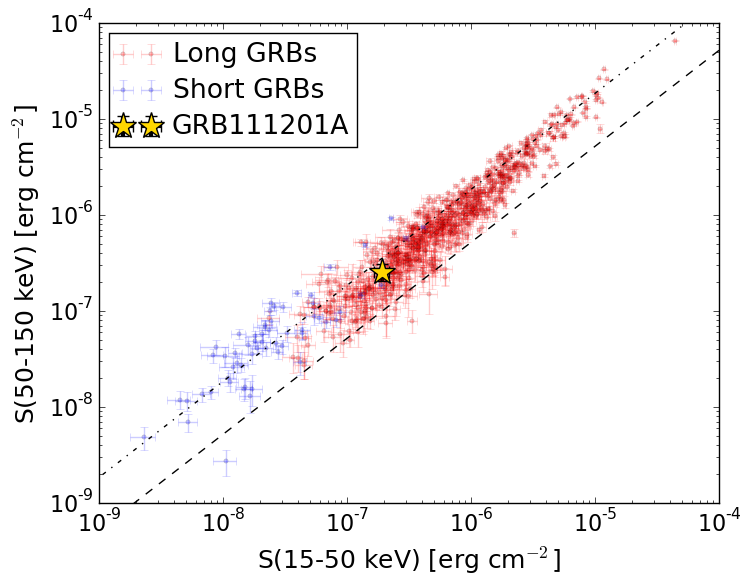
S(15-50 keV)  = 1.9092698e-07
S(50-150 keV) = 2.545034e-07
The dash-dotted line and the dashed line traces the fluences calculated from the Band function with Epeak = 15 and 150 keV, respectively. Both lines assume a canonical values of alpha = -1 and beta = -2.5.
Mask shadow pattern
IMX = 0.56912131908, IMY = -0.474263750261
Spacecraft aspect plot

Bright source in the event data image
Event data image of 15-350 keV band
Time interval of the image:
-0.600000 9.497700

# RAcent  DECcent POSerr Theta    Phi  PeakCts   SNR AngSep     Name
#  [deg]    [deg]    ['] [deg]  [deg]                   [']
245.0059 -15.7023    2.9  40.8  -97.6   0.5764   4.0    4.0	Sco X-1
254.2630  35.4762    5.7  24.5  157.0   0.0804   2.0   12.4	Her X-1
268.3883  -1.3337    6.3  44.1 -138.1   0.1224   1.8    7.2	SW J1753.5-0127
288.8274  10.8830    4.2  56.9 -164.2   0.3872   2.7    4.1	GRS 1915+105
190.4864  32.9936    1.0  36.5   39.8   0.7963  11.7 ------	UNKNOWN
Webpage updated on:
Sun Jun 21 01:10:42 EDT 2015