Analysis Summary
Notes:
- 1) No attempt has been made to eliminate the non-significant decimal places.
- 2) This batgrbproduct analysis is done using the HEASARC data.
- 3) This batgrbproduct analysis is using the flight position for the mask-weighting calculation.
======================================================================
BAT GRB EVENT DATA PROCESSING REPORT
Process Script Ver: batgrbproduct v2.46
Process Start Time: Mon Jan 13 17:38:25 EST 2014
Host Name: batevent1
Current Working Dir: /local/data/batevent/batevent_reproc/trigger509018
======================================================================
Trigger: 00509018 Segment: 000
BAT Trigger Time: 344698656 [s; MET]
Trigger Stop: 344698720 [s; MET]
UTC: 2011-12-04T13:37:28.359180 [includes UTCF correction]
Where From?: TDRSS position message
BAT
RA: 336.641463053206 Dec: -31.3949607281387 [deg; J2000]
Catalogged Source?: NO
Point Source?: YES
GRB Indicated?: YES [ by BAT flight software ]
Image S/N Ratio: 7.23
Image Trigger?: YES
Rate S/N Ratio: 0 [ if not an image trigger ]
Image S/N Ratio: 7.23
Analysis Position: [ source = BAT ]
RA: 336.641463053206 Dec: -31.3949607281387 [deg; J2000]
Refined Position: [ source = BAT pre-slew burst ]
RA: 336.657247448748 Dec: -31.4147393647623 [deg; J2000]
{ 22h 26m 37.7s , -31d 24' 53.1" }
+/- 2.23697508496837 [arcmin] (estimated 90% radius based on SNR)
+/- 1.29940148842213 [arcmin] (formal 1-sigma fit error)
SNR: 9.62947157811885
Angular difference between the analysis and refined position is 1.435859 arcmin
Partial Coding Fraction: 0.75 [ including projection effects ]
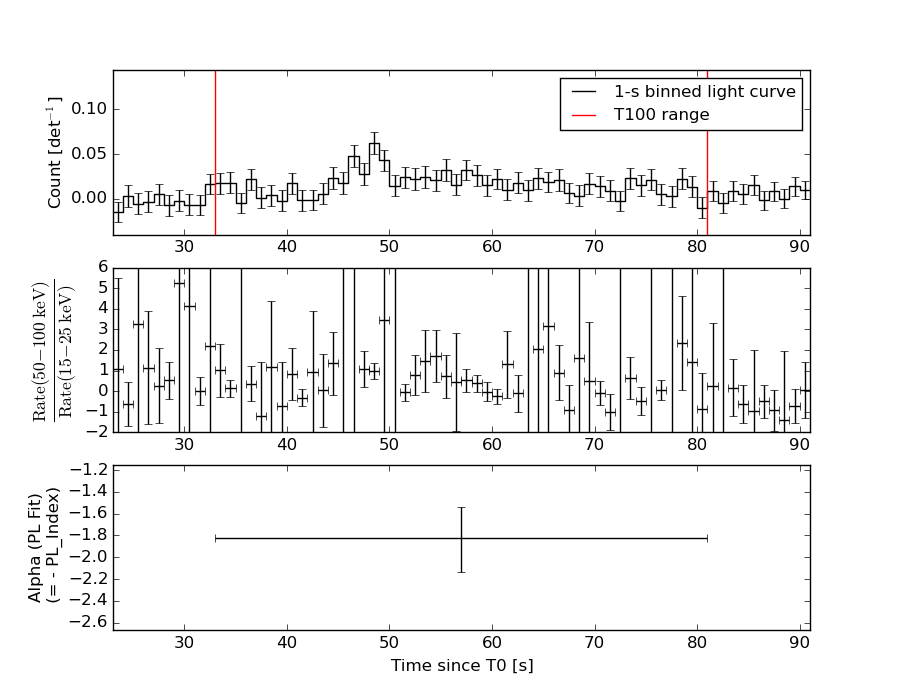
Duration
T90: 48 +/- 22.6274169979695
Measured from: 33
to: 81 [s; relative to TRIGTIME]
T50: 32 +/- 16
Measured from: 33
to: 65 [s; relative to TRIGTIME]
Fluence
Peak Flux (peak 1 second)
Measured from: 56.5
to: 57.5 [s; relative to TRIGTIME]
Total Fluence
Measured from: 33
to: 81 [s; relative to TRIGTIME]
Band 1 Band 2 Band 3 Band 4
15-25 25-50 50-100 100-350 keV
Total 0.270454 0.307515 0.184588 0.030591
0.042423 0.044362 0.039715 0.035968 [error]
Peak 0.011526 0.015307 0.004056 -0.001770
0.006172 0.006630 0.005750 0.005416 [error]
[ fluence units of on-axis counts / fully illuminated detector ]
======================================================================
====== Table of the duration information =============================
Value tstart tstop
T100 48.000 33.000 81.000
T90 48.000 33.000 81.000
T50 32.000 33.000 65.000
Peak 1.000 56.500 57.500
====== Spectral Analysis Summary =====================================
Model : spectral model: simple power-law (PL) and cutoff power-law (CPL)
Ph_index : photon index: E^{Ph_index}
Ph_90err : 90% error of the photon index
Epeak : Epeak in keV
Epeak_90err: 90% error of Epeak
Norm : normalization at 50 keV in both the PL model and CPL model
Nomr_90err : 90% error of the normalization
chi2 : Chi-Squared
dof : degree of freedo
=== Time-averaged spectral analysis ===
(Best model with acceptable fit: PL)
Model Ph_index Ph_90err_low Ph_90err_hi Epeak Epeak_90err_low Epeak_90err_hi Norm Nomr_90err_low Norm_90err_hi chi2 dof
PL -1.828 -0.306 0.285 - - - 1.06e-03 -2.05e-04 1.97e-04 53.960 57
CPL -1.826 -1.247 1.093 9992.780 -9992.770 -9992.780 1.07e-03 -1.07e-03 2.76e-03 53.960 56
=== 1-s peak spectral analysis ===
(Best model with acceptable fit: N/A)
Model Ph_index Ph_90err_low Ph_90err_hi Epeak Epeak_90err_low Epeak_90err_hi Norm Nomr_90err_low Norm_90err_hi chi2 dof
PL -2.141 -1.585 1.090 - - - 1.66e-03 -1.33e-03 1.36e-03 62.190 57
CPL 1.496 N/A N/A 29.743 N/A N/A 5.13e-01 N/A N/A 61.460 56
=== Fluence/Peak Flux Summary ===
Model Band1 Band2 Band3 Band4 Band5 Total
15-25 25-50 50-100 100-350 15-150 15-350 keV
Fluence PL 8.87e-08 1.34e-07 1.51e-07 3.22e-07 4.70e-07 6.95e-07 erg/cm2
90%_error_low -1.98e-08 -2.07e-08 -3.89e-08 -1.41e-07 -8.90e-08 -1.87e-07 erg/cm2
90%_error_hi 2.05e-08 2.07e-08 3.95e-08 2.00e-07 9.16e-08 2.34e-07 erg/cm2
Peak flux PL 1.27e-01 8.79e-02 3.99e-02 2.52e-02 2.67e-01 2.80e-01 ph/cm2/s
90%_error_low -8.82e-02 -8.79e-02 -3.99e-02 -2.52e-02 -1.56e-01 -1.64e-01 ph/cm2/s
90%_error_hi 9.50e-02 5.34e-02 4.67e-02 9.35e-02 1.57e-01 1.72e-01 ph/cm2/s
Fluence CPL 8.87e-08 1.34e-07 1.51e-07 3.21e-07 4.70e-07 6.83e-07 erg/cm2
90%_error_low -2.02e-08 -2.07e-08 -3.87e-08 -2.04e-07 -1.04e-07 -2.89e-07 erg/cm2
90%_error_hi 2.10e-08 2.70e-08 3.98e-08 1.14e-07 7.39e-08 1.34e-07 erg/cm2
Peak flux CPL 1.20e-01 1.21e-01 6.58e-03 1.84e-06 2.47e-01 2.48e-01 ph/cm2/s
90%_error_low -9.42e-02 N/A -6.58e-03 -1.84e-06 -1.42e-01 N/A ph/cm2/s
90%_error_hi 1.07e-01 N/A 7.27e-02 5.47e-02 1.51e-01 N/A ph/cm2/s
======================================================================
Image
Pre-slew 15.0-350.0 keV image (Event data)
#   RAcent    DECcent   POSerr    Theta     Phi              Peak Cts       SNR   Name
  336.6572   -31.4147   0.0200    31.5292  -155.2796         0.7557589      9.629 TRIG_00509018

Foreground time interval of the image:
 33.000  72.501 (delta_t =  39.501 [sec])
Background time interval of the image:
-722.499 -701.003 (delta_t =  21.496 [sec])
-239.000  33.000 (delta_t = 272.000 [sec])
Light Curves
Note: The mask-weighted lightcurves have units of either count/det or counts/sec/det, where a det is 0.4 x 0.4 = 0.16 sq cm.
Full-time range; 1 s binning
Other quick-look light curves:
- 64 ms binning (zoomed)
- 16 ms binning (zoomed)
- 8 ms binning (zoomed)
- 2 ms binning (zoomed)
- SN=5 or 10 s binning (full-time range)
- Raw light curve
Spectra
- 64 ms binning (zoomed)
- 16 ms binning (zoomed)
- 8 ms binning (zoomed)
- 2 ms binning (zoomed)
- SN=5 or 10 s binning (full-time range)
- Raw light curve
Spectra
Notes:
- 1) The fitting includes the systematic errors.
- 2) When the burst includes telescope slew time periods, the fitting uses an average response file made from multiple 5-s response files through out the slew time plus single time preiod for the non-slew times, and weighted by the total counts in the corresponding time period using addrmf. An average response file is needed becuase a spectral fit using the pre-slew DRM will introduce some errors in both a spectral shape and a normalization if the PHA file contains a lot of the slew/post-slew time interval.
- 3) For fits to more complicated models (e.g. a power-law over a cutoff power-law), the BAT team has decided to require a chi-square improvement of more than 6 for each extra dof.
Time averaged spectrum fit using the average DRM
Power-law model

Time interval is from   33.000 sec. to   81.000 sec.

Spectral model in power-law:
------------------------------------------------------------
Parameters  : value       lower 90%   higher 90%
Photon index: -1.82751     ( -0.305839   0.285393 )
Norm@50keV  : 1.06355E-03    ( -0.000204942   0.000197227 )
------------------------------------------------------------
#Fit statistic : Chi-Squared =          53.96 using 59 PHA bins.
# Reduced chi-squared =         0.9467 for     57 degrees of freedom
# Null hypothesis probability =   5.898182e-01

Photon flux (15-150 keV)    in 48 sec: 0.148155 ( -0.022922  0.022926 ) ph/cm2/s
Energy fluence (15-150 keV)             : 4.69668e-07 ( -8.89522e-08  9.16008e-08 ) ergs/cm2
Cutoff power-law model
Time interval is from   33.000 sec. to   81.000 sec.
Spectral model in the cutoff power-law:
------------------------------------------------------------
Parameters  : value       lower 90%   higher 90%
Photon index: -1.82591     ( -1.24674   1.09316 )
Epeak [keV] : 9992.78      ( -9975.72 -9975.73 )
Norm@50keV  : 1.06583E-03    ( -0.001065   0.00276542 )
------------------------------------------------------------
#Fit statistic : Chi-Squared =          53.96 using 59 PHA bins.
# Reduced chi-squared =         0.9636 for     56 degrees of freedom
# Null hypothesis probability =   5.524320e-01

Photon flux (15-150 keV)    in 48 sec: 0.148149 ( -0.023448  0.022924 ) ph/cm2/s
Energy fluence (15-150 keV)             : 4.69765e-07 ( -1.04094e-07  7.39368e-08 ) ergs/cm2
1-s peak spectrum fit
Power-law model
Time interval is from   56.500 sec. to   57.500 sec.

Spectral model in power-law:
------------------------------------------------------------
Parameters  : value       lower 90%   higher 90%
Photon index: -2.14121     ( -1.58497   1.08992 )
Norm@50keV  : 1.66450E-03    ( -0.00133483   0.0013615 )
------------------------------------------------------------
#Fit statistic : Chi-Squared =          62.19 using 59 PHA bins.
# Reduced chi-squared =          1.091 for     57 degrees of freedom
# Null hypothesis probability =   2.967596e-01

Photon flux (15-150 keV)    in 1 sec: 0.267349 ( -0.156388  0.157118 ) ph/cm2/s
Energy fluence (15-150 keV)             : 1.55367e-08 ( -1.04036e-08  1.26737e-08 ) ergs/cm2
Cutoff power-law model
Time interval is from   56.500 sec. to   57.500 sec.
Spectral model in the cutoff power-law:
------------------------------------------------------------
Parameters  : value       lower 90%   higher 90%
Photon index: 4.36818     (       )
Epeak [keV] : 28.9126      (   )
Norm@50keV  : 56.2115    (     )
------------------------------------------------------------
#Fit statistic : Chi-Squared =          61.35 using 59 PHA bins.
# Reduced chi-squared =          1.095 for     56 degrees of freedom
# Null hypothesis probability =   2.903355e-01

Photon flux (15-150 keV)    in 1 sec: 0.247475 ( -0.142452  0.151284 ) ph/cm2/s
Energy fluence (15-150 keV)             : 0 ( 0  0 ) ergs/cm2
Time-resolved spectra
Distribution
T90 vs. Hardness ratio plot
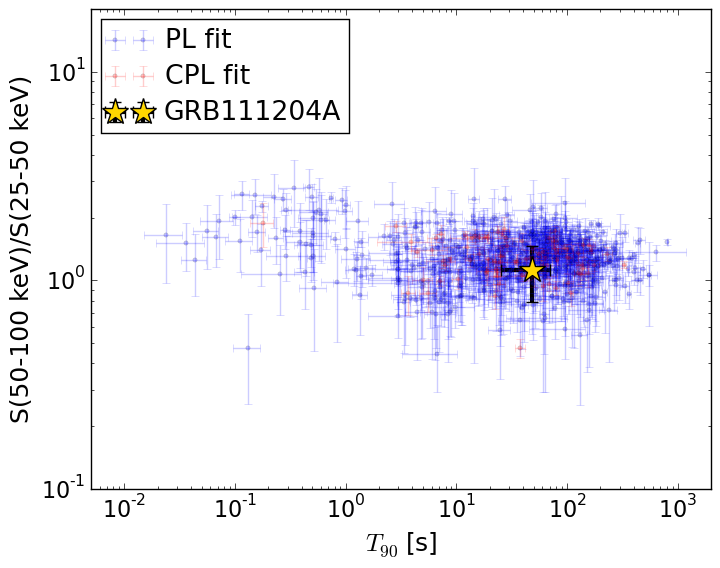
T90                                   = 48.0 sec.
Hardness ratio (energy fluence ratio) = 1.12704100461
S(15-50 keV) vs. S(50-150 keV) plot
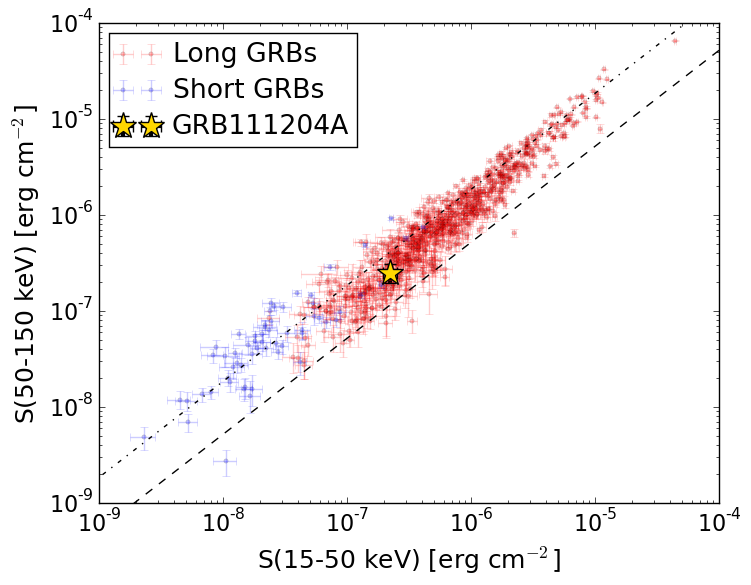
S(15-50 keV)  = 2.2231838e-07
S(50-150 keV) = 2.4734971e-07
The dash-dotted line and the dashed line traces the fluences calculated from the Band function with Epeak = 15 and 150 keV, respectively. Both lines assume a canonical values of alpha = -1 and beta = -2.5.
Mask shadow pattern
IMX = -5.572793627266761E-01, IMY = 2.565603686262565E-01
Spacecraft aspect plot
Bright source in the pre-burst/pre-slew/post-slew images
Pre-burst image of 15-350 keV band
Time interval of the image:
-722.499400 -701.003300
-239.000000 33.000000

# RAcent  DECcent POSerr Theta    Phi  PeakCts   SNR AngSep     Name
#  [deg]    [deg]    ['] [deg]  [deg]                   [']
299.5771  35.1769    4.3  52.4  -25.6   1.7641   2.7    1.6	Cyg X-1
308.1454  40.9551    5.8  50.8  -14.4   1.0562   2.0    1.6	Cyg X-3
326.1021  38.3065    7.4  40.9   -0.5   0.5707   1.6    3.4	Cyg X-2
358.5508  42.0965    3.2  45.1   35.9   2.5837   3.6 ------	UNKNOWN
355.9366  11.2300    2.6  18.7   69.4   1.1020   4.4 ------	UNKNOWN
 10.1555 -34.2094    2.5  43.6  161.9   2.3323   4.7 ------	UNKNOWN
354.6332 -18.7957    3.0  22.9  162.7   0.9389   3.9 ------	UNKNOWN
  6.9025 -49.4761    2.9  54.1  177.0   3.4582   4.0 ------	UNKNOWN
347.2227 -59.0441    2.6  59.1 -166.2   6.8478   4.5 ------	UNKNOWN
318.0187 -29.1635    3.0  36.4 -127.3   1.5235   3.9 ------	UNKNOWN
Pre-slew background subtracted image of 15-350 keV band
Time interval of the image:
33.000000 72.500600

# RAcent  DECcent POSerr Theta    Phi  PeakCts   SNR AngSep     Name
#  [deg]    [deg]    ['] [deg]  [deg]                   [']
299.5017  35.1307    5.0  52.4  -25.7  -0.4622  -2.3    6.1	Cyg X-1
307.9447  41.0443    6.1  51.0  -14.5  -0.2932  -1.9    9.3	Cyg X-3
326.2726  38.4268    6.4  40.9   -0.2   0.1830   1.8    7.9	Cyg X-2
  1.9208  15.5601    2.9  25.9   69.2   0.3787   4.0 ------	UNKNOWN
336.6572 -31.4147    1.2  31.5 -155.3   0.7562   9.6 ------	UNKNOWN
316.8637 -45.7633    2.3  50.3 -140.7   1.2468   5.0 ------	UNKNOWN
Post-slew image of 15-350 keV band
Time interval of the image:
123.700600 337.300600

# RAcent  DECcent POSerr Theta    Phi  PeakCts   SNR AngSep     Name
#  [deg]    [deg]    ['] [deg]  [deg]                   [']
333.8521   2.2274    2.9  33.7   12.6   0.9268   3.9 ------	UNKNOWN
336.1291 -57.6643    2.7  26.3 -161.7   0.7872   4.3 ------	UNKNOWN
 46.4145 -87.2515    2.8  57.7 -165.4   3.9588   4.1 ------	UNKNOWN
282.8854 -51.7269    3.4  43.8 -116.2   2.7628   3.4 ------	UNKNOWN