Analysis Summary
Notes:
- 1) No attempt has been made to eliminate the non-significant decimal places.
- 2) This batgrbproduct analysis is done using the HEASARC data.
- 3) This batgrbproduct analysis is using the flight position for the mask-weighting calculation.
==========================================================================
BAT GROUND-DETECTED GRB DATA PROCESSING REPORT
Process Script: hand-made scripts that follow steps in batgrbproduct
but without using TDRSS info
Process Start Time: Wed Oct 22 22:19:09 EDT 2014
Host Name: bat1
Current Working Dir: /local/data/bat1/alien/Swift_3rdBATcatalog/event/ground_detect_bursts/scripts
==========================================================================
BAT Trigger Time: 344960220.8
UTC: 2011-12-07T14:16:53.149 [includes UTCF correction]
Where From?: Ground analysis (best_duration.txt)
NOTE: BAT trigger time for ground-detected burst is the T100 start time.
Refined Position: [ source = BAT pre-slew image ]
RA: 92.9171248551 Dec: -39.5095501455 [deg; J2000]
{ 06h 11m 40.1s , -39d -30' -34.4" }
+/- 2.40645206989 [arcmin] (estimated 90% radius based on SNR)
SNR: 8.67662051258
Angular difference between the analysis and refined position is Usage: arcmin
Partial Coding Fraction: 1.000000e+00 [ including projection effects ]
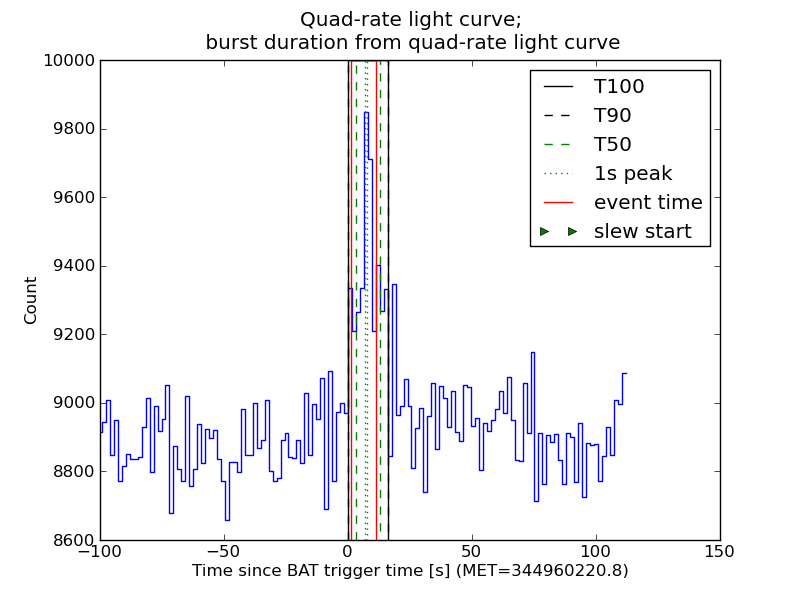
Duration
T90: 16. +/- 1.6
Measured from: 0
to: 16 [s; relative to TRIGTIME]
T50: 9.60000002384186 +/- 1.6
Measured from: 3.2
to: 12.8 [s; relative to TRIGTIME]
====== Table of the duration information =============================
Value tstart tstop
T100 16.000 0.000 16.000
T90 16.000 0.000 16.000
T50 9.600 3.200 12.800
Peak 1.000 6.700 7.700
====== Spectral Analysis Summary =====================================
Model : spectral model: simple power-law (PL) and cutoff power-law (CPL)
Ph_index : photon index: E^{Ph_index}
Ph_90err : 90% error of the photon index
Epeak : Epeak in keV
Epeak_90err: 90% error of Epeak
Norm : normalization at 50 keV in both the PL model and CPL model
Nomr_90err : 90% error of the normalization
chi2 : Chi-Squared
dof : degree of freedo
=== Time-averaged spectral analysis ===
(Best model with acceptable fit: PL)
Model Ph_index Ph_90err_low Ph_90err_hi Epeak Epeak_90err_low Epeak_90err_hi Norm Nomr_90err_low Norm_90err_hi chi2 dof
PL -1.299 -0.357 0.367 - - - 1.66e-03 -3.26e-04 3.25e-04 44.660 57
CPL -1.298 -0.356 1.022 9999.300 -9999.300 -9999.300 1.67e-03 -3.27e-04 3.63e-03 44.660 56
=== 1-s peak spectral analysis ===
(Best model with acceptable fit: N/A)
Model Ph_index Ph_90err_low Ph_90err_hi Epeak Epeak_90err_low Epeak_90err_hi Norm Nomr_90err_low Norm_90err_hi chi2 dof
PL -0.995 -0.834 1.097 - - - 2.98e-03 -1.33e-03 1.07e-03 65.050 57
CPL -1.075 1.075 0.914 9999.360 N/A N/A 3.02e-03 N/A N/A 65.100 56
=== Fluence/Peak Flux Summary ===
Model Band1 Band2 Band3 Band4 Band5 Total
15-25 25-50 50-100 100-350 15-150 15-350 keV
Fluence PL 1.77e-08 3.68e-08 5.99e-08 2.19e-07 1.66e-07 3.33e-07 erg/cm2
90%_error_low -6.13e-09 -8.03e-09 -1.51e-08 -1.00e-07 -3.66e-08 -1.14e-07 erg/cm2
90%_error_hi 6.66e-09 7.77e-09 1.48e-08 1.51e-07 3.73e-08 1.56e-07 erg/cm2
Peak flux PL 7.56e-02 1.03e-01 1.04e-01 1.89e-01 3.43e-01 4.70e-01 ph/cm2/s
90%_error_low -7.56e-02 -6.22e-02 -4.48e-02 -1.37e-01 -3.43e-01 -1.77e-01 ph/cm2/s
90%_error_hi 8.13e-02 5.01e-02 3.94e-02 3.55e-01 1.30e-01 2.60e-01 ph/cm2/s
Fluence CPL 1.81e-08 3.63e-08 5.91e-08 2.21e-07 1.68e-07 3.16e-07 erg/cm2
90%_error_low -7.09e-09 -7.54e-09 N/A -1.74e-07 -3.91e-08 -1.60e-07 erg/cm2
90%_error_hi 7.04e-09 8.81e-09 N/A 6.42e-08 3.40e-08 1.65e-07 erg/cm2
Peak flux CPL 6.15e-02 4.69e-02 2.51e-02 2.34e-02 1.43e-01 1.57e-01 ph/cm2/s
90%_error_low N/A -4.69e-02 -2.51e-02 -2.34e-02 -1.43e-01 -1.57e-01 ph/cm2/s
90%_error_hi N/A 3.03e-02 1.02e-02 1.81e-02 8.46e-02 7.35e-02 ph/cm2/s
======================================================================
Image
15.0-350.0 keV image (Event data)
#RAcent DECcent POSerr Theta  Phi  Peak_Cts  SNR Name
92.917 -39.510 0.022 16.125 -7.010 0.273 8.677 TRIG_00509245

Image time interval: 1.200 to 11.290 [sec]
Light Curves
Note: The mask-weighted lightcurves have units of either count/det or counts/sec/det, where a det is 0.4 x 0.4 = 0.16 sq cm.
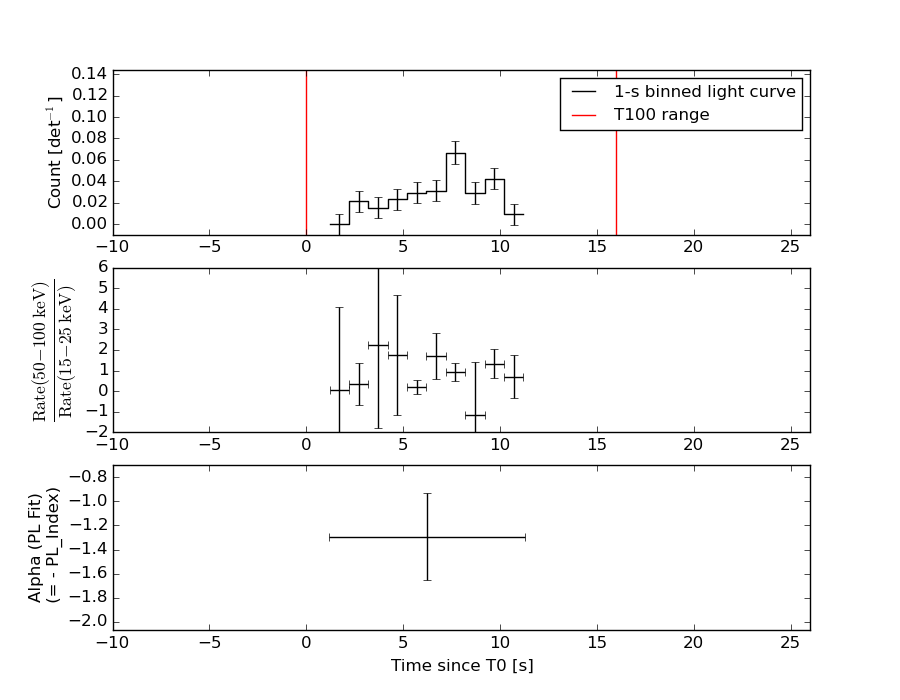
Best duration plot
Full-time range; 1 s binning
Other quick-look light curves:
- 64 ms binning (zoomed)
- 16 ms binning (zoomed)
- 8 ms binning (zoomed)
- 2 ms binning (zoomed)
- SN=5 or 10 s binning (full-time range)
- Raw light curve
Spectra
- 64 ms binning (zoomed)
- 16 ms binning (zoomed)
- 8 ms binning (zoomed)
- 2 ms binning (zoomed)
- SN=5 or 10 s binning (full-time range)
- Raw light curve
Spectra
Notes:
- 1) The fitting includes the systematic errors.
- 2) When the burst includes telescope slew time periods, the fitting uses an average response file made from multiple 5-s response files through out the slew time plus single time preiod for the non-slew times, and weighted by the total counts in the corresponding time period using addrmf. An average response file is needed becuase a spectral fit using the pre-slew DRM will introduce some errors in both a spectral shape and a normalization if the PHA file contains a lot of the slew/post-slew time interval.
- 3) For fits to more complicated models (e.g. a power-law over a cutoff power-law), the BAT team has decided to require a chi-square improvement of more than 6 for each extra dof.
Time averaged spectrum fit using the average DRM
Power-law model
Time interval is from    1.200 sec. to   11.290 sec.

Spectral model in power-law:
------------------------------------------------------------
Parameters  : value       lower 90%   higher 90%
Photon index: -1.29909     ( -0.356661   0.366924 )
Norm@50keV  : 1.65959E-03    ( -0.000325784   0.00032455 )
------------------------------------------------------------
#Fit statistic : Chi-Squared =          44.66 using 59 PHA bins.
# Reduced chi-squared =         0.7835 for     57 degrees of freedom
# Null hypothesis probability =   8.826203e-01

Photon flux (15-150 keV)    in 10.09 sec: 0.197963 ( -0.039236  0.039387 ) ph/cm2/s
Energy fluence (15-150 keV)             : 1.65527e-07 ( -3.65776e-08  3.72554e-08 ) ergs/cm2
Cutoff power-law model

Time interval is from    1.200 sec. to   11.290 sec.
Spectral model in the cutoff power-law:
------------------------------------------------------------
Parameters  : value       lower 90%   higher 90%
Photon index: -1.29799     ( -0.356188   1.02186 )
Epeak [keV] : 9999.30      ( -9999.36 -9999.36 )
Norm@50keV  : 1.66608E-03    ( -0.000327414   0.00362818 )
------------------------------------------------------------
#Fit statistic : Chi-Squared =          44.66 using 59 PHA bins.
# Reduced chi-squared =         0.7976 for     56 degrees of freedom
# Null hypothesis probability =   8.619795e-01

Photon flux (15-150 keV)    in 10.09 sec: 0.197942 ( -0.039301  0.039356 ) ph/cm2/s
Energy fluence (15-150 keV)             : 1.68221e-07 ( -3.90993e-08  3.39785e-08 ) ergs/cm2
1-s peak spectrum fit
Power-law model
Time interval is from    6.700 sec. to    7.700 sec.

Spectral model in power-law:
------------------------------------------------------------
Parameters  : value       lower 90%   higher 90%
Photon index: -0.995123     ( -0.836192   1.09521 )
Norm@50keV  : 2.98093E-03    ( -0.00133361   0.00106877 )
------------------------------------------------------------
#Fit statistic : Chi-Squared =          65.05 using 59 PHA bins.
# Reduced chi-squared =          1.141 for     57 degrees of freedom
# Null hypothesis probability =   2.167613e-01

Photon flux (15-150 keV)    in 1 sec: 0.342923 ( -0.342923  0.129949 ) ph/cm2/s
Energy fluence (15-150 keV)             : 3.23162e-08 ( -1.28622e-08  1.28912e-08 ) ergs/cm2
Cutoff power-law model
Time interval is from    6.700 sec. to    7.700 sec.
Spectral model in the cutoff power-law:
------------------------------------------------------------
Parameters  : value       lower 90%   higher 90%
Photon index: -3.34705     ( 3.35726   3.19552 )
Epeak [keV] : 350.621      (   )
Norm@50keV  : 2.55593E-04    (     )
------------------------------------------------------------
#Fit statistic : Chi-Squared =          63.79 using 59 PHA bins.
# Reduced chi-squared =          1.139 for     56 degrees of freedom
# Null hypothesis probability =   2.214703e-01

Photon flux (15-150 keV)    in 1 sec: 0.143015 ( -0.143015  0.08461 ) ph/cm2/s
Energy fluence (15-150 keV)             : 9.43952e-09 ( -9.43952e-09  4.00948e-09 ) ergs/cm2
Time-resolved spectra
Distribution
T90 vs. Hardness ratio plot
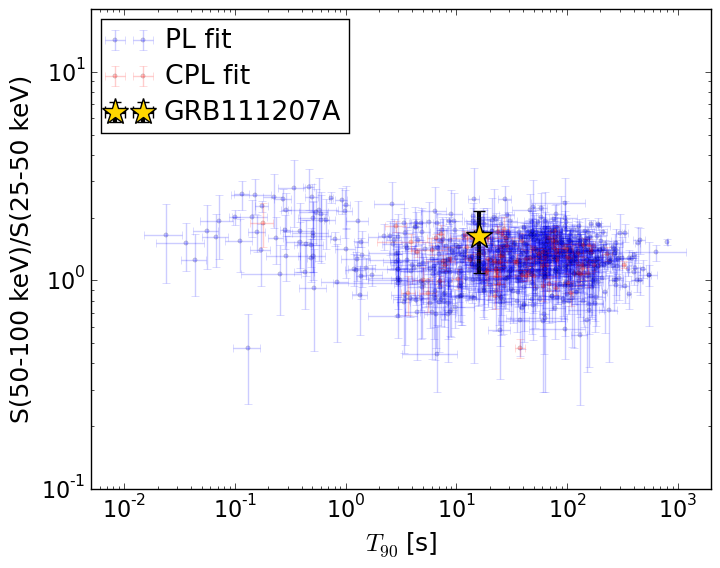
T90                                   = 16.0 sec.
Hardness ratio (energy fluence ratio) = 1.62554875866
S(15-50 keV) vs. S(50-150 keV) plot
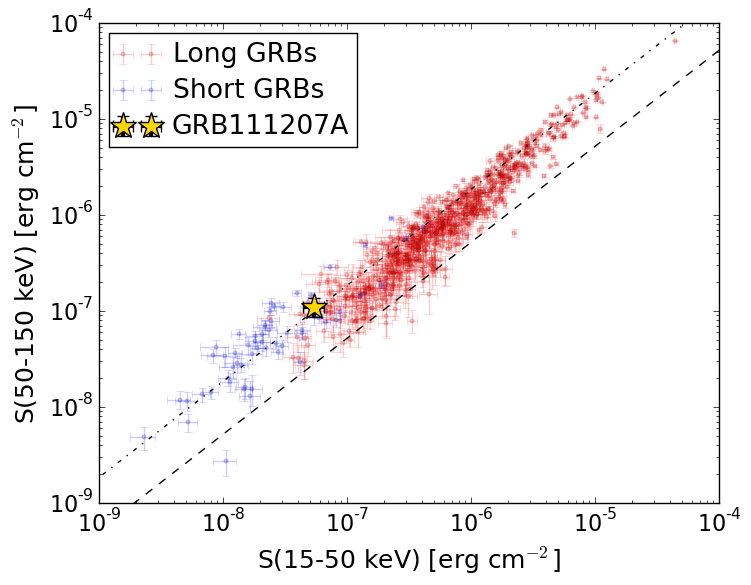
S(15-50 keV)  = 5.454188e-08
S(50-150 keV) = 1.1098634e-07
The dash-dotted line and the dashed line traces the fluences calculated from the Band function with Epeak = 15 and 150 keV, respectively. Both lines assume a canonical values of alpha = -1 and beta = -2.5.
Mask shadow pattern
IMX = 0.286950325616, IMY = 0.0352857860017
Spacecraft aspect plot
Bright source in the event data image
Event data image of 15-350 keV band
Time interval of the image:
1.200000 11.290400

# RAcent  DECcent POSerr Theta    Phi  PeakCts   SNR AngSep     Name
#  [deg]    [deg]    ['] [deg]  [deg]                   [']
135.2688 -40.5436    0.0  22.2 -120.8   0.0810   2.2   11.9	Vela X-1
137.9220  11.2199    2.4  50.3  154.4   0.6849   4.8 ------	UNKNOWN
 92.9171 -39.5095    1.3  16.1   -7.0   0.2731   8.7 ------	UNKNOWN
 34.9583 -57.7696    2.3  56.1  -23.7   0.6331   5.0 ------	UNKNOWN
Webpage updated on:
Sun Jun 21 01:10:01 EDT 2015