Analysis Summary
Notes:
- 1) No attempt has been made to eliminate the non-significant decimal places.
- 2) This batgrbproduct analysis is done using the HEASARC data.
- 3) This batgrbproduct analysis is using the flight position for the mask-weighting calculation.
======================================================================
BAT GRB EVENT DATA PROCESSING REPORT
Process Script Ver: batgrbproduct v2.46
Process Start Time: Mon Jan 13 17:11:57 EST 2014
Host Name: batevent1
Current Working Dir: /local/data/batevent/batevent_reproc/trigger509543
======================================================================
Trigger: 00509543 Segment: 000
BAT Trigger Time: 345374594.752 [s; MET]
Trigger Stop: 345374602.944 [s; MET]
UTC: 2011-12-12T09:23:07.084300 [includes UTCF correction]
Where From?: TDRSS position message
BAT
RA: 310.404448660982 Dec: -68.6171052622876 [deg; J2000]
Catalogged Source?: NO
Point Source?: YES
GRB Indicated?: YES [ by BAT flight software ]
Image S/N Ratio: 8.09
Image Trigger?: NO
Rate S/N Ratio: 8.48528137423857 [ if not an image trigger ]
Image S/N Ratio: 8.09
Analysis Position: [ source = BAT ]
RA: 310.404448660982 Dec: -68.6171052622876 [deg; J2000]
Refined Position: [ source = BAT pre-slew burst ]
RA: 310.441694517769 Dec: -68.5848822181666 [deg; J2000]
{ 20h 41m 46.0s , -68d 35' 05.6" }
+/- 1.75420619468349 [arcmin] (estimated 90% radius based on SNR)
+/- 0.797385353897873 [arcmin] (formal 1-sigma fit error)
SNR: 13.6279882662972
Angular difference between the analysis and refined position is 2.098285 arcmin
Partial Coding Fraction: 0.359375 [ including projection effects ]
Duration
T90: 56.3040000200272 +/- 9.35030263976235
Measured from: -1.76799994707108
to: 54.5360000729561 [s; relative to TRIGTIME]
T50: 25.37600004673 +/- 7.66085948001888
Measured from: 6.56800001859665
to: 31.9440000653267 [s; relative to TRIGTIME]
Fluence
Peak Flux (peak 1 second)
Measured from: 4.76399999856949
to: 5.76399999856949 [s; relative to TRIGTIME]
Total Fluence
Measured from: -5.76799994707108
to: 62.6480000019073 [s; relative to TRIGTIME]
Band 1 Band 2 Band 3 Band 4
15-25 25-50 50-100 100-350 keV
Total 0.520401 0.911580 0.605690 0.109234
0.080800 0.081669 0.070896 0.060597 [error]
Peak 0.030856 0.039079 0.026402 0.020402
0.010404 0.010291 0.008912 0.007820 [error]
[ fluence units of on-axis counts / fully illuminated detector ]
======================================================================
====== Table of the duration information =============================
Value tstart tstop
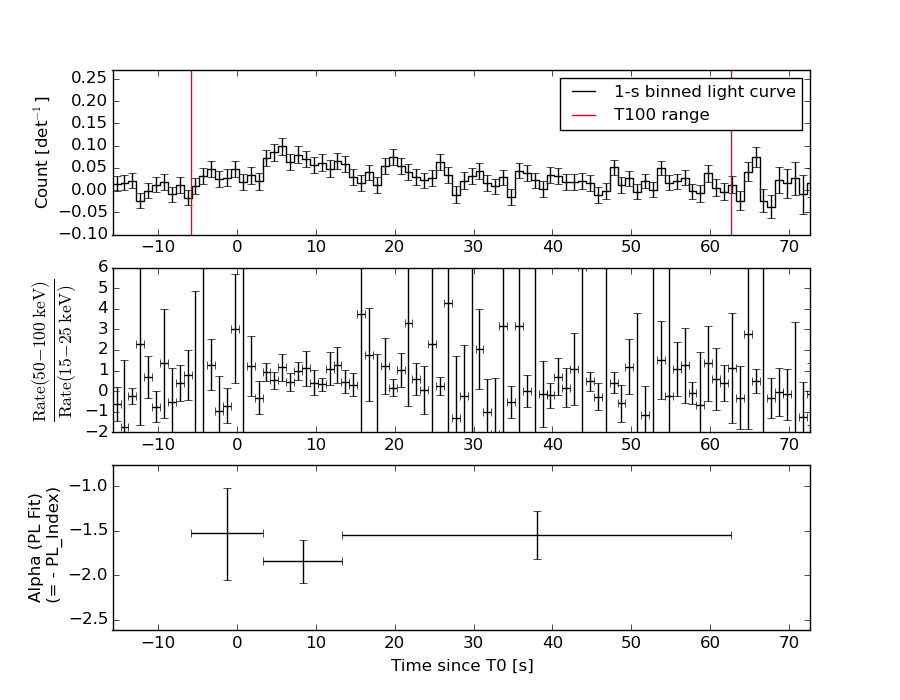
T100 68.416 -5.768 62.648
T90 56.304 -1.768 54.536
T50 25.376 6.568 31.944
Peak 1.000 4.764 5.764
====== Spectral Analysis Summary =====================================
Model : spectral model: simple power-law (PL) and cutoff power-law (CPL)
Ph_index : photon index: E^{Ph_index}
Ph_90err : 90% error of the photon index
Epeak : Epeak in keV
Epeak_90err: 90% error of Epeak
Norm : normalization at 50 keV in both the PL model and CPL model
Nomr_90err : 90% error of the normalization
chi2 : Chi-Squared
dof : degree of freedo
=== Time-averaged spectral analysis ===
(Best model with acceptable fit: PL)
Model Ph_index Ph_90err_low Ph_90err_hi Epeak Epeak_90err_low Epeak_90err_hi Norm Nomr_90err_low Norm_90err_hi chi2 dof
PL -1.628 -0.187 0.183 - - - 2.17e-03 -2.46e-04 2.44e-04 55.050 57
CPL -0.877 -0.797 0.996 71.096 -18.849 -71.096 5.39e-03 -3.27e-03 1.25e-02 52.510 56
=== 1-s peak spectral analysis ===
(Best model with acceptable fit: PL)
Model Ph_index Ph_90err_low Ph_90err_hi Epeak Epeak_90err_low Epeak_90err_hi Norm Nomr_90err_low Norm_90err_hi chi2 dof
PL -1.689 -0.590 0.559 - - - 6.22e-03 -2.16e-03 2.07e-03 65.850 57
CPL -1.476 -0.923 2.436 111.316 -111.306 -111.316 8.16e-03 -8.16e-03 2.24e-01 65.870 56
=== Fluence/Peak Flux Summary ===
Model Band1 Band2 Band3 Band4 Band5 Total
15-25 25-50 50-100 100-350 15-150 15-350 keV
Fluence PL 2.14e-07 3.64e-07 4.71e-07 1.23e-06 1.39e-06 2.28e-06 erg/cm2
90%_error_low -3.67e-08 -4.03e-08 -6.94e-08 -3.40e-07 -1.66e-07 -4.08e-07 erg/cm2
90%_error_hi 3.83e-08 4.02e-08 6.92e-08 4.16e-07 1.68e-07 4.66e-07 erg/cm2
Peak flux PL 3.07e-01 2.76e-01 1.71e-01 1.62e-01 8.23e-01 9.17e-01 ph/cm2/s
90%_error_low -1.44e-01 -8.92e-02 -7.41e-02 -1.05e-01 -2.59e-01 -2.86e-01 ph/cm2/s
90%_error_hi 1.61e-01 8.77e-02 7.38e-02 1.84e-01 2.60e-01 2.88e-01 ph/cm2/s
Fluence CPL 1.92e-07 3.95e-07 4.84e-07 4.34e-07 1.31e-06 1.51e-06 erg/cm2
90%_error_low -4.36e-08 -5.22e-08 -7.78e-08 -2.80e-07 -1.88e-07 -3.39e-07 erg/cm2
90%_error_hi 4.45e-08 5.49e-08 7.75e-08 8.92e-07 1.89e-07 8.67e-07 erg/cm2
Peak flux CPL 3.05e-01 2.78e-01 1.72e-01 1.51e-01 8.22e-01 9.06e-01 ph/cm2/s
90%_error_low -1.60e-01 -8.92e-02 N/A -1.51e-01 -2.64e-01 -3.32e-01 ph/cm2/s
90%_error_hi 1.64e-01 1.14e-01 N/A 1.05e-01 2.61e-01 2.94e-01 ph/cm2/s
======================================================================
Image
Pre-slew 15.0-350.0 keV image (Event data)
#   RAcent    DECcent   POSerr    Theta     Phi              Peak Cts       SNR   Name
  310.4417   -68.5849   0.0141    36.2066   -58.8916         2.0917704     13.628 TRIG_00509543

Foreground time interval of the image:
 -5.768  47.149 (delta_t =  52.917 [sec])
Background time interval of the image:
-239.752  -5.768 (delta_t = 233.984 [sec])
Light Curves
Note: The mask-weighted lightcurves have units of either count/det or counts/sec/det, where a det is 0.4 x 0.4 = 0.16 sq cm.
Full-time range; 1 s binning
Other quick-look light curves:
- 64 ms binning (zoomed)
- 16 ms binning (zoomed)
- 8 ms binning (zoomed)
- 2 ms binning (zoomed)
- SN=5 or 10 s binning (full-time range)
- Raw light curve
Spectra
- 64 ms binning (zoomed)
- 16 ms binning (zoomed)
- 8 ms binning (zoomed)
- 2 ms binning (zoomed)
- SN=5 or 10 s binning (full-time range)
- Raw light curve
Spectra
Notes:
- 1) The fitting includes the systematic errors.
- 2) When the burst includes telescope slew time periods, the fitting uses an average response file made from multiple 5-s response files through out the slew time plus single time preiod for the non-slew times, and weighted by the total counts in the corresponding time period using addrmf. An average response file is needed becuase a spectral fit using the pre-slew DRM will introduce some errors in both a spectral shape and a normalization if the PHA file contains a lot of the slew/post-slew time interval.
- 3) For fits to more complicated models (e.g. a power-law over a cutoff power-law), the BAT team has decided to require a chi-square improvement of more than 6 for each extra dof.
Time averaged spectrum fit using the average DRM
Power-law model
Time interval is from   -5.768 sec. to   62.648 sec.

Spectral model in power-law:
------------------------------------------------------------
Parameters  : value       lower 90%   higher 90%
Photon index: -1.62767     ( -0.18673   0.183353 )
Norm@50keV  : 2.17482E-03    ( -0.000246178   0.000244095 )
------------------------------------------------------------
#Fit statistic : Chi-Squared =          55.05 using 59 PHA bins.
# Reduced chi-squared =         0.9658 for     57 degrees of freedom
# Null hypothesis probability =   5.486172e-01

Photon flux (15-150 keV)    in 68.42 sec: 0.281933 ( -0.030989  0.031047 ) ph/cm2/s
Energy fluence (15-150 keV)             : 1.38734e-06 ( -1.66037e-07  1.67743e-07 ) ergs/cm2
Cutoff power-law model
Time interval is from   -5.768 sec. to   62.648 sec.
Spectral model in the cutoff power-law:
------------------------------------------------------------
Parameters  : value       lower 90%   higher 90%
Photon index: -0.877258     ( -0.796516   0.996073 )
Epeak [keV] : 71.0957      ( -18.8478 -71.095 )
Norm@50keV  : 5.39245E-03    ( -0.00327457   0.0125144 )
------------------------------------------------------------
#Fit statistic : Chi-Squared =          52.51 using 59 PHA bins.
# Reduced chi-squared =         0.9377 for     56 degrees of freedom
# Null hypothesis probability =   6.077860e-01

Photon flux (15-150 keV)    in 68.42 sec: 0.273232 ( -0.032556  0.032428 ) ph/cm2/s
Energy fluence (15-150 keV)             : 1.30624e-06 ( -1.87568e-07  1.8942e-07 ) ergs/cm2
1-s peak spectrum fit
Power-law model
Time interval is from    4.764 sec. to    5.764 sec.

Spectral model in power-law:
------------------------------------------------------------
Parameters  : value       lower 90%   higher 90%
Photon index: -1.68945     ( -0.590093   0.559221 )
Norm@50keV  : 6.22025E-03    ( -0.00216004   0.00206579 )
------------------------------------------------------------
#Fit statistic : Chi-Squared =          65.85 using 59 PHA bins.
# Reduced chi-squared =          1.155 for     57 degrees of freedom
# Null hypothesis probability =   1.974067e-01

Photon flux (15-150 keV)    in 1 sec: 0.823132 ( -0.259183  0.260018 ) ph/cm2/s
Energy fluence (15-150 keV)             : 5.76501e-08 ( -2.01364e-08  2.08662e-08 ) ergs/cm2
Cutoff power-law model
Time interval is from    4.764 sec. to    5.764 sec.
Spectral model in the cutoff power-law:
------------------------------------------------------------
Parameters  : value       lower 90%   higher 90%
Photon index: -1.66284     ( -0.905529   2.45414 )
Epeak [keV] : 571.511      ( -534.385 -534.395 )
Norm@50keV  : 6.43350E-03    ( -0.00646639   0.225826 )
------------------------------------------------------------
#Fit statistic : Chi-Squared =          65.84 using 59 PHA bins.
# Reduced chi-squared =          1.176 for     56 degrees of freedom
# Null hypothesis probability =   1.728648e-01

Photon flux (15-150 keV)    in 1 sec: 0.821843 ( -0.263722  0.260587 ) ph/cm2/s
Energy fluence (15-150 keV)             : 5.73971e-08 ( -2.27074e-08  2.09585e-08 ) ergs/cm2
Time-resolved spectra
Distribution
T90 vs. Hardness ratio plot
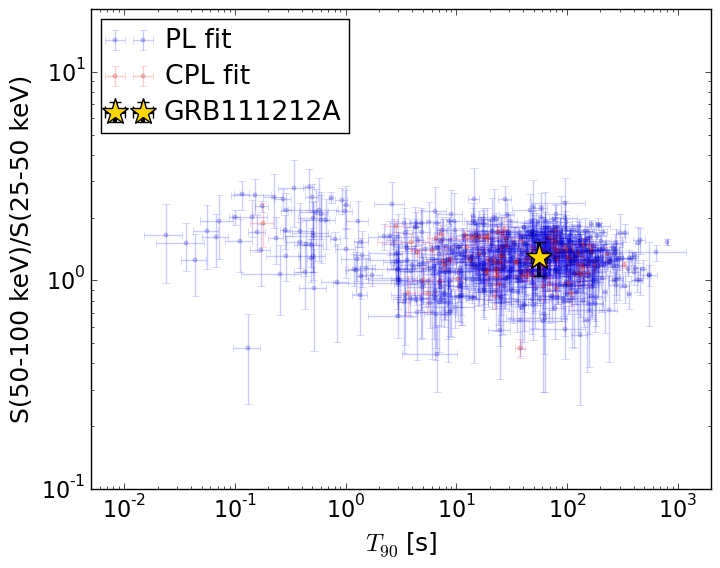
T90                                   = 56.304 sec.
Hardness ratio (energy fluence ratio) = 1.29446448781
S(15-50 keV) vs. S(50-150 keV) plot
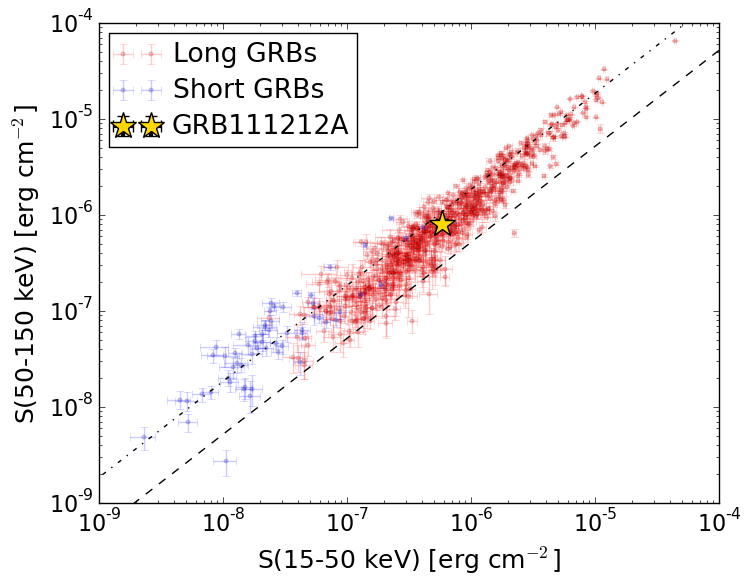
S(15-50 keV)  = 5.783388e-07
S(50-150 keV) = 8.090201e-07
The dash-dotted line and the dashed line traces the fluences calculated from the Band function with Epeak = 15 and 150 keV, respectively. Both lines assume a canonical values of alpha = -1 and beta = -2.5.
Mask shadow pattern
IMX = 3.782290248953952E-01, IMY = 6.267895714224447E-01
Spacecraft aspect plot
Bright source in the pre-burst/pre-slew/post-slew images
Pre-burst image of 15-350 keV band
Time interval of the image:
-239.752000 -5.768000

# RAcent  DECcent POSerr Theta    Phi  PeakCts   SNR AngSep     Name
#  [deg]    [deg]    ['] [deg]  [deg]                   [']
135.5362 -40.5629    0.8  42.2  168.4   5.5647  14.4    0.6	Vela X-1
170.3919 -60.6278    1.8  36.0 -145.3   1.6942   6.4    2.3	Cen X-3
186.7725 -62.6251    9.5  38.5 -132.7   0.4009   1.2    9.3	GX 301-2
 91.9995 -52.5704    2.7  19.4  121.4   0.8830   4.2 ------	UNKNOWN
 18.0342 -36.8426    2.5  45.0   17.4   1.8223   4.7 ------	UNKNOWN
356.7936 -31.1575    2.9  57.2   -0.5   4.7676   4.0 ------	UNKNOWN
190.5762 -51.0674    3.6  49.8 -137.5   2.5570   3.2 ------	UNKNOWN
Pre-slew background subtracted image of 15-350 keV band
Time interval of the image:
-5.768000 47.148600

# RAcent  DECcent POSerr Theta    Phi  PeakCts   SNR AngSep     Name
#  [deg]    [deg]    ['] [deg]  [deg]                   [']
135.6372 -40.6321    7.4  42.1  168.6  -0.2361  -1.6    6.8	Vela X-1
170.5531 -60.6784    4.1  36.0 -145.2  -0.3287  -2.8    7.7	Cen X-3
186.2577 -62.6923    6.9  38.3 -133.0   0.2430   1.7   11.9	GX 301-2
310.4417 -68.5849    0.8  36.2  -58.9   2.0921  13.6 ------	UNKNOWN
Post-slew image of 15-350 keV band
Time interval of the image:
239.748610 962.294300

# RAcent  DECcent POSerr Theta    Phi  PeakCts   SNR AngSep     Name
#  [deg]    [deg]    ['] [deg]  [deg]                   [']
 70.3934  35.2974    3.0  32.2   90.9   2.9173   3.9 ------	UNKNOWN
 46.5450  22.4567    2.7  39.0  132.0   4.3713   4.4 ------	UNKNOWN
 95.4736  50.7263    2.3  31.6   45.1   2.9995   5.0 ------	UNKNOWN
 36.4537  44.7068    3.3  16.6  150.6   1.3072   3.5 ------	UNKNOWN
 36.2596  55.4695    3.0   6.1  162.6   1.4445   3.8 ------	UNKNOWN
 24.8437  77.8700    2.4  17.4  -49.2   1.8848   4.9 ------	UNKNOWN
356.1527  11.4217    3.0  59.1 -166.1  10.7074   3.8 ------	UNKNOWN
339.0940  30.3813    4.1  49.9 -137.8   5.7403   2.8 ------	UNKNOWN
267.8779  69.6385    3.2  44.9  -60.0   7.7377   3.6 ------	UNKNOWN
327.9690  44.7895    3.3  43.8 -116.1   6.8935   3.5 ------	UNKNOWN