Analysis Summary
Notes:
- 1) No attempt has been made to eliminate the non-significant decimal places.
- 2) This batgrbproduct analysis is done using the HEASARC data.
- 3) This batgrbproduct analysis is using the flight position for the mask-weighting calculation.
======================================================================
                  BAT GRB EVENT DATA PROCESSING REPORT
    Process Script Ver: batgrbproduct v2.46
    Process Start Time: Mon Jan 13 17:05:31 EST 2014
             Host Name: batevent1
   Current Working Dir: /local/data/batevent/batevent_reproc/trigger509717
======================================================================

  Trigger: 00509717      Segment: 000

  BAT Trigger Time: 345650656   [s; MET]
      Trigger Stop: 345650976   [s; MET]
               UTC: 2011-12-15T14:04:08.321280    [includes UTCF correction]
       Where From?: TDRSS position message

  BAT
    RA: 349.548231274995   Dec: 32.475567914634  [deg; J2000]

     Catalogged Source?: NO
     Point Source?:      YES
     GRB Indicated?:     NO    [ by BAT flight software ]
     Image S/N Ratio:    8.16
     Image Trigger?:     YES
     Rate S/N Ratio:     0  [ if not an image trigger ]
     Image S/N Ratio:    8.16

  Analysis Position:   [ source = BAT ]
    RA: 349.548231274995   Dec: 32.475567914634  [deg; J2000]

  Refined Position:   [ source = BAT pre-slew burst ]
    RA: 349.548   Dec: 32.4756  [deg; J2000]
        { 23h 18m 11.5s , +32d 28' 32.2" }
        +/- 2.45235028722 [arcmin] (estimated 90% radius based on SNR)
    SNR: 8.44556606931


  Angular difference between the analysis and refined position is 0.011864 arcmin

  Partial Coding Fraction: 0.4648438    [ including projection effects ]

  Duration
     T90: 373.819999992847 +/- 93.2202465729463
        Measured from: 7.60399997234344
                   to: 381.423999965191     [s; relative to TRIGTIME]
     T50: 154.979999959469 +/- 110.461724542731
        Measured from: 129.431999981403
                   to: 284.411999940872     [s; relative to TRIGTIME]


  Fluence
     Peak Flux  (peak 1 second)
        Measured from: 216.347999989986
                   to: 217.347999989986     [s; relative to TRIGTIME]
     Total Fluence
        Measured from: 1.61599999666214
                   to: 411.019999980927     [s; relative to TRIGTIME]

             Band 1     Band 2     Band 3     Band 4
              15-25      25-50     50-100    100-350     keV
 Total     1.302848   1.429054   1.185111   0.260853
           0.169394   0.175700   0.159015   0.146620 [error]
 Peak      0.016779   0.017615   0.024819   0.014824
           0.008662   0.008769   0.007763   0.007037 [error]

     [ fluence units of on-axis counts / fully illuminated detector ]

======================================================================


====== Table of the duration information =============================

        Value   tstart    tstop
T100  409.404    1.616  411.020
T90   373.820    7.604  381.424
T50   154.980  129.432  284.412
Peak    1.000  216.348  217.348


====== Spectral Analysis Summary =====================================

Model      : spectral model: simple power-law (PL) and cutoff power-law (CPL)
Ph_index   : photon index: E^{Ph_index}
Ph_90err   : 90% error of the photon index
Epeak      : Epeak in keV
Epeak_90err: 90% error of Epeak
Norm       : normalization at 50 keV in both the PL model and CPL model
Nomr_90err : 90% error of the normalization
chi2       : Chi-Squared
dof        : degree of freedo

=== Time-averaged spectral analysis ===
(Best model with acceptable fit: PL)

Model Ph_index Ph_90err_low Ph_90err_hi  Epeak  Epeak_90err_low  Epeak_90err_hi  Norm       Nomr_90err_low    Norm_90err_hi    chi2    dof
PL      -1.605    -0.209      0.206       -           -               -         7.08e-04     -9.14e-05          9.05e-05      64.710   57
CPL     -1.155    -0.432      0.852       87.871     -33.995       -87.871      1.24e-03     -5.95e-04          2.26e-03      63.570   56


=== 1-s peak spectral analysis ===
(Best model with acceptable fit: N/A)

Model Ph_index Ph_90err_low Ph_90err_hi  Epeak  Epeak_90err_low  Epeak_90err_hi  Norm       Nomr_90err_low    Norm_90err_hi    chi2    dof
PL      -1.385     -0.781     0.806       -           -               -         4.10e-03     -1.77e-03          1.77e-03      48.420   57
CPL     -0.757     -6.953     0.757      109.286    -109.286      -109.286      8.03e-03     -8.03e-03          8.23e+00      48.250   56


=== Fluence/Peak Flux Summary ===

              Model    Band1     Band2     Band3     Band4     Band5     Total
                       15-25     25-50    50-100    100-350    15-150    15-350    keV
Fluence         PL   4.09e-07  7.04e-07  9.26e-07  2.48e-06  2.71e-06  4.52e-06   erg/cm2
      90%_error_low -7.78e-08 -8.77e-08 -1.55e-07 -7.62e-07 -3.72e-07 -9.18e-07   erg/cm2
      90%_error_hi   8.11e-08  8.74e-08  1.55e-07  9.63e-07  3.77e-07  1.08e-06   erg/cm2
Peak flux       PL   1.51e-01  1.63e-01  1.25e-01  1.56e-01  4.98e-01  5.95e-01   ph/cm2/s
      90%_error_low -1.03e-01 -1.63e-01 -1.25e-01 -1.56e-01 -2.24e-01 -2.57e-01   ph/cm2/s
      90%_error_hi   1.34e-01  7.96e-02  6.13e-02  2.24e-01  2.28e-01  2.60e-01   ph/cm2/s

Fluence        CPL   3.87e-07  7.44e-07  9.41e-07  1.22e-06  2.61e-06  3.29e-06   erg/cm2
      90%_error_low -8.67e-08 -1.08e-07 -1.69e-07 -8.08e-07 -4.10e-07 -9.22e-07   erg/cm2
      90%_error_hi   8.84e-08  1.13e-07  1.69e-07  1.90e-06  4.11e-07  1.63e-06   erg/cm2
Peak flux      CPL   1.30e-01  1.70e-01  1.34e-01  8.97e-02  4.84e-01  5.24e-01   ph/cm2/s
      90%_error_low -1.30e-01 -1.70e-01 -7.08e-02 -8.97e-02 -2.62e-01 -3.00e-01   ph/cm2/s
      90%_error_hi   1.50e-01  9.36e-02  8.34e-02  1.21e-01  2.35e-01  3.12e-01   ph/cm2/s

======================================================================
Image
Pre-slew 15.0-50.0 keV image (Event data)
#RAcent DECcent POSerr Theta  Phi  Peak_Cts  SNR Name
349.548 32.476 0.000 42.307 -26.439 2.447 8.446 TRIG_00509717

Image time interval: 0.000 to 320.000 [sec]
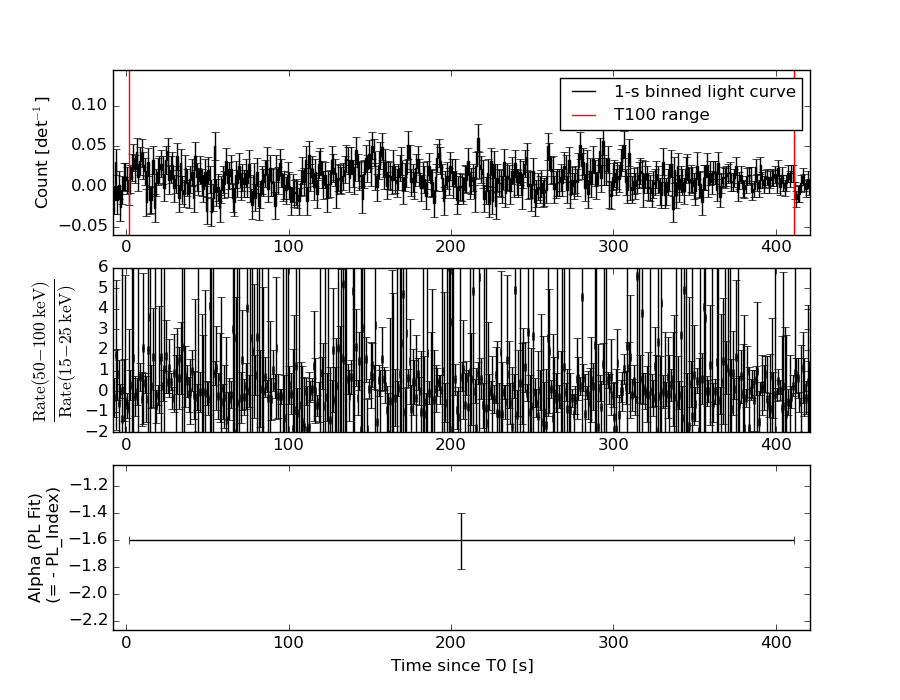
Light Curves
Note: The mask-weighted lightcurves have units of either count/det or counts/sec/det, where a det is 0.4 x 0.4 = 0.16 sq cm.
Full-time range; 1 s binning
Other quick-look light curves:
- 64 ms binning (zoomed)
- 16 ms binning (zoomed)
- 8 ms binning (zoomed)
- 2 ms binning (zoomed)
- SN=5 or 10 s binning (full-time range)
- Raw light curve
Spectra
- 64 ms binning (zoomed)
- 16 ms binning (zoomed)
- 8 ms binning (zoomed)
- 2 ms binning (zoomed)
- SN=5 or 10 s binning (full-time range)
- Raw light curve
Spectra
Notes:
- 1) The fitting includes the systematic errors.
- 2) When the burst includes telescope slew time periods, the fitting uses an average response file made from multiple 5-s response files through out the slew time plus single time preiod for the non-slew times, and weighted by the total counts in the corresponding time period using addrmf. An average response file is needed becuase a spectral fit using the pre-slew DRM will introduce some errors in both a spectral shape and a normalization if the PHA file contains a lot of the slew/post-slew time interval.
- 3) For fits to more complicated models (e.g. a power-law over a cutoff power-law), the BAT team has decided to require a chi-square improvement of more than 6 for each extra dof.
Time averaged spectrum fit using the average DRM
Power-law model

Time interval is from    1.616 sec. to  411.020 sec.

Spectral model in power-law:
------------------------------------------------------------
Parameters  : value       lower 90%   higher 90%
Photon index: -1.60499     ( -0.209392   0.206021 )
Norm@50keV  : 7.08415E-04    ( -9.14009e-05   9.04605e-05 )
------------------------------------------------------------
#Fit statistic : Chi-Squared =          64.71 using 59 PHA bins.
# Reduced chi-squared =          1.135 for     57 degrees of freedom
# Null hypothesis probability =   2.256178e-01

Photon flux (15-150 keV)    in 409.4 sec: 9.11790E-02 ( -0.0112514  0.011266 ) ph/cm2/s
Energy fluence (15-150 keV)             : 2.71105e-06 ( -3.71956e-07  3.76811e-07 ) ergs/cm2
Cutoff power-law model
Time interval is from    1.616 sec. to  411.020 sec.
Spectral model in the cutoff power-law:
------------------------------------------------------------
Parameters  : value       lower 90%   higher 90%
Photon index: -1.15545     ( -0.432135   0.852348 )
Epeak [keV] : 87.8706      ( -34.0009 -87.8763 )
Norm@50keV  : 1.23526E-03    ( -0.00059493   0.00226045 )
------------------------------------------------------------
#Fit statistic : Chi-Squared =          63.57 using 59 PHA bins.
# Reduced chi-squared =          1.135 for     56 degrees of freedom
# Null hypothesis probability =   2.273739e-01

Photon flux (15-150 keV)    in 409.4 sec: 8.97410E-02 ( -0.0114757  0.011488 ) ph/cm2/s
Energy fluence (15-150 keV)             : 2.60758e-06 ( -4.09981e-07  4.11107e-07 ) ergs/cm2
1-s peak spectrum fit
Power-law model
Time interval is from  216.348 sec. to  217.348 sec.

Spectral model in power-law:
------------------------------------------------------------
Parameters  : value       lower 90%   higher 90%
Photon index: -1.38511     ( -0.780848   0.805627 )
Norm@50keV  : 4.10487E-03    ( -0.00176925   0.00176695 )
------------------------------------------------------------
#Fit statistic : Chi-Squared =          48.42 using 59 PHA bins.
# Reduced chi-squared =         0.8494 for     57 degrees of freedom
# Null hypothesis probability =   7.837407e-01

Photon flux (15-150 keV)    in 1 sec: 0.498241 ( -0.223911  0.227791 ) ph/cm2/s
Energy fluence (15-150 keV)             : 3.97915e-08 ( -1.80825e-08  1.84765e-08 ) ergs/cm2
Cutoff power-law model

Time interval is from  216.348 sec. to  217.348 sec.
Spectral model in the cutoff power-law:
------------------------------------------------------------
Parameters  : value       lower 90%   higher 90%
Photon index: -0.75715     ( -6.95224   0.757876 )
Epeak [keV] : 109.286      ( -109.35 -109.35 )
Norm@50keV  : 8.02696E-03    ( -0.00802131   8.23012 )
------------------------------------------------------------
#Fit statistic : Chi-Squared =          48.25 using 59 PHA bins.
# Reduced chi-squared =         0.8617 for     56 degrees of freedom
# Null hypothesis probability =   7.595500e-01

Photon flux (15-150 keV)    in 1 sec: 0.484446 ( -0.261872  0.234672 ) ph/cm2/s
Energy fluence (15-150 keV)             : 3.87552e-08 ( -1.83571e-08  1.89746e-08 ) ergs/cm2
Time-resolved spectra
Distribution
T90 vs. Hardness ratio plot
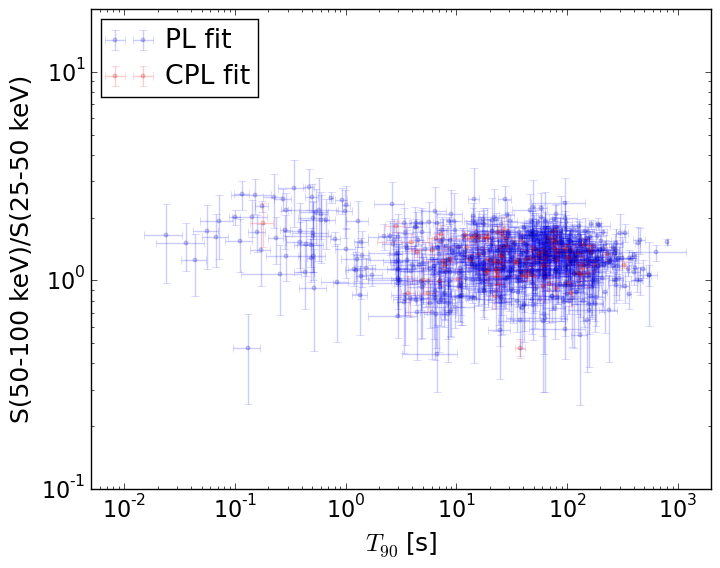
T90                                   = N/A sec.
Hardness ratio (energy fluence ratio) = N/A
S(15-50 keV) vs. S(50-150 keV) plot
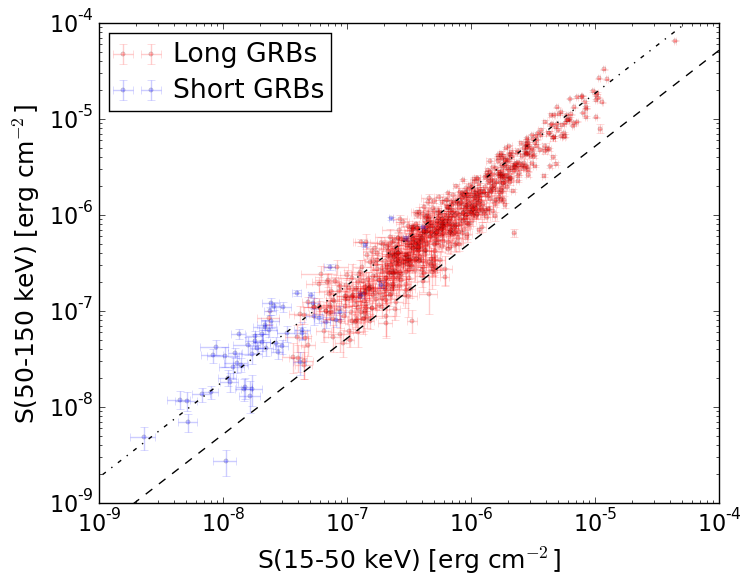
S(15-50 keV)  = N/A
S(50-150 keV) = N/A
The dash-dotted line and the dashed line traces the fluences calculated from the Band function with Epeak = 15 and 150 keV, respectively. Both lines assume a canonical values of alpha = -1 and beta = -2.5.
Mask shadow pattern

IMX = 0.814948701689, IMY = 0.405239122531
Spacecraft aspect plot

Bright source in the pre-burst/pre-slew/post-slew images
Pre-burst image of 15-350 keV band
Time interval of the image:
-129.599400 1.616000

# RAcent  DECcent POSerr Theta    Phi  PeakCts   SNR AngSep     Name
#  [deg]    [deg]    ['] [deg]  [deg]                   [']
 32.4519  58.3202    2.5  50.3   26.9   3.4297   4.7 ------	UNKNOWN
336.2419  22.2211    3.0  50.7  -44.7   2.8360   3.9 ------	UNKNOWN
352.2990 -14.4565    3.6  41.2 -100.0   2.3435   3.2 ------	UNKNOWN
Pre-slew background subtracted image of 15-350 keV band
Time interval of the image:
1.616000 344.900600

# RAcent  DECcent POSerr Theta    Phi  PeakCts   SNR AngSep     Name
#  [deg]    [deg]    ['] [deg]  [deg]                   [']
 53.3910  26.4740    2.0  31.0   73.8   4.2474   5.7 ------	UNKNOWN
 30.7926  32.4273    2.3  24.5   31.0   2.3147   5.1 ------	UNKNOWN
 15.8273  33.6318    2.1  27.4    2.7   2.2057   5.6 ------	UNKNOWN
 15.8043   8.1034    2.3  11.1  -66.5   1.8584   5.0 ------	UNKNOWN
 15.3421   0.0213    1.9  14.2 -101.4   2.2971   6.0 ------	UNKNOWN
  5.9883  15.4689    1.9  21.8  -45.4   2.4256   6.2 ------	UNKNOWN
 17.3493 -24.0253    2.4  33.6 -140.8   2.3669   4.8 ------	UNKNOWN
342.0557   9.8185    2.8  44.4  -61.1   6.4574   4.1 ------	UNKNOWN
351.2147 -11.8865    2.4  40.8  -95.8   6.7977   4.8 ------	UNKNOWN
Post-slew image of 15-350 keV band
Time interval of the image:
406.300600 963.080000

# RAcent  DECcent POSerr Theta    Phi  PeakCts   SNR AngSep     Name
#  [deg]    [deg]    ['] [deg]  [deg]                   [']
299.5799  35.1906    0.5  41.2  -50.4  18.6224  22.5    0.8	Cyg X-1
308.1072  40.9485    1.9  34.0  -42.0   2.9671   5.9    0.3	Cyg X-3
326.1063  38.2336    5.7  19.9  -45.1   0.6911   2.0    6.1	Cyg X-2
 31.4296  43.7843    3.0  34.4   80.1   3.1908   3.9 ------	UNKNOWN
 28.6887  37.8487    3.1  32.2   90.9   2.6339   3.8 ------	UNKNOWN
 13.0254  -4.3043    2.6  43.0  166.0   3.3635   4.5 ------	UNKNOWN
349.5387  32.4866    1.5   0.0  -83.7   2.5633   7.6 ------	UNKNOWN
275.7203  60.9961    3.3  54.3  -13.4   3.6143   3.5 ------	UNKNOWN
328.5634 -11.6184    2.2  48.5 -130.4   9.1486   5.2 ------	UNKNOWN