Analysis Summary
Notes:
- 1) No attempt has been made to eliminate the non-significant decimal places.
- 2) This batgrbproduct analysis is done using the HEASARC data.
- 3) This batgrbproduct analysis is using the flight position for the mask-weighting calculation.
======================================================================
                  BAT GRB EVENT DATA PROCESSING REPORT
    Process Script Ver: batgrbproduct v2.46
    Process Start Time: Mon Jan 13 16:59:46 EST 2014
             Host Name: batevent1
   Current Working Dir: /local/data/batevent/batevent_reproc/trigger510341
======================================================================

  Trigger: 00510341      Segment: 000

  BAT Trigger Time: 346477845.504   [s; MET]
      Trigger Stop: 346477849.6   [s; MET]
               UTC: 2011-12-25T03:50:37.792220    [includes UTCF correction]
       Where From?: TDRSS position message

  BAT
    RA: 13.1017626462844   Dec: 51.5887628616773  [deg; J2000]

     Catalogged Source?: NO
     Point Source?:      YES
     GRB Indicated?:     YES    [ by BAT flight software ]
     Image S/N Ratio:    7.52
     Image Trigger?:     NO
     Rate S/N Ratio:     10.3923048454133  [ if not an image trigger ]
     Image S/N Ratio:    7.52

  Analysis Position:   [ source = BAT ]
    RA: 13.1017626462844   Dec: 51.5887628616773  [deg; J2000]

  Refined Position:   [ source = BAT pre-slew burst ]
    RA: 13.1510190605348   Dec: 51.5705410941366  [deg; J2000]
        { 00h 52m 36.2s , +51d 34' 13.9" }
         +/- 1.29070227715879 [arcmin] (estimated 90% radius based on SNR)
         +/- 0.444603555670905 [arcmin] (formal 1-sigma fit error)
    SNR: 21.1249365835153

  Angular difference between the analysis and refined position is 2.137345 arcmin

  Partial Coding Fraction: 0.9375    [ including projection effects ]

  Duration
     T90: 105.728000044823 +/- 26.179375076043
        Measured from: -7.216000020504
                   to: 98.5120000243187     [s; relative to TRIGTIME]
     T50: 43.8720000386238 +/- 12.810165975541
        Measured from: -0.368000030517578
                   to: 43.5040000081062     [s; relative to TRIGTIME]


  Fluence
     Peak Flux  (peak 1 second)
        Measured from: -4.36400002241135
                   to: -3.36400002241135     [s; relative to TRIGTIME]
     Total Fluence
        Measured from: -10.0480000376701
                   to: 111.231999993324     [s; relative to TRIGTIME]

             Band 1     Band 2     Band 3     Band 4
              15-25      25-50     50-100    100-350     keV
 Total     0.755705   0.905834   0.520344   0.061115
           0.060862   0.062466   0.056075   0.050219 [error]
 Peak      0.022966   0.041136   0.012834   0.006585
           0.005809   0.005936   0.005358   0.004538 [error]

     [ fluence units of on-axis counts / fully illuminated detector ]

======================================================================


====== Table of the duration information =============================

        Value   tstart    tstop
T100  121.280  -10.048  111.232
T90   105.728   -7.216   98.512
T50    43.872   -0.368   43.504
Peak    1.000   -4.364   -3.364


====== Spectral Analysis Summary =====================================

Model      : spectral model: simple power-law (PL) and cutoff power-law (CPL)
Ph_index   : photon index: E^{Ph_index}
Ph_90err   : 90% error of the photon index
Epeak      : Epeak in keV
Epeak_90err: 90% error of Epeak
Norm       : normalization at 50 keV in both the PL model and CPL model
Nomr_90err : 90% error of the normalization
chi2       : Chi-Squared
dof        : degree of freedo

=== Time-averaged spectral analysis ===
(Best model with acceptable fit: PL)

Model Ph_index Ph_90err_low Ph_90err_hi  Epeak  Epeak_90err_low  Epeak_90err_hi  Norm       Nomr_90err_low    Norm_90err_hi    chi2    dof
PL      -1.746    -0.154      0.150       -           -               -         1.12e-03     -1.07e-04          1.06e-04      59.010   57
CPL     -1.299    -0.519      0.713       68.227     -19.220       -68.227      2.00e-03     -9.47e-04          3.00e-03      57.480   56


=== 1-s peak spectral analysis ===
(Best model with acceptable fit: N/A)

Model Ph_index Ph_90err_low Ph_90err_hi  Epeak  Epeak_90err_low  Epeak_90err_hi  Norm       Nomr_90err_low    Norm_90err_hi    chi2    dof
PL      -1.745     -0.379     0.352       -           -               -         4.79e-03     -1.21e-03          1.17e-03      77.750   57
CPL      0.367     -2.101     5.802       43.951     -10.328       245.555      8.72e-02     -8.72e-02          2.88e+02      74.910   56


=== Fluence/Peak Flux Summary ===

              Model    Band1     Band2     Band3     Band4     Band5     Total
                       15-25     25-50    50-100    100-350    15-150    15-350    keV
Fluence         PL   2.19e-07  3.47e-07  4.14e-07  9.60e-07  1.26e-06  1.94e-06   erg/cm2
      90%_error_low -2.71e-08 -2.83e-08 -5.37e-08 -2.32e-07 -1.24e-07 -2.89e-07   erg/cm2
      90%_error_hi   2.78e-08  2.83e-08  5.42e-08  2.79e-07  1.26e-07  3.27e-07   erg/cm2
Peak flux       PL   2.50e-01  2.17e-01  1.30e-01  1.17e-01  6.47e-01  7.14e-01   ph/cm2/s
      90%_error_low -7.27e-02 -4.58e-02 -4.12e-02 -5.81e-02 -1.36e-01 -1.55e-01   ph/cm2/s
      90%_error_hi   7.66e-02  4.58e-02  4.21e-02  8.52e-02  1.36e-01  1.58e-01   ph/cm2/s

Fluence        CPL   2.09e-07  3.66e-07  4.10e-07  4.38e-07  1.19e-06  1.42e-06   erg/cm2
      90%_error_low -3.09e-08 -3.78e-08 -6.02e-08 -2.74e-07 -1.49e-07 -3.18e-07   erg/cm2
      90%_error_hi   3.09e-08  3.91e-08  5.81e-08  6.03e-07  1.53e-07  6.37e-07   erg/cm2
Peak flux      CPL   2.07e-01  2.79e-01  1.07e-01  7.04e-03  5.99e-01  6.00e-01   ph/cm2/s
      90%_error_low -9.53e-02 -7.68e-02 -1.07e-01 -7.04e-03 -1.42e-01 -1.43e-01   ph/cm2/s
      90%_error_hi   9.07e-02  8.36e-02  6.11e-02  1.06e-01  1.44e-01  1.52e-01   ph/cm2/s

======================================================================
Image
Pre-slew 15.0-350.0 keV image (Event data)

#   RAcent    DECcent   POSerr    Theta     Phi              Peak Cts       SNR   Name
   13.1510    51.5705   0.0091    17.5515  -137.5648         1.6335769     21.125 TRIG_00510341

Foreground time interval of the image:
-10.048  34.797 (delta_t =  44.845 [sec])
Background time interval of the image:
-239.504 -10.048 (delta_t = 229.456 [sec])
Light Curves
Note: The mask-weighted lightcurves have units of either count/det or counts/sec/det, where a det is 0.4 x 0.4 = 0.16 sq cm.
Full-time range; 1 s binning
Other quick-look light curves:
- 64 ms binning (zoomed)
- 16 ms binning (zoomed)
- 8 ms binning (zoomed)
- 2 ms binning (zoomed)
- SN=5 or 10 s binning (full-time range)
- Raw light curve
Spectra
- 64 ms binning (zoomed)
- 16 ms binning (zoomed)
- 8 ms binning (zoomed)
- 2 ms binning (zoomed)
- SN=5 or 10 s binning (full-time range)
- Raw light curve
Spectra
Notes:
- 1) The fitting includes the systematic errors.
- 2) When the burst includes telescope slew time periods, the fitting uses an average response file made from multiple 5-s response files through out the slew time plus single time preiod for the non-slew times, and weighted by the total counts in the corresponding time period using addrmf. An average response file is needed becuase a spectral fit using the pre-slew DRM will introduce some errors in both a spectral shape and a normalization if the PHA file contains a lot of the slew/post-slew time interval.
- 3) For fits to more complicated models (e.g. a power-law over a cutoff power-law), the BAT team has decided to require a chi-square improvement of more than 6 for each extra dof.
Time averaged spectrum fit using the average DRM
Power-law model

Time interval is from  -10.048 sec. to  111.232 sec.

Spectral model in power-law:
------------------------------------------------------------
Parameters  : value       lower 90%   higher 90%
Photon index: -1.74621     ( -0.154005   0.149902 )
Norm@50keV  : 1.12364E-03    ( -0.000107193   0.000105582 )
------------------------------------------------------------
#Fit statistic : Chi-Squared =          59.01 using 59 PHA bins.
# Reduced chi-squared =          1.035 for     57 degrees of freedom
# Null hypothesis probability =   4.018619e-01

Photon flux (15-150 keV)    in 121.3 sec: 0.151730 ( -0.012433  0.012436 ) ph/cm2/s
Energy fluence (15-150 keV)             : 1.25815e-06 ( -1.23815e-07  1.26059e-07 ) ergs/cm2
Cutoff power-law model

Time interval is from  -10.048 sec. to  111.232 sec.
Spectral model in the cutoff power-law:
------------------------------------------------------------
Parameters  : value       lower 90%   higher 90%
Photon index: -1.29877     ( -0.519446   0.713474 )
Epeak [keV] : 68.2266      ( -19.2197 -68.2262 )
Norm@50keV  : 2.00173E-03    ( -0.000947296   0.0029981 )
------------------------------------------------------------
#Fit statistic : Chi-Squared =          57.48 using 59 PHA bins.
# Reduced chi-squared =          1.026 for     56 degrees of freedom
# Null hypothesis probability =   4.200352e-01

Photon flux (15-150 keV)    in 121.3 sec: 0.148562 ( -0.013181  0.013139 ) ph/cm2/s
Energy fluence (15-150 keV)             : 1.1933e-06 ( -1.48557e-07  1.52776e-07 ) ergs/cm2
1-s peak spectrum fit
Power-law model

Time interval is from   -4.364 sec. to   -3.364 sec.

Spectral model in power-law:
------------------------------------------------------------
Parameters  : value       lower 90%   higher 90%
Photon index: -1.74464     ( -0.379416   0.351731 )
Norm@50keV  : 4.79445E-03    ( -0.00121066   0.001173 )
------------------------------------------------------------
#Fit statistic : Chi-Squared =          77.75 using 59 PHA bins.
# Reduced chi-squared =          1.364 for     57 degrees of freedom
# Null hypothesis probability =   3.525379e-02

Photon flux (15-150 keV)    in 1 sec: 0.647044 ( -0.136211  0.136211 ) ph/cm2/s
Energy fluence (15-150 keV)             : 4.42619e-08 ( -1.12227e-08  1.1701e-08 ) ergs/cm2
Cutoff power-law model

Time interval is from   -4.364 sec. to   -3.364 sec.
Spectral model in the cutoff power-law:
------------------------------------------------------------
Parameters  : value       lower 90%   higher 90%
Photon index: 0.366705     ( -2.24748   5.65631 )
Epeak [keV] : 43.9508      ( -9.59556 246.287 )
Norm@50keV  : 8.72423E-02    ( -0.130491   287.991 )
------------------------------------------------------------
#Fit statistic : Chi-Squared =          74.91 using 59 PHA bins.
# Reduced chi-squared =          1.338 for     56 degrees of freedom
# Null hypothesis probability =   4.655088e-02

Photon flux (15-150 keV)    in 1 sec: 0.599175 ( -0.142434  0.1439 ) ph/cm2/s
Energy fluence (15-150 keV)             : 3.46521e-08 ( -9.98376e-09  1.44082e-08 ) ergs/cm2
Time-resolved spectra

Distribution
T90 vs. Hardness ratio plot
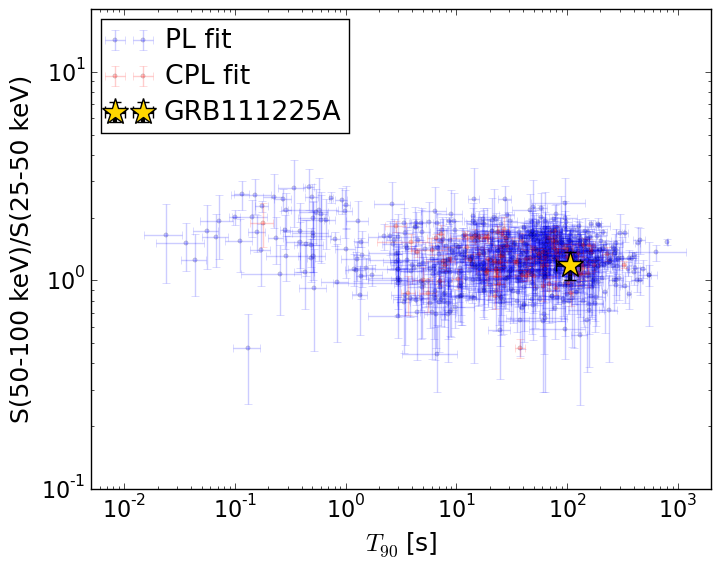
T90                                   = 105.728 sec.
Hardness ratio (energy fluence ratio) = 1.19236682535
S(15-50 keV) vs. S(50-150 keV) plot

S(15-50 keV)  = 5.66388e-07
S(50-150 keV) = 6.9175e-07
The dash-dotted line and the dashed line traces the fluences calculated from the Band function with Epeak = 15 and 150 keV, respectively. Both lines assume a canonical values of alpha = -1 and beta = -2.5.
Mask shadow pattern

IMX = -2.334325516077084E-01, IMY = 2.134160851587494E-01
Spacecraft aspect plot

Bright source in the pre-burst/pre-slew/post-slew images
Pre-burst image of 15-350 keV band
Time interval of the image:
-239.504000 -10.048000

# RAcent  DECcent POSerr Theta    Phi  PeakCts   SNR AngSep     Name
#  [deg]    [deg]    ['] [deg]  [deg]                   [']
 82.9200  53.9723    2.7  23.6   61.8   1.0515   4.3 ------	UNKNOWN
105.3448  63.8587    2.6  28.9   29.4   0.9286   4.5 ------	UNKNOWN
345.2744  27.7180    2.8  49.2 -133.7   3.5621   4.2 ------	UNKNOWN
322.9180  52.0906    3.8  40.8  -93.0   2.9057   3.1 ------	UNKNOWN
Pre-slew background subtracted image of 15-350 keV band
Time interval of the image:
-10.048000 34.796620

# RAcent  DECcent POSerr Theta    Phi  PeakCts   SNR AngSep     Name
#  [deg]    [deg]    ['] [deg]  [deg]                   [']
117.7191  49.4308    2.5  42.9   42.5   1.0308   4.7 ------	UNKNOWN
 13.1510  51.5706    0.5  17.6 -137.6   1.6337  21.1 ------	UNKNOWN
  5.2019  53.0108    2.3  20.3 -124.4   0.4148   5.1 ------	UNKNOWN
307.0137  60.5646    2.4  41.4  -74.5   1.5133   4.8 ------	UNKNOWN
Post-slew image of 15-350 keV band
Time interval of the image:
76.796600 962.645900

# RAcent  DECcent POSerr Theta    Phi  PeakCts   SNR AngSep     Name
#  [deg]    [deg]    ['] [deg]  [deg]                   [']
326.3728  38.3694   40.4  34.9  -85.6  -0.3844  -0.3    9.9	Cyg X-2
 99.1047  65.7071    3.1  42.9   45.1   6.7267   3.8 ------	UNKNOWN
 74.0977  65.2596    2.3  33.1   50.1   4.9467   5.0 ------	UNKNOWN
359.2853  43.0742    3.1  12.6 -119.0   2.0308   3.8 ------	UNKNOWN
249.1867  73.0915    3.7  49.5  -10.5   3.3371   3.1 ------	UNKNOWN
274.9566  62.2614    3.0  49.3  -29.4   4.6213   3.9 ------	UNKNOWN
258.9197  58.6340    3.8  57.5  -26.2   9.7088   3.0 ------	UNKNOWN