Analysis Summary
Notes:
- 1) No attempt has been made to eliminate the non-significant decimal places.
- 2) This batgrbproduct analysis is done using the HEASARC data.
- 3) This batgrbproduct analysis is using the flight position for the mask-weighting calculation.
======================================================================
BAT GRB EVENT DATA PROCESSING REPORT
Process Script Ver: batgrbproduct v2.46
Process Start Time: Mon Jan 13 16:55:47 EST 2014
Host Name: batevent1
Current Working Dir: /local/data/batevent/batevent_reproc/trigger510649
======================================================================
Trigger: 00510649 Segment: 000
BAT Trigger Time: 346779891.328 [s; MET]
Trigger Stop: 346779895.424 [s; MET]
UTC: 2011-12-28T15:44:43.604140 [includes UTCF correction]
Where From?: TDRSS position message
BAT
RA: 150.079150215553 Dec: 18.2930458291051 [deg; J2000]
Catalogged Source?: NO
Point Source?: YES
GRB Indicated?: YES [ by BAT flight software ]
Image S/N Ratio: 11.28
Image Trigger?: NO
Rate S/N Ratio: 16.8226038412607 [ if not an image trigger ]
Image S/N Ratio: 11.28
Analysis Position: [ source = BAT ]
RA: 150.079150215553 Dec: 18.2930458291051 [deg; J2000]
Refined Position: [ source = BAT pre-slew burst ]
RA: 150.063406629793 Dec: 18.2839902929703 [deg; J2000]
{ 10h 00m 15.2s , +18d 17' 02.4" }
+/- 1.36453502228945 [arcmin] (estimated 90% radius based on SNR)
+/- 0.498353257920842 [arcmin] (formal 1-sigma fit error)
SNR: 19.5111610243057
Angular difference between the analysis and refined position is 1.048638 arcmin
Partial Coding Fraction: 0.3984375 [ including projection effects ]
Duration
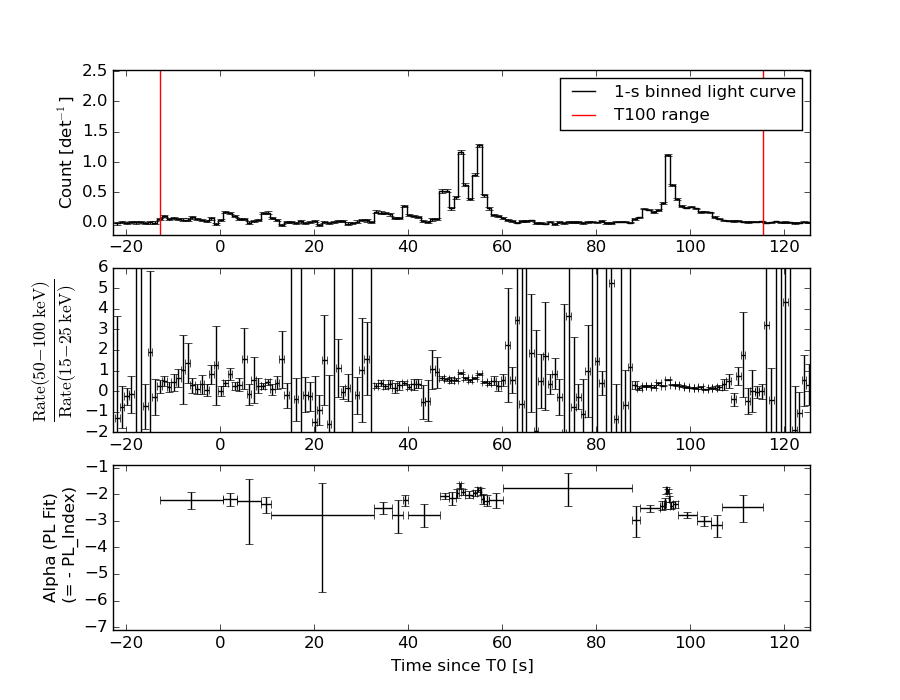
T90: 101.243999898434 +/- 5.44842881534183
Measured from: 0.860000014305115
to: 102.103999912739 [s; relative to TRIGTIME]
T50: 47.1199999451637 +/- 0.621288984982854
Measured from: 47.5479999780655
to: 94.6679999232292 [s; relative to TRIGTIME]
Fluence
Peak Flux (peak 1 second)
Measured from: 54.555999994278
to: 55.555999994278 [s; relative to TRIGTIME]
Total Fluence
Measured from: -12.8199999928474
to: 115.427999973297 [s; relative to TRIGTIME]
Band 1 Band 2 Band 3 Band 4
15-25 25-50 50-100 100-350 keV
Total 6.759982 5.890567 2.947174 0.441440
0.106460 0.107641 0.094899 0.083936 [error]
Peak 0.413764 0.527503 0.345156 0.062634
0.016230 0.017633 0.014891 0.010123 [error]
[ fluence units of on-axis counts / fully illuminated detector ]
======================================================================
====== Table of the duration information =============================
Value tstart tstop
T100 128.248 -12.820 115.428
T90 101.244 0.860 102.104
T50 47.120 47.548 94.668
Peak 1.000 54.556 55.556
====== Spectral Analysis Summary =====================================
Model : spectral model: simple power-law (PL) and cutoff power-law (CPL)
Ph_index : photon index: E^{Ph_index}
Ph_90err : 90% error of the photon index
Epeak : Epeak in keV
Epeak_90err: 90% error of Epeak
Norm : normalization at 50 keV in both the PL model and CPL model
Nomr_90err : 90% error of the normalization
chi2 : Chi-Squared
dof : degree of freedo
=== Time-averaged spectral analysis ===
(Best model with acceptable fit: PL)
Model Ph_index Ph_90err_low Ph_90err_hi Epeak Epeak_90err_low Epeak_90err_hi Norm Nomr_90err_low Norm_90err_hi chi2 dof
PL -2.221 -0.062 0.061 - - - 6.84e-03 -2.12e-04 2.11e-04 59.680 57
CPL -1.994 1.994 1.994 1.367 -0.318 0.556 8.79e-03 -3.72e-04 5.69e-04 61.600 56
=== 1-s peak spectral analysis ===
(Best model with acceptable fit: PL)
Model Ph_index Ph_90err_low Ph_90err_hi Epeak Epeak_90err_low Epeak_90err_hi Norm Nomr_90err_low Norm_90err_hi chi2 dof
PL -1.834 -0.076 0.075 - - - 8.76e-02 -3.73e-03 3.72e-03 53.620 57
CPL -1.644 -0.241 0.296 93.714 -34.045 -93.714 1.09e-01 -2.41e-02 4.35e-02 52.280 56
=== Fluence/Peak Flux Summary ===
Model Band1 Band2 Band3 Band4 Band5 Total
15-25 25-50 50-100 100-350 15-150 15-350 keV
Fluence PL 2.21e-06 2.63e-06 2.26e-06 3.30e-06 8.27e-06 1.04e-05 erg/cm2
90%_error_low -1.13e-07 -7.41e-08 -1.01e-07 -3.13e-07 -2.29e-07 -3.88e-07 erg/cm2
90%_error_hi 1.16e-07 7.40e-08 1.01e-07 3.35e-07 2.30e-07 4.01e-07 erg/cm2
Peak flux PL 4.97e+00 4.11e+00 2.31e+00 1.91e+00 1.22e+01 1.33e+01 ph/cm2/s
90%_error_low -3.52e-01 -1.78e-01 -1.26e-01 -2.07e-01 -5.34e-01 -5.42e-01 ph/cm2/s
90%_error_hi 3.61e-01 1.77e-01 1.26e-01 2.21e-01 5.36e-01 5.43e-01 ph/cm2/s
Fluence CPL 2.10e-06 2.61e-06 2.26e-06 2.03e-06 8.06e-06 9.44e-06 erg/cm2
90%_error_low -6.83e-08 -2.79e-08 -8.59e-08 3.12e-08 -1.98e-07 -4.22e-07 erg/cm2
90%_error_hi 8.77e-08 1.25e-07 1.17e-07 7.46e-07 2.81e-07 5.11e-07 erg/cm2
Peak flux CPL 4.79e+00 4.17e+00 2.34e+00 1.54e+00 1.21e+01 1.28e+01 ph/cm2/s
90%_error_low -4.31e-01 -2.00e-01 -1.36e-01 -4.16e-01 -5.71e-01 -7.52e-01 ph/cm2/s
90%_error_hi 4.40e-01 2.03e-01 1.38e-01 4.53e-01 5.72e-01 8.18e-01 ph/cm2/s
======================================================================
Image
Pre-slew 15.0-350.0 keV image (Event data)
#   RAcent    DECcent   POSerr    Theta     Phi              Peak Cts       SNR   Name
  150.0634    18.2840   0.0099    41.3190    13.0057         3.3234719     19.511 TRIG_00510649

Foreground time interval of the image:
-12.820  40.573 (delta_t =  53.393 [sec])
Background time interval of the image:
-239.328 -12.820 (delta_t = 226.508 [sec])
Light Curves
Note: The mask-weighted lightcurves have units of either count/det or counts/sec/det, where a det is 0.4 x 0.4 = 0.16 sq cm.
Full-time range; 1 s binning
Other quick-look light curves:
- 64 ms binning (zoomed)
- 16 ms binning (zoomed)
- 8 ms binning (zoomed)
- 2 ms binning (zoomed)
- SN=5 or 10 s binning (full-time range)
- Raw light curve
Spectra
- 64 ms binning (zoomed)
- 16 ms binning (zoomed)
- 8 ms binning (zoomed)
- 2 ms binning (zoomed)
- SN=5 or 10 s binning (full-time range)
- Raw light curve
Spectra
Notes:
- 1) The fitting includes the systematic errors.
- 2) When the burst includes telescope slew time periods, the fitting uses an average response file made from multiple 5-s response files through out the slew time plus single time preiod for the non-slew times, and weighted by the total counts in the corresponding time period using addrmf. An average response file is needed becuase a spectral fit using the pre-slew DRM will introduce some errors in both a spectral shape and a normalization if the PHA file contains a lot of the slew/post-slew time interval.
- 3) For fits to more complicated models (e.g. a power-law over a cutoff power-law), the BAT team has decided to require a chi-square improvement of more than 6 for each extra dof.
Time averaged spectrum fit using the average DRM
Power-law model
Time interval is from  -12.820 sec. to  115.428 sec.

Spectral model in power-law:
------------------------------------------------------------
Parameters  : value       lower 90%   higher 90%
Photon index: -2.22061     ( -0.0620512   0.0613036 )
Norm@50keV  : 6.84058E-03    ( -0.000212105   0.000210881 )
------------------------------------------------------------
#Fit statistic : Chi-Squared =          59.68 using 59 PHA bins.
# Reduced chi-squared =          1.047 for     57 degrees of freedom
# Null hypothesis probability =   3.783704e-01

Photon flux (15-150 keV)    in 128.2 sec: 1.14501 ( -0.03727  0.03759 ) ph/cm2/s
Energy fluence (15-150 keV)             : 8.27176e-06 ( -2.29315e-07  2.29593e-07 ) ergs/cm2
Cutoff power-law model
Time interval is from  -12.820 sec. to  115.428 sec.
Spectral model in the cutoff power-law:
------------------------------------------------------------
Parameters  : value       lower 90%   higher 90%
Photon index: -1.9939     ( 1.9939   1.9939 )
Epeak [keV] : 1.36704      ( -0.318416 0.555774 )
Norm@50keV  : 8.78820E-03    ( -0.000371905   0.000569178 )
------------------------------------------------------------
#Fit statistic : Chi-Squared =          61.60 using 59 PHA bins.
# Reduced chi-squared =          1.100 for     56 degrees of freedom
# Null hypothesis probability =   2.826166e-01

Photon flux (15-150 keV)    in 128.2 sec: 1.11201 ( -0.02867  0.03579 ) ph/cm2/s
Energy fluence (15-150 keV)             : 8.05858e-06 ( -1.97752e-07  2.80503e-07 ) ergs/cm2
1-s peak spectrum fit
Power-law model
Time interval is from   54.556 sec. to   55.556 sec.

Spectral model in power-law:
------------------------------------------------------------
Parameters  : value       lower 90%   higher 90%
Photon index: -1.83354     ( -0.0755567   0.0747641 )
Norm@50keV  : 8.76024E-02    ( -0.00373315   0.0037189 )
------------------------------------------------------------
#Fit statistic : Chi-Squared =          53.62 using 59 PHA bins.
# Reduced chi-squared =         0.9407 for     57 degrees of freedom
# Null hypothesis probability =   6.025669e-01

Photon flux (15-150 keV)    in 1 sec: 12.2327 ( -0.5344  0.5358 ) ph/cm2/s
Energy fluence (15-150 keV)             : 8.05842e-07 ( -3.4619e-08  3.47205e-08 ) ergs/cm2
Cutoff power-law model

Time interval is from   54.556 sec. to   55.556 sec.
Spectral model in the cutoff power-law:
------------------------------------------------------------
Parameters  : value       lower 90%   higher 90%
Photon index: -1.64395     ( -0.241192   0.295882 )
Epeak [keV] : 93.7143      ( -34.0449 -93.7145 )
Norm@50keV  : 0.109152    ( -0.0241208   0.043464 )
------------------------------------------------------------
#Fit statistic : Chi-Squared =          52.28 using 59 PHA bins.
# Reduced chi-squared =         0.9337 for     56 degrees of freedom
# Null hypothesis probability =   6.162964e-01

Photon flux (15-150 keV)    in 1 sec: 12.0910 ( -0.5708  0.5724 ) ph/cm2/s
Energy fluence (15-150 keV)             : 7.95152e-07 ( -3.81448e-08  3.79919e-08 ) ergs/cm2
Time-resolved spectra
Distribution
T90 vs. Hardness ratio plot
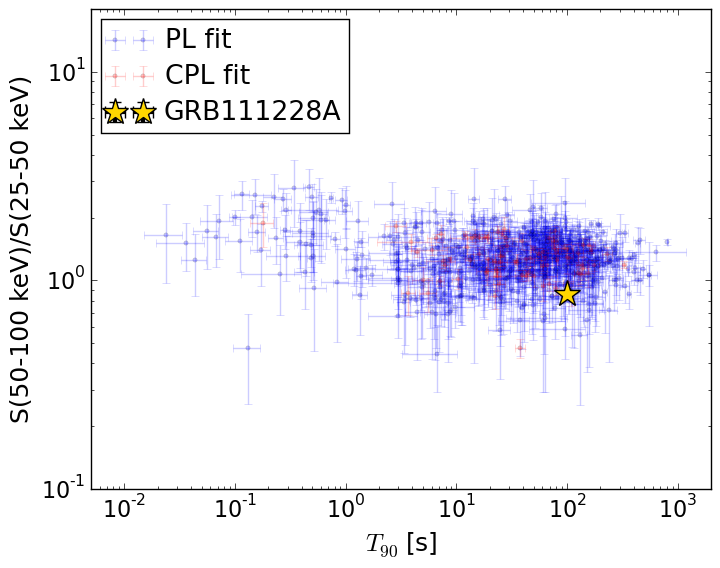
T90                                   = 101.244 sec.
Hardness ratio (energy fluence ratio) = 0.858242471651
S(15-50 keV) vs. S(50-150 keV) plot
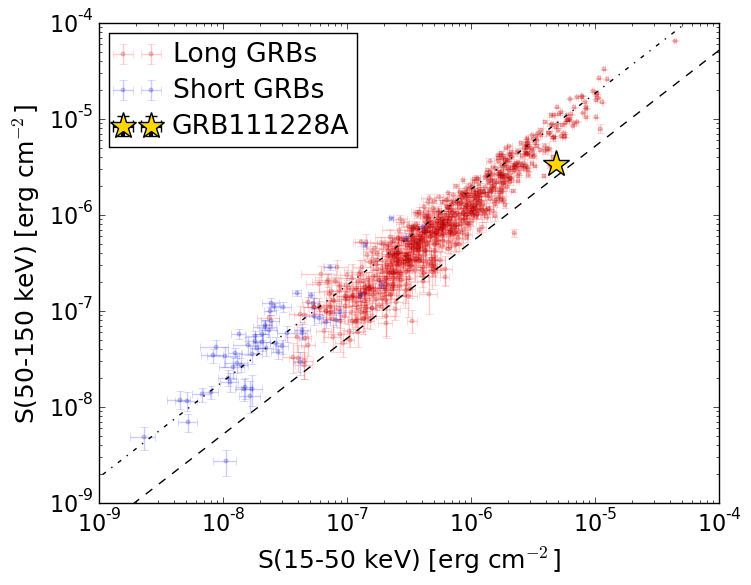
S(15-50 keV)  = 4.844414e-06
S(50-150 keV) = 3.427248e-06
The dash-dotted line and the dashed line traces the fluences calculated from the Band function with Epeak = 15 and 150 keV, respectively. Both lines assume a canonical values of alpha = -1 and beta = -2.5.
Mask shadow pattern
IMX = 8.565586181937285E-01, IMY = -1.978418512008792E-01
Spacecraft aspect plot
Bright source in the pre-burst/pre-slew/post-slew images
Pre-burst image of 15-350 keV band
Time interval of the image:
-239.328000 -12.820000

# RAcent  DECcent POSerr Theta    Phi  PeakCts   SNR AngSep     Name
#  [deg]    [deg]    ['] [deg]  [deg]                   [']
 83.6410  22.0135    0.3  26.7  145.6   9.2785  34.0    0.4	Crab
127.8268  78.3131    2.8  40.8  -88.1   4.8447   4.2 ------	UNKNOWN
Pre-slew background subtracted image of 15-350 keV band
Time interval of the image:
-12.820000 40.572590

# RAcent  DECcent POSerr Theta    Phi  PeakCts   SNR AngSep     Name
#  [deg]    [deg]    ['] [deg]  [deg]                   [']
 83.5589  22.1247   12.5  26.7  145.9   0.1111   0.9    7.8	Crab
 63.4992   8.2395    2.1  50.3  151.2   2.5296   5.6 ------	UNKNOWN
150.0634  18.2840    0.6  41.3   13.0   3.3234  19.5 ------	UNKNOWN
Post-slew image of 15-350 keV band
Time interval of the image:
132.972600 962.732800

# RAcent  DECcent POSerr Theta    Phi  PeakCts   SNR AngSep     Name
#  [deg]    [deg]    ['] [deg]  [deg]                   [']
131.7109 -30.4594    3.0  51.8    5.0   5.5424   3.9 ------	UNKNOWN