Analysis Summary
Notes:
- 1) No attempt has been made to eliminate the non-significant decimal places.
- 2) This batgrbproduct analysis is done using the HEASARC data.
- 3) This batgrbproduct analysis is using the flight position for the mask-weighting calculation.
======================================================================
                  BAT GRB EVENT DATA PROCESSING REPORT
    Process Script Ver: batgrbproduct v2.46
    Process Start Time: Wed May  6 16:48:48 EDT 2015
             Host Name: bat1
   Current Working Dir: /local/data/bat1/alien/Swift_3rdBATcatalog/event/batevent_reproc/trigger510736
======================================================================

  Trigger: 00510736      Segment: 000

  BAT Trigger Time: 346891080   [s; MET]
      Trigger Stop: 346891081.024   [s; MET]
               UTC: 2011-12-29T22:37:52.271700    [includes UTCF correction]
       Where From?: TDRSS position message

  BAT
    RA: 76.2818710787315   Dec: -84.7226656056908  [deg; J2000]

     Catalogged Source?: NO
     Point Source?:      YES
     GRB Indicated?:     YES    [ by BAT flight software ]
     Image S/N Ratio:    7.81
     Image Trigger?:     NO
     Rate S/N Ratio:     9.79795897113271  [ if not an image trigger ]
     Image S/N Ratio:    7.81

  Analysis Position:   [ source = BAT ]
    RA: 76.2818710787315   Dec: -84.7226656056908  [deg; J2000]

  Refined Position:   [ source = BAT pre-slew burst ]
    RA: 76.6116818414581   Dec: -84.7042360580484  [deg; J2000]
        { 05h 06m 26.8s , -84d 42' 15.2" }
         +/- 2.74320027437345 [arcmin] (estimated 90% radius based on SNR)
         +/- 1.48723397449673 [arcmin] (formal 1-sigma fit error)
    SNR: 7.19508973874112

  Angular difference between the analysis and refined position is 2.132370 arcmin

  Partial Coding Fraction: 0.78125    [ including projection effects ]

  Duration
     T90: 25.3719999194145 +/- 5.58418089658764
        Measured from: -0.459999978542328
                   to: 24.9119999408722     [s; relative to TRIGTIME]
     T50: 16.9799998998642 +/- 3.9813188902735
        Measured from: 0.836000025272369
                   to: 17.8159999251366     [s; relative to TRIGTIME]


  Fluence
     Peak Flux  (peak 1 second)
        Measured from: 0.120000004768372
                   to: 1.12000000476837     [s; relative to TRIGTIME]
     Total Fluence
        Measured from: -0.972000002861023
                   to: 26.2599999904633     [s; relative to TRIGTIME]

             Band 1     Band 2     Band 3     Band 4
              15-25      25-50     50-100    100-350     keV
 Total     0.194310   0.230138   0.145205   0.019228
           0.035935   0.035698   0.031398   0.027719 [error]
 Peak      0.035416   0.047497   0.025067   0.007720
           0.007309   0.007434   0.006627   0.005401 [error]

     [ fluence units of on-axis counts / fully illuminated detector ]

======================================================================


====== Table of the duration information =============================

        Value   tstart    tstop
T100   27.232   -0.972   26.260
T90    25.372   -0.460   24.912
T50    16.980    0.836   17.816
Peak    1.000    0.120    1.120


====== Spectral Analysis Summary =====================================

Model      : spectral model: simple power-law (PL) and cutoff power-law (CPL)
Ph_index   : photon index: E^{Ph_index}
Ph_90err   : 90% error of the photon index
Epeak      : Epeak in keV
Epeak_90err: 90% error of Epeak
Norm       : normalization at 50 keV in both the PL model and CPL model
Nomr_90err : 90% error of the normalization
chi2       : Chi-Squared
dof        : degree of freedo

=== Time-averaged spectral analysis ===
(Best model with acceptable fit: PL)

Model Ph_index Ph_90err_low Ph_90err_hi  Epeak  Epeak_90err_low  Epeak_90err_hi  Norm       Nomr_90err_low    Norm_90err_hi    chi2    dof
PL      -1.833    -0.343      0.318       -           -               -         1.34e-03     -2.83e-04          2.72e-04      48.990   57
CPL     -1.802    -1.364      1.249      289.801    -289.791      -289.801      1.39e-03     -1.39e-03          5.23e-03      48.990   56


=== 1-s peak spectral analysis ===
(Best model with acceptable fit: PL)

Model Ph_index Ph_90err_low Ph_90err_hi  Epeak  Epeak_90err_low  Epeak_90err_hi  Norm       Nomr_90err_low    Norm_90err_hi    chi2    dof
PL      -1.649     -0.333     0.318       -           -               -         7.41e-03     -1.51e-03          1.47e-03      43.250   57
CPL     -1.381     -0.590     1.499      108.561    -108.561      -108.561      1.03e-02        N/A               N/A         43.100   56


=== Fluence/Peak Flux Summary ===

              Model    Band1     Band2     Band3     Band4     Band5     Total
                       15-25     25-50    50-100    100-350    15-150    15-350    keV
Fluence         PL   6.38e-08  9.57e-08  1.07e-07  2.29e-07  3.36e-07  4.96e-07   erg/cm2
      90%_error_low -1.61e-08 -1.65e-08 -3.03e-08 -1.08e-07 -6.94e-08 -1.44e-07   erg/cm2
      90%_error_hi   1.69e-08  1.65e-08  3.07e-08  1.59e-07  7.13e-08  1.83e-07   erg/cm2
Peak flux       PL   3.52e-01  3.24e-01  2.07e-01  2.03e-01  9.67e-01  1.09e+00   ph/cm2/s
      90%_error_low -9.97e-02 -6.15e-02 -5.37e-02 -8.81e-02 -1.80e-01 -2.04e-01   ph/cm2/s
      90%_error_hi   1.06e-01  6.11e-02  5.32e-02  1.20e-01  1.80e-01  2.05e-01   ph/cm2/s

Fluence        CPL   6.31e-08  8.54e-08  8.86e-08  2.04e-07  2.94e-07  4.40e-07   erg/cm2
      90%_error_low -2.01e-08 -2.76e-08 -2.80e-08 -1.70e-07 -9.39e-08 -1.35e-07   erg/cm2
      90%_error_hi   1.64e-08  2.41e-07  2.28e-08  1.59e-07  7.57e-08  1.03e-07   erg/cm2
Peak flux      CPL   3.39e-01  3.35e-01  2.10e-01  1.44e-01  9.59e-01  1.03e+00   ph/cm2/s
      90%_error_low -1.15e-01 -7.02e-02 -5.63e-02 -1.44e-01 -1.85e-01 -2.33e-01   ph/cm2/s
      90%_error_hi   1.12e-01  8.01e-02  5.88e-02  1.06e-01  1.84e-01  2.55e-01   ph/cm2/s

======================================================================
Image
Pre-slew 15.0-350.0 keV image (Event data)
#   RAcent    DECcent   POSerr    Theta     Phi              Peak Cts       SNR   Name
   76.6117   -84.7042   0.0268    30.3790    -0.1810         0.3303993      7.195 TRIG_00510736

Foreground time interval of the image:
 -0.972  11.901 (delta_t =  12.873 [sec])
Background time interval of the image:
-239.000  -0.972 (delta_t = 238.028 [sec])
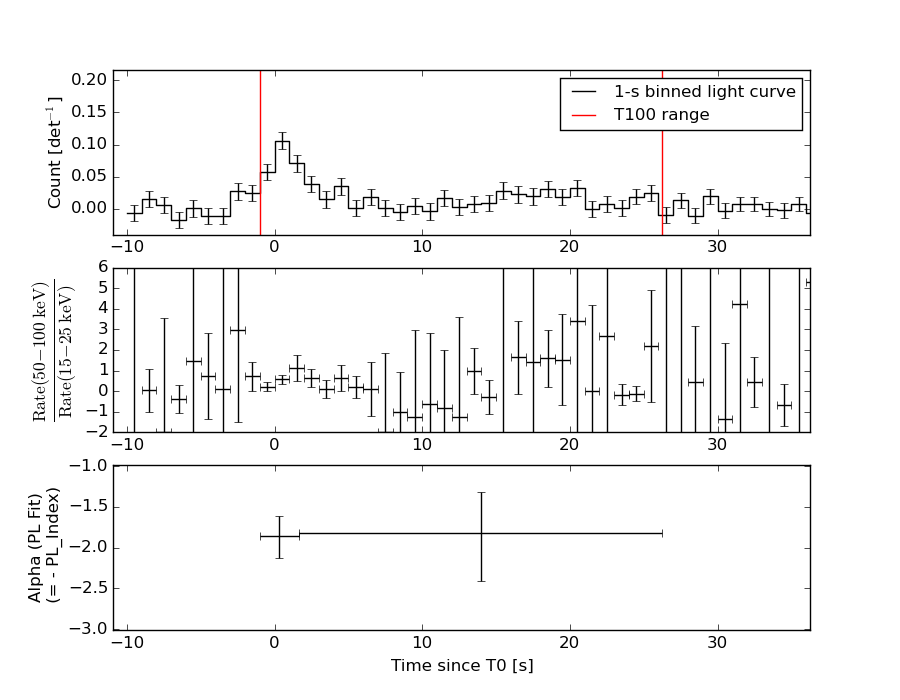
Light Curves
Note: The mask-weighted lightcurves have units of either count/det or counts/sec/det, where a det is 0.4 x 0.4 = 0.16 sq cm.
Full-time range; 1 s binning
Other quick-look light curves:
- 64 ms binning (zoomed)
- 16 ms binning (zoomed)
- 8 ms binning (zoomed)
- 2 ms binning (zoomed)
- SN=5 or 10 s binning (full-time range)
- Raw light curve
Spectra
- 64 ms binning (zoomed)
- 16 ms binning (zoomed)
- 8 ms binning (zoomed)
- 2 ms binning (zoomed)
- SN=5 or 10 s binning (full-time range)
- Raw light curve
Spectra
Notes:
- 1) The fitting includes the systematic errors.
- 2) When the burst includes telescope slew time periods, the fitting uses an average response file made from multiple 5-s response files through out the slew time plus single time preiod for the non-slew times, and weighted by the total counts in the corresponding time period using addrmf. An average response file is needed becuase a spectral fit using the pre-slew DRM will introduce some errors in both a spectral shape and a normalization if the PHA file contains a lot of the slew/post-slew time interval.
- 3) For fits to more complicated models (e.g. a power-law over a cutoff power-law), the BAT team has decided to require a chi-square improvement of more than 6 for each extra dof.
Time averaged spectrum fit using the average DRM
Power-law model

Time interval is from   -0.972 sec. to   26.260 sec.

Spectral model in power-law:
------------------------------------------------------------
Parameters  : value       lower 90%   higher 90%
Photon index: -1.83262     ( -0.342637   0.317734 )
Norm@50keV  : 1.34065E-03    ( -0.00028331   0.000271607 )
------------------------------------------------------------
#Fit statistic : Chi-Squared =          48.99 using 59 PHA bins.
# Reduced chi-squared =         0.8595 for     57 degrees of freedom
# Null hypothesis probability =   7.658039e-01

Photon flux (15-150 keV)    in 27.23 sec: 0.187137 ( -0.032473  0.032491 ) ph/cm2/s
Energy fluence (15-150 keV)             : 3.35822e-07 ( -6.94324e-08  7.13401e-08 ) ergs/cm2
Cutoff power-law model
Time interval is from   -0.972 sec. to   26.260 sec.
Spectral model in the cutoff power-law:
------------------------------------------------------------
Parameters  : value       lower 90%   higher 90%
Photon index: -1.80161     ( -1.36439   1.24847 )
Epeak [keV] : 289.801      ( -287.444 -287.454 )
Norm@50keV  : 1.39457E-03    ( -0.00139516   0.00523002 )
------------------------------------------------------------
#Fit statistic : Chi-Squared =          48.99 using 59 PHA bins.
# Reduced chi-squared =         0.8748 for     56 degrees of freedom
# Null hypothesis probability =   7.351870e-01

Photon flux (15-150 keV)    in 27.23 sec: 0.186914 ( -0.033331  0.032685 ) ph/cm2/s
Energy fluence (15-150 keV)             : 2.93561e-07 ( -9.38523e-08  7.5746e-08 ) ergs/cm2
1-s peak spectrum fit
Power-law model
Time interval is from    0.120 sec. to    1.120 sec.

Spectral model in power-law:
------------------------------------------------------------
Parameters  : value       lower 90%   higher 90%
Photon index: -1.64863     ( -0.333418   0.317629 )
Norm@50keV  : 7.41028E-03    ( -0.00151282   0.00147495 )
------------------------------------------------------------
#Fit statistic : Chi-Squared =          43.25 using 59 PHA bins.
# Reduced chi-squared =         0.7587 for     57 degrees of freedom
# Null hypothesis probability =   9.107624e-01

Photon flux (15-150 keV)    in 1 sec: 0.967200 ( -0.180316  0.18047 ) ph/cm2/s
Energy fluence (15-150 keV)             : 6.89382e-08 ( -1.46982e-08  1.49885e-08 ) ergs/cm2
Cutoff power-law model
Time interval is from    0.120 sec. to    1.120 sec.
Spectral model in the cutoff power-law:
------------------------------------------------------------
Parameters  : value       lower 90%   higher 90%
Photon index: -1.38087     ( -0.590239   1.49871 )
Epeak [keV] : 108.561      ( -108.563 -108.563 )
Norm@50keV  : 1.03265E-02    (     )
------------------------------------------------------------
#Fit statistic : Chi-Squared =          43.10 using 59 PHA bins.
# Reduced chi-squared =         0.7696 for     56 degrees of freedom
# Null hypothesis probability =   8.967816e-01

Photon flux (15-150 keV)    in 1 sec: 0.958835 ( -0.184602  0.184025 ) ph/cm2/s
Energy fluence (15-150 keV)             : 4.81571e-08 ( -1.63898e-08  1.07625e-08 ) ergs/cm2
Time-resolved spectra
Distribution
T90 vs. Hardness ratio plot
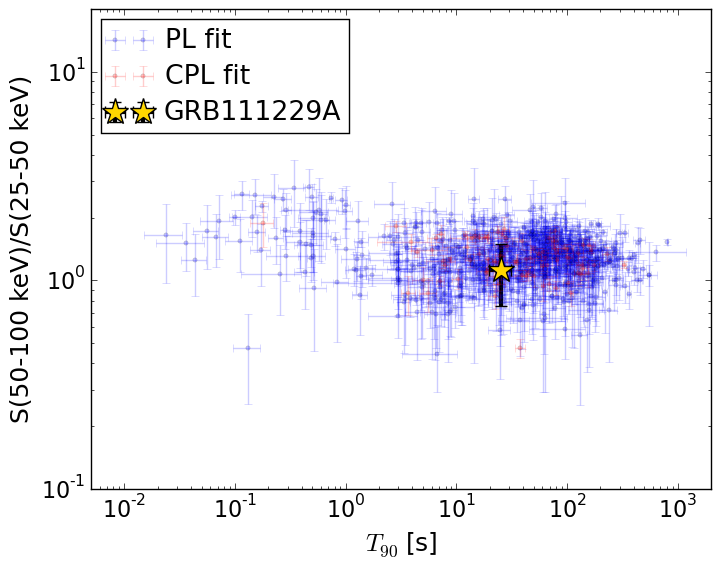
T90                                   = 25.372 sec.
Hardness ratio (energy fluence ratio) = 1.12305275702
S(15-50 keV) vs. S(50-150 keV) plot
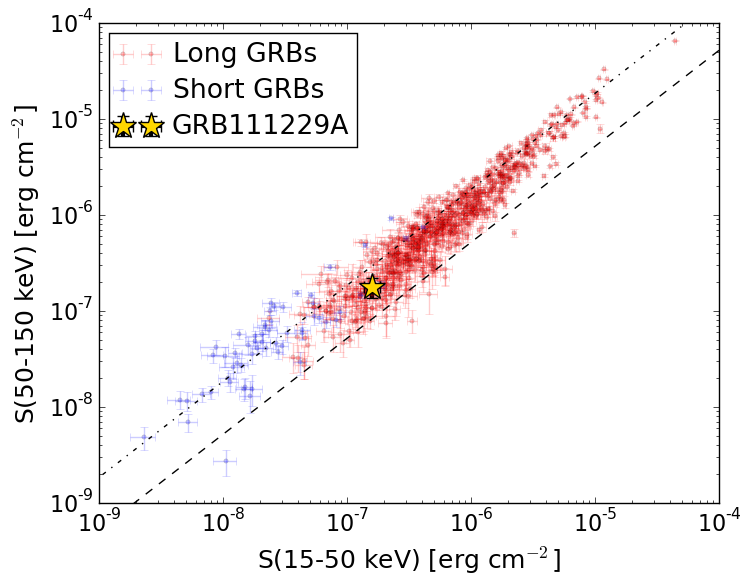
S(15-50 keV)  = 1.5945529e-07
S(50-150 keV) = 1.76366e-07
The dash-dotted line and the dashed line traces the fluences calculated from the Band function with Epeak = 15 and 150 keV, respectively. Both lines assume a canonical values of alpha = -1 and beta = -2.5.
Mask shadow pattern
IMX = 5.862015600200567E-01, IMY = 1.852211076233686E-03
Spacecraft aspect plot
Bright source in the pre-burst/pre-slew/post-slew images
Pre-burst image of 15-350 keV band
Time interval of the image:
-239.000000 -0.972000

# RAcent  DECcent POSerr Theta    Phi  PeakCts   SNR AngSep     Name
#  [deg]    [deg]    ['] [deg]  [deg]                   [']
170.2653 -60.6190    1.6  13.3   77.3   1.5193   7.0    1.5	Cen X-3
186.7263 -62.7563    1.3   5.2   75.2   1.8965   9.2    2.1	GX 301-2
171.3987 -24.2229    2.6  42.4  133.3   3.0626   4.4 ------	UNKNOWN
118.3039 -55.7435    2.4  38.8   53.2   2.6672   4.8 ------	UNKNOWN
124.3455 -60.9452    2.8  33.0   49.8   1.5236   4.1 ------	UNKNOWN
202.9550 -66.0706    2.3   3.9  -38.4   0.9405   5.0 ------	UNKNOWN
248.4784 -47.3543    1.9  31.5 -104.3   1.9377   6.0 ------	UNKNOWN
230.2174 -14.6761    2.3  53.0 -149.2   3.9125   5.0 ------	UNKNOWN
238.8153 -28.9058    2.5  42.8 -132.0   2.1561   4.5 ------	UNKNOWN
332.2565 -61.5810    3.2  51.0  -35.2   2.3430   3.6 ------	UNKNOWN
Pre-slew background subtracted image of 15-350 keV band
Time interval of the image:
-0.972000 11.900600

# RAcent  DECcent POSerr Theta    Phi  PeakCts   SNR AngSep     Name
#  [deg]    [deg]    ['] [deg]  [deg]                   [']
170.2867 -60.6119 1767.6  13.3   77.3   0.0002   0.0    1.1	Cen X-3
186.7170 -62.9384    4.7   5.2   73.2   0.0954   2.4   10.2	GX 301-2
 76.6121 -84.7043    1.6  30.4   -0.2   0.3304   7.2 ------	UNKNOWN
211.9591 -62.1576    2.4   6.4  -97.9   0.2003   4.9 ------	UNKNOWN
224.0994 -12.0924    2.3  53.9 -157.2   0.6268   4.9 ------	UNKNOWN
Post-slew image of 15-350 keV band
Time interval of the image:
67.300600 833.300650

# RAcent  DECcent POSerr Theta    Phi  PeakCts   SNR AngSep     Name
#  [deg]    [deg]    ['] [deg]  [deg]                   [']
170.1692 -60.6055    2.0  30.2  171.7   3.3236   5.9    4.4	Cen X-3
186.5867 -62.7756    1.2  29.5 -172.1   5.2455   9.7    1.9	GX 301-2
160.3639 -59.5240    2.2  30.4  161.8   3.3423   5.2 ------	UNKNOWN
280.2776 -57.6510    3.3  37.2  -90.3   4.7286   3.6 ------	UNKNOWN