Analysis Summary
Notes:
- 1) No attempt has been made to eliminate the non-significant decimal places.
- 2) This batgrbproduct analysis is done using the HEASARC data.
- 3) This batgrbproduct analysis is using the flight position for the mask-weighting calculation.
======================================================================
BAT GRB EVENT DATA PROCESSING REPORT
Process Script Ver: batgrbproduct v2.46
Process Start Time: Mon Jan 13 07:26:32 EST 2014
Host Name: batevent1
Current Working Dir: /local/data/batevent/batevent_reproc/trigger510922
======================================================================
Trigger: 00510922 Segment: 000
BAT Trigger Time: 347163362.752 [s; MET]
Trigger Stop: 347163366.848 [s; MET]
UTC: 2012-01-02T02:15:55.012820 [includes UTCF correction]
Where From?: TDRSS position message
BAT
RA: 276.200903597835 Dec: 24.7316362946046 [deg; J2000]
Catalogged Source?: NO
Point Source?: YES
GRB Indicated?: YES [ by BAT flight software ]
Image S/N Ratio: 9.2
Image Trigger?: NO
Rate S/N Ratio: 12.2882057274445 [ if not an image trigger ]
Image S/N Ratio: 9.2
Analysis Position: [ source = BAT ]
RA: 276.200903597835 Dec: 24.7316362946046 [deg; J2000]
Refined Position: [ source = BAT pre-slew burst ]
RA: 276.223711834673 Dec: 24.7133789997417 [deg; J2000]
{ 18h 24m 53.7s , +24d 42' 48.2" }
+/- 0.619529468185137 [arcmin] (estimated 90% radius based on SNR)
+/- 0.22738095638862 [arcmin] (formal 1-sigma fit error)
SNR: 60.2799260066436
Angular difference between the analysis and refined position is 1.656862 arcmin
Partial Coding Fraction: 0.7890625 [ including projection effects ]
Duration
T90: 38.7080000042915 +/- 3.50732263817963
Measured from: 6.52799999713898
to: 45.2360000014305 [s; relative to TRIGTIME]
T50: 4.86799991130829 +/- 0.4040792083472
Measured from: 30.8200000524521
to: 35.6879999637604 [s; relative to TRIGTIME]
Fluence
Peak Flux (peak 1 second)
Measured from: 32.7520000338554
to: 33.7520000338554 [s; relative to TRIGTIME]
Total Fluence
Measured from: 0.76800000667572
to: 53.9399999976158 [s; relative to TRIGTIME]
Band 1 Band 2 Band 3 Band 4
15-25 25-50 50-100 100-350 keV
Total 1.946801 2.644586 1.825753 0.516178
0.053010 0.054789 0.047970 0.037758 [error]
Peak 0.272516 0.439698 0.405326 0.135456
0.011153 0.013263 0.012793 0.009329 [error]
[ fluence units of on-axis counts / fully illuminated detector ]
======================================================================
====== Table of the duration information =============================
Value tstart tstop
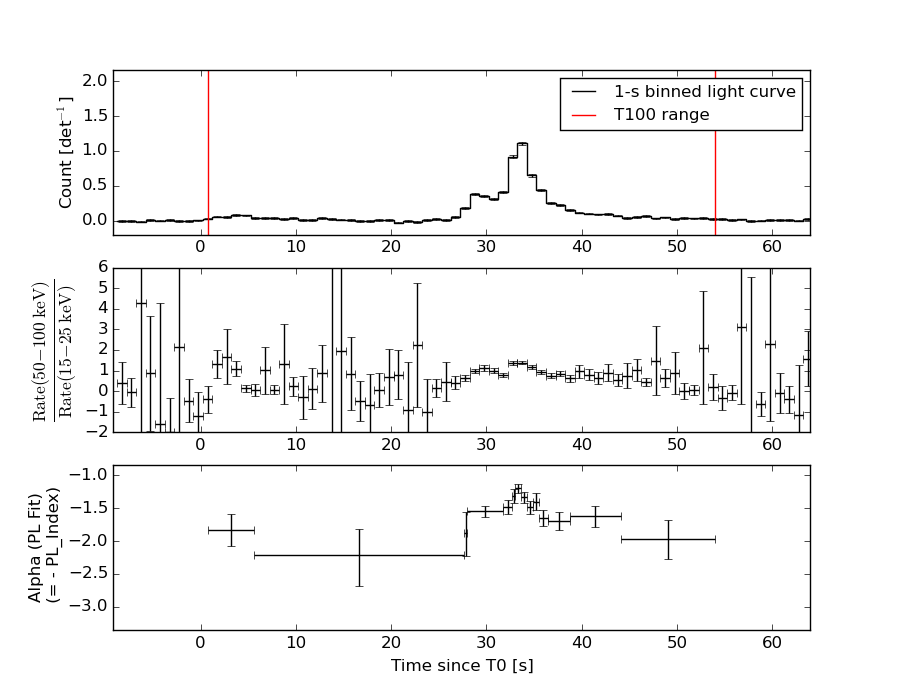
T100 53.172 0.768 53.940
T90 38.708 6.528 45.236
T50 4.868 30.820 35.688
Peak 1.000 32.752 33.752
====== Spectral Analysis Summary =====================================
Model : spectral model: simple power-law (PL) and cutoff power-law (CPL)
Ph_index : photon index: E^{Ph_index}
Ph_90err : 90% error of the photon index
Epeak : Epeak in keV
Epeak_90err: 90% error of Epeak
Norm : normalization at 50 keV in both the PL model and CPL model
Nomr_90err : 90% error of the normalization
chi2 : Chi-Squared
dof : degree of freedo
=== Time-averaged spectral analysis ===
(Best model with acceptable fit: PL)
Model Ph_index Ph_90err_low Ph_90err_hi Epeak Epeak_90err_low Epeak_90err_hi Norm Nomr_90err_low Norm_90err_hi chi2 dof
PL -1.590 -0.052 0.052 - - - 8.68e-03 -2.34e-04 2.34e-04 55.990 57
CPL -1.588 -0.052 0.053 9999.360 -9999.360 -9999.360 8.69e-03 -2.27e-04 1.60e-03 56.010 56
=== 1-s peak spectral analysis ===
(Best model with acceptable fit: N/A)
Model Ph_index Ph_90err_low Ph_90err_hi Epeak Epeak_90err_low Epeak_90err_hi Norm Nomr_90err_low Norm_90err_hi chi2 dof
PL -1.220 -0.062 0.062 - - - 8.66e-02 -2.91e-03 2.91e-03 63.860 57
CPL -1.217 -0.061 0.064 9999.360 -9999.360 -9999.360 8.69e-02 -2.75e-03 1.84e-02 63.900 56
=== Fluence/Peak Flux Summary ===
Model Band1 Band2 Band3 Band4 Band5 Total
15-25 25-50 50-100 100-350 15-150 15-350 keV
Fluence PL 6.41e-07 1.11e-06 1.48e-06 4.02e-06 4.32e-06 7.26e-06 erg/cm2
90%_error_low -3.43e-08 -3.44e-08 -5.06e-08 -3.08e-07 -1.22e-07 -3.36e-07 erg/cm2
90%_error_hi 3.51e-08 3.43e-08 5.05e-08 3.25e-07 1.22e-07 3.49e-07 erg/cm2
Peak flux PL 6.64e-04 1.01e-02 1.14e-01 1.01e+01 5.29e-01 9.90e+00 ph/cm2/s
90%_error_low N/A N/A N/A N/A N/A N/A ph/cm2/s
90%_error_hi N/A N/A N/A N/A N/A N/A ph/cm2/s
Fluence CPL 6.40e-07 1.11e-06 1.48e-06 4.01e-06 4.33e-06 7.33e-06 erg/cm2
90%_error_low N/A -3.86e-08 -5.68e-08 N/A -1.50e-07 -1.19e-06 erg/cm2
90%_error_hi N/A 4.22e-08 6.44e-08 N/A 1.33e-07 1.62e-07 erg/cm2
Peak flux CPL 2.73e+00 3.24e+00 2.78e+00 4.20e+00 1.02e+01 1.30e+01 ph/cm2/s
90%_error_low N/A -1.38e-01 N/A -9.38e-01 -5.81e-01 -1.03e+00 ph/cm2/s
90%_error_hi N/A 1.35e-01 N/A 5.94e-02 4.06e-01 2.83e-01 ph/cm2/s
======================================================================
Image
Pre-slew 15.0-350.0 keV image (Event data)
#   RAcent    DECcent   POSerr    Theta     Phi              Peak Cts       SNR   Name
  276.2237    24.7134   0.0032    29.5089   -27.3265         5.9343614     60.280 TRIG_00510922

Foreground time interval of the image:
  0.768  36.149 (delta_t =  35.381 [sec])
Background time interval of the image:
-170.851   0.768 (delta_t = 171.619 [sec])
Light Curves
Note: The mask-weighted lightcurves have units of either count/det or counts/sec/det, where a det is 0.4 x 0.4 = 0.16 sq cm.
Full-time range; 1 s binning
Other quick-look light curves:
- 64 ms binning (zoomed)
- 16 ms binning (zoomed)
- 8 ms binning (zoomed)
- 2 ms binning (zoomed)
- SN=5 or 10 s binning (full-time range)
- Raw light curve
Spectra
- 64 ms binning (zoomed)
- 16 ms binning (zoomed)
- 8 ms binning (zoomed)
- 2 ms binning (zoomed)
- SN=5 or 10 s binning (full-time range)
- Raw light curve
Spectra
Notes:
- 1) The fitting includes the systematic errors.
- 2) When the burst includes telescope slew time periods, the fitting uses an average response file made from multiple 5-s response files through out the slew time plus single time preiod for the non-slew times, and weighted by the total counts in the corresponding time period using addrmf. An average response file is needed becuase a spectral fit using the pre-slew DRM will introduce some errors in both a spectral shape and a normalization if the PHA file contains a lot of the slew/post-slew time interval.
- 3) For fits to more complicated models (e.g. a power-law over a cutoff power-law), the BAT team has decided to require a chi-square improvement of more than 6 for each extra dof.
Time averaged spectrum fit using the average DRM
Power-law model

Time interval is from    0.768 sec. to   53.940 sec.

Spectral model in power-law:
------------------------------------------------------------
Parameters  : value       lower 90%   higher 90%
Photon index: -1.58977     ( -0.0523504   0.0523032 )
Norm@50keV  : 8.67504E-03    ( -0.000233633   0.000233562 )
------------------------------------------------------------
#Fit statistic : Chi-Squared =          55.99 using 59 PHA bins.
# Reduced chi-squared =         0.9823 for     57 degrees of freedom
# Null hypothesis probability =   5.128854e-01

Photon flux (15-150 keV)    in 53.17 sec: 1.11132 ( -0.03351  0.03368 ) ph/cm2/s
Energy fluence (15-150 keV)             : 4.31973e-06 ( -1.21789e-07  1.21941e-07 ) ergs/cm2
Cutoff power-law model
Time interval is from    0.768 sec. to   53.940 sec.
Spectral model in the cutoff power-law:
------------------------------------------------------------
Parameters  : value       lower 90%   higher 90%
Photon index: -1.58828     ( -0.0521394   0.053186 )
Epeak [keV] : 9999.36      ( -9999.36 -9999.36 )
Norm@50keV  : 8.68955E-03    ( -0.000233968   0.00159803 )
------------------------------------------------------------
#Fit statistic : Chi-Squared =          56.01 using 59 PHA bins.
# Reduced chi-squared =          1.000 for     56 degrees of freedom
# Null hypothesis probability =   4.745863e-01

Photon flux (15-150 keV)    in 53.17 sec: 1.11354 ( -0.04262  0.03627 ) ph/cm2/s
Energy fluence (15-150 keV)             : 4.3276e-06 ( -1.49806e-07  1.32935e-07 ) ergs/cm2
1-s peak spectrum fit
Power-law model
Time interval is from   32.752 sec. to   33.752 sec.

Spectral model in power-law:
------------------------------------------------------------
Parameters  : value       lower 90%   higher 90%
Photon index: -1.2205     ( -0.0616772   0.0618537 )
Norm@50keV  : 8.66305E-02    ( -0.00291148   0.00291074 )
------------------------------------------------------------
#Fit statistic : Chi-Squared =          63.86 using 59 PHA bins.
# Reduced chi-squared =          1.120 for     57 degrees of freedom
# Null hypothesis probability =   2.480569e-01

Photon flux (15-150 keV)    in 1 sec: 0.529213 (    ) ph/cm2/s
Energy fluence (15-150 keV)             : 8.73997e-07 ( -3.20011e-08  3.20693e-08 ) ergs/cm2
Cutoff power-law model
Time interval is from   32.752 sec. to   33.752 sec.
Spectral model in the cutoff power-law:
------------------------------------------------------------
Parameters  : value       lower 90%   higher 90%
Photon index: -1.21732     ( -0.0612805   0.0633454 )
Epeak [keV] : 9999.36      ( -9999.36 -9999.36 )
Norm@50keV  : 8.68671E-02    ( -0.00291977   0.0182317 )
------------------------------------------------------------
#Fit statistic : Chi-Squared =          63.90 using 59 PHA bins.
# Reduced chi-squared =          1.141 for     56 degrees of freedom
# Null hypothesis probability =   2.188651e-01

Photon flux (15-150 keV)    in 1 sec: 10.2171 ( -0.58125  0.4064 ) ph/cm2/s
Energy fluence (15-150 keV)             : 8.75649e-07 ( -4.34255e-08  3.94119e-08 ) ergs/cm2
Time-resolved spectra
Distribution
T90 vs. Hardness ratio plot
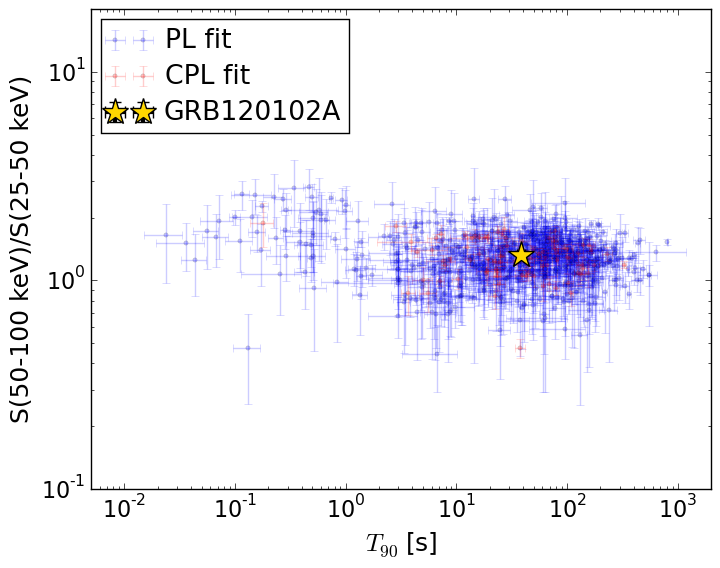
T90                                   = 38.708 sec.
Hardness ratio (energy fluence ratio) = 1.32892355862
S(15-50 keV) vs. S(50-150 keV) plot
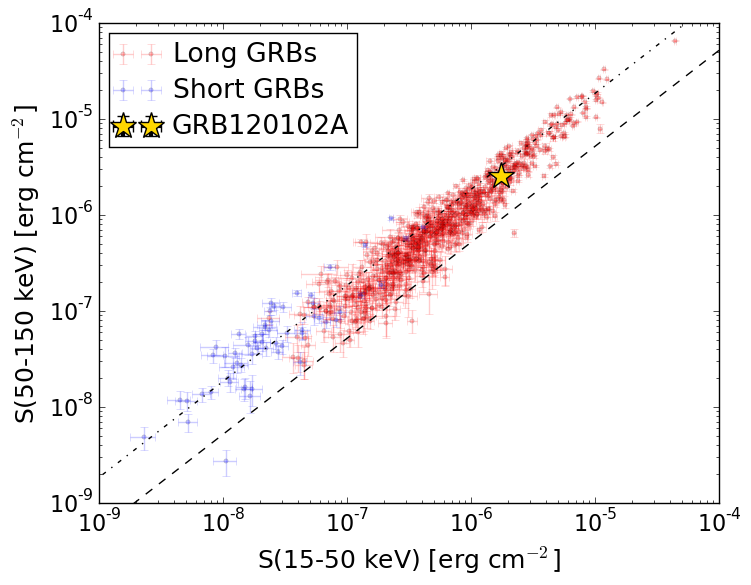
S(15-50 keV)  = 1.7554068e-06
S(50-150 keV) = 2.564323e-06
The dash-dotted line and the dashed line traces the fluences calculated from the Band function with Epeak = 15 and 150 keV, respectively. Both lines assume a canonical values of alpha = -1 and beta = -2.5.
Mask shadow pattern
IMX = 5.028183394531438E-01, IMY = 2.598187050693557E-01
Spacecraft aspect plot
Bright source in the pre-burst/pre-slew/post-slew images
Pre-burst image of 15-350 keV band
Time interval of the image:
-170.851400 0.768000

# RAcent  DECcent POSerr Theta    Phi  PeakCts   SNR AngSep     Name
#  [deg]    [deg]    ['] [deg]  [deg]                   [']
254.3714  35.2953    4.5  49.2  -12.8   0.8510   2.6    5.1	Her X-1
288.8029  10.9421    1.0  20.2  -65.8   2.1121  11.3    0.3	GRS 1915+105
299.6010  35.2056    0.3  17.1   24.0   5.6851  34.6    0.6	Cyg X-1
308.1198  40.9657    1.8  21.3   47.9   1.3556   6.3    0.9	Cyg X-3
326.4318  38.3054    0.0  24.7   84.1   0.3972   1.7   12.3	Cyg X-2
352.5469  16.8036    2.7  42.6  133.4   2.3548   4.3 ------	UNKNOWN
259.8029   7.3501    3.3  48.0  -51.0   2.6471   3.6 ------	UNKNOWN
Pre-slew background subtracted image of 15-350 keV band
Time interval of the image:
0.768000 36.148600

# RAcent  DECcent POSerr Theta    Phi  PeakCts   SNR AngSep     Name
#  [deg]    [deg]    ['] [deg]  [deg]                   [']
254.4835  35.4435    6.9  49.1  -12.6   0.3126   1.7    6.2	Her X-1
288.7759  11.1552    0.0  20.1  -65.2   0.3132   3.2   12.6	GRS 1915+105
299.8067  35.1803    5.3  17.0   24.4  -0.1914  -2.2   10.7	Cyg X-1
308.0918  40.9868   80.4  21.3   47.9   0.0148   0.1    2.2	Cyg X-3
326.2790  38.2142   45.8  24.5   84.1   0.0320   0.3    8.2	Cyg X-2
333.3791  20.9841    2.8  24.1  129.5   0.4665   4.2 ------	UNKNOWN
350.2908 -20.0273    3.3  57.6  178.2   2.2485   3.5 ------	UNKNOWN
276.2237  24.7134    0.2  29.5  -27.3   5.9343  60.3 ------	UNKNOWN
258.0705   9.2754    1.9  49.0  -47.8   2.4484   5.9 ------	UNKNOWN
Post-slew image of 15-350 keV band
Time interval of the image:
101.348600 962.428000

# RAcent  DECcent POSerr Theta    Phi  PeakCts   SNR AngSep     Name
#  [deg]    [deg]    ['] [deg]  [deg]                   [']
244.9612 -15.6312    1.6  50.5  -42.3  24.2019   7.3    1.2	Sco X-1
254.2720  35.3481    5.6  21.7   41.9   1.3251   2.0    9.1	Her X-1
268.3857  -1.4600    2.7  27.2  -65.4   3.4588   4.3    1.2	SW J1753.5-0127
274.0616 -14.1285    3.7  38.9  -79.3   7.0927   3.2    6.4	GX 17+2
288.7680  10.9370    0.8  18.2 -125.8   8.9995  14.5    1.9	GRS 1915+105
299.5915  35.2001    0.2  22.8  154.5  29.4400  48.8    0.1	Cyg X-1
308.1115  40.9575    1.1  31.1  148.1   8.1595  10.2    0.3	Cyg X-3
326.3103  38.3944    7.4  44.3  156.9   2.1268   1.6    7.8	Cyg X-2
226.2909  -7.5887    3.2  58.3  -19.6  11.6139   3.5 ------	UNKNOWN
230.3886 -11.5665    3.8  57.5  -26.3  10.8773   3.1 ------	UNKNOWN