Analysis Summary
Notes:
- 1) No attempt has been made to eliminate the non-significant decimal places.
- 2) This batgrbproduct analysis is done using the HEASARC data.
- 3) This batgrbproduct analysis is using the flight position for the mask-weighting calculation.
======================================================================
                  BAT GRB EVENT DATA PROCESSING REPORT
    Process Script Ver: batgrbproduct v2.46
    Process Start Time: Mon Jan 13 07:22:04 EST 2014
             Host Name: batevent1
   Current Working Dir: /local/data/batevent/batevent_reproc/trigger511235
======================================================================

  Trigger: 00511235      Segment: 000

  BAT Trigger Time: 347552192   [s; MET]
      Trigger Stop: 347552193.024   [s; MET]
               UTC: 2012-01-06T14:16:24.245280    [includes UTCF correction]
       Where From?: TDRSS position message

  BAT
    RA: 66.1293574039097   Dec: 64.0284749529581  [deg; J2000]

     Catalogged Source?: NO
     Point Source?:      YES
     GRB Indicated?:     YES    [ by BAT flight software ]
     Image S/N Ratio:    8.96
     Image Trigger?:     NO
     Rate S/N Ratio:     19.6214168703486  [ if not an image trigger ]
     Image S/N Ratio:    8.96

  Analysis Position:   [ source = BAT ]
    RA: 66.1293574039097   Dec: 64.0284749529581  [deg; J2000]

  Refined Position:   [ source = BAT pre-slew burst ]
    RA: 66.1304831988789   Dec: 64.0489374820552  [deg; J2000]
        { 04h 24m 31.3s , +64d 02' 56.2" }
         +/- 1.26731162392981 [arcmin] (estimated 90% radius based on SNR)
         +/- 0.448335766301229 [arcmin] (formal 1-sigma fit error)
    SNR: 21.6841332885148

  Angular difference between the analysis and refined position is 1.228108 arcmin

  Partial Coding Fraction: 0.75    [ including projection effects ]

  Duration
     T90: 63.4999999403954 +/- 4.62083798710118
        Measured from: -5.34399998188019
                   to: 58.1559999585152     [s; relative to TRIGTIME]
     T50: 9.51999992132187 +/- 43.2384739832969
        Measured from: -2.4879999756813
                   to: 7.03199994564056     [s; relative to TRIGTIME]


  Fluence
     Peak Flux  (peak 1 second)
        Measured from: 0.459999978542328
                   to: 1.45999997854233     [s; relative to TRIGTIME]
     Total Fluence
        Measured from: -6.283999979496
                   to: 62.6399999856949     [s; relative to TRIGTIME]

             Band 1     Band 2     Band 3     Band 4
              15-25      25-50     50-100    100-350     keV
 Total     0.472285   0.581447   0.480925   0.099955
           0.050663   0.052289   0.046489   0.041130 [error]
 Peak      0.048908   0.063264   0.061575   0.018593
           0.007194   0.007648   0.007427   0.005668 [error]

     [ fluence units of on-axis counts / fully illuminated detector ]

======================================================================


====== Table of the duration information =============================

        Value   tstart    tstop
T100   68.924   -6.284   62.640
T90    63.500   -5.344   58.156
T50     9.520   -2.488    7.032
Peak    1.000    0.460    1.460


====== Spectral Analysis Summary =====================================

Model      : spectral model: simple power-law (PL) and cutoff power-law (CPL)
Ph_index   : photon index: E^{Ph_index}
Ph_90err   : 90% error of the photon index
Epeak      : Epeak in keV
Epeak_90err: 90% error of Epeak
Norm       : normalization at 50 keV in both the PL model and CPL model
Nomr_90err : 90% error of the normalization
chi2       : Chi-Squared
dof        : degree of freedo

=== Time-averaged spectral analysis ===
(Best model with acceptable fit: PL)

Model Ph_index Ph_90err_low Ph_90err_hi  Epeak  Epeak_90err_low  Epeak_90err_hi  Norm       Nomr_90err_low    Norm_90err_hi    chi2    dof
PL      -1.527    -0.167      0.166       -           -               -         1.52e-03     -1.51e-04          1.50e-04      54.390   57
CPL     -1.316    -0.359      0.660      154.334    -154.334      -154.334      1.97e-03     -7.29e-04          2.34e-03      54.020   56


=== 1-s peak spectral analysis ===
(Best model with acceptable fit: PL)

Model Ph_index Ph_90err_low Ph_90err_hi  Epeak  Epeak_90err_low  Epeak_90err_hi  Norm       Nomr_90err_low    Norm_90err_hi    chi2    dof
PL      -1.337     -0.203     0.201       -           -               -         1.25e-02     -1.53e-03          1.52e-03      37.580   57
CPL     -0.644     -0.773     1.028      103.627     -34.701      -103.627      2.70e-02     -1.53e-02          5.47e-02      35.590   56


=== Fluence/Peak Flux Summary ===

              Model    Band1     Band2     Band3     Band4     Band5     Total
                       15-25     25-50    50-100    100-350    15-150    15-350    keV
Fluence         PL   1.37e-07  2.48e-07  3.45e-07  9.97e-07  9.91e-07  1.73e-06   erg/cm2
      90%_error_low -2.11e-08 -2.41e-08 -4.51e-08 -2.50e-07 -1.08e-07 -2.92e-07   erg/cm2
      90%_error_hi   2.18e-08  2.40e-08  4.50e-08  3.03e-07  1.09e-07  3.35e-07   erg/cm2
Peak flux       PL   4.39e-01  4.87e-01  3.86e-01  5.05e-01  1.50e+00  1.82e+00   ph/cm2/s
      90%_error_low -8.98e-02 -6.48e-02 -5.73e-02 -1.38e-01 -1.84e-01 -2.28e-01   ph/cm2/s
      90%_error_hi   9.54e-02  6.41e-02  5.66e-02  1.65e-01  1.84e-01  2.31e-01   ph/cm2/s

Fluence        CPL   1.34e-07  2.55e-07  3.48e-07  6.96e-07  9.71e-07  1.43e-06   erg/cm2
      90%_error_low -2.39e-08 -2.86e-08 -4.68e-08 -4.22e-07 -1.21e-07 -4.41e-07   erg/cm2
      90%_error_hi   2.38e-08  3.04e-08  4.76e-08  6.57e-07  1.20e-07  3.91e-07   erg/cm2
Peak flux      CPL   3.81e-01  5.16e-01  4.15e-01  2.61e-01  1.46e+00  1.57e+00   ph/cm2/s
      90%_error_low -1.13e-01 -7.50e-02 -6.80e-02 -1.41e-01 -1.90e-01 -2.47e-01   ph/cm2/s
      90%_error_hi   1.17e-01  7.77e-02  7.05e-02  3.02e-01  1.90e-01  3.61e-01   ph/cm2/s

======================================================================
Image
Pre-slew 15.0-350.0 keV image (Event data)
#   RAcent    DECcent   POSerr    Theta     Phi              Peak Cts       SNR   Name
   66.1305    64.0489   0.0089    28.9334    16.1265         1.3642821     21.684 TRIG_00511235

Foreground time interval of the image:
 -6.284  12.301 (delta_t =  18.585 [sec])
Background time interval of the image:
-748.599 -731.865 (delta_t =  16.734 [sec])
-239.000 -34.849 (delta_t = 204.151 [sec])
-34.000  -6.284 (delta_t =  27.716 [sec])
Light Curves
Note: The mask-weighted lightcurves have units of either count/det or counts/sec/det, where a det is 0.4 x 0.4 = 0.16 sq cm.
Full-time range; 1 s binning
Other quick-look light curves:
- 64 ms binning (zoomed)
- 16 ms binning (zoomed)
- 8 ms binning (zoomed)
- 2 ms binning (zoomed)
- SN=5 or 10 s binning (full-time range)
- Raw light curve
Spectra
- 64 ms binning (zoomed)
- 16 ms binning (zoomed)
- 8 ms binning (zoomed)
- 2 ms binning (zoomed)
- SN=5 or 10 s binning (full-time range)
- Raw light curve
Spectra
Notes:
- 1) The fitting includes the systematic errors.
- 2) When the burst includes telescope slew time periods, the fitting uses an average response file made from multiple 5-s response files through out the slew time plus single time preiod for the non-slew times, and weighted by the total counts in the corresponding time period using addrmf. An average response file is needed becuase a spectral fit using the pre-slew DRM will introduce some errors in both a spectral shape and a normalization if the PHA file contains a lot of the slew/post-slew time interval.
- 3) For fits to more complicated models (e.g. a power-law over a cutoff power-law), the BAT team has decided to require a chi-square improvement of more than 6 for each extra dof.
Time averaged spectrum fit using the average DRM
Power-law model
Time interval is from   -6.284 sec. to   62.640 sec.

Spectral model in power-law:
------------------------------------------------------------
Parameters  : value       lower 90%   higher 90%
Photon index: -1.52732     ( -0.167349   0.165795 )
Norm@50keV  : 1.52209E-03    ( -0.000151025   0.000149772 )
------------------------------------------------------------
#Fit statistic : Chi-Squared =          54.39 using 59 PHA bins.
# Reduced chi-squared =         0.9543 for     57 degrees of freedom
# Null hypothesis probability =   5.734797e-01

Photon flux (15-150 keV)    in 68.92 sec: 0.191452 ( -0.018221  0.018235 ) ph/cm2/s
Energy fluence (15-150 keV)             : 9.91001e-07 ( -1.07564e-07  1.08854e-07 ) ergs/cm2
Cutoff power-law model
Time interval is from   -6.284 sec. to   62.640 sec.
Spectral model in the cutoff power-law:
------------------------------------------------------------
Parameters  : value       lower 90%   higher 90%
Photon index: -1.31584     ( -0.358552   0.659745 )
Epeak [keV] : 154.334      ( -154.334 -154.334 )
Norm@50keV  : 1.96886E-03    ( -0.000729372   0.00233694 )
------------------------------------------------------------
#Fit statistic : Chi-Squared =          54.02 using 59 PHA bins.
# Reduced chi-squared =         0.9647 for     56 degrees of freedom
# Null hypothesis probability =   5.501570e-01

Photon flux (15-150 keV)    in 68.92 sec: 0.189766 ( -0.01883  0.018463 ) ph/cm2/s
Energy fluence (15-150 keV)             : 9.71483e-07 ( -1.20942e-07  1.20072e-07 ) ergs/cm2
1-s peak spectrum fit
Power-law model
Time interval is from    0.460 sec. to    1.460 sec.

Spectral model in power-law:
------------------------------------------------------------
Parameters  : value       lower 90%   higher 90%
Photon index: -1.33705     ( -0.202973   0.200885 )
Norm@50keV  : 1.24783E-02    ( -0.00152589   0.0015219 )
------------------------------------------------------------
#Fit statistic : Chi-Squared =          37.58 using 59 PHA bins.
# Reduced chi-squared =         0.6593 for     57 degrees of freedom
# Null hypothesis probability =   9.780491e-01

Photon flux (15-150 keV)    in 1 sec: 1.49935 ( -0.18385  0.18405 ) ph/cm2/s
Energy fluence (15-150 keV)             : 1.22245e-07 ( -1.66289e-08  1.67759e-08 ) ergs/cm2
Cutoff power-law model
Time interval is from    0.460 sec. to    1.460 sec.
Spectral model in the cutoff power-law:
------------------------------------------------------------
Parameters  : value       lower 90%   higher 90%
Photon index: -0.644452     ( -0.772778   1.02835 )
Epeak [keV] : 103.627      ( -34.701 -103.627 )
Norm@50keV  : 2.70043E-02    ( -0.0152669   0.0546578 )
------------------------------------------------------------
#Fit statistic : Chi-Squared =          35.59 using 59 PHA bins.
# Reduced chi-squared =         0.6355 for     56 degrees of freedom
# Null hypothesis probability =   9.848147e-01

Photon flux (15-150 keV)    in 1 sec: 1.46385 ( -0.19028  0.18954 ) ph/cm2/s
Energy fluence (15-150 keV)             : 1.17972e-07 ( -1.77899e-08  1.77562e-08 ) ergs/cm2
Time-resolved spectra
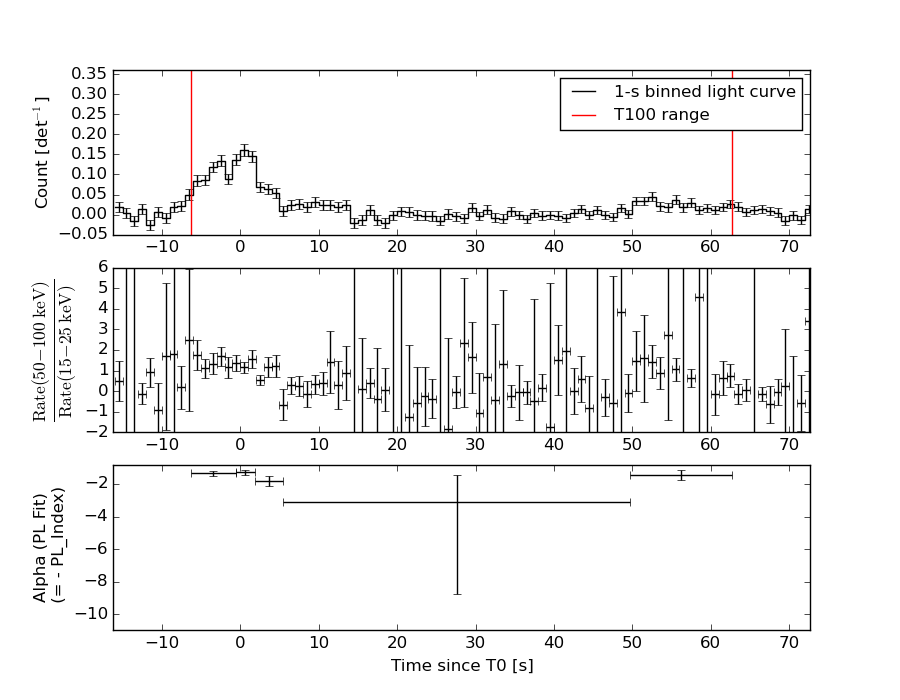
Distribution
T90 vs. Hardness ratio plot
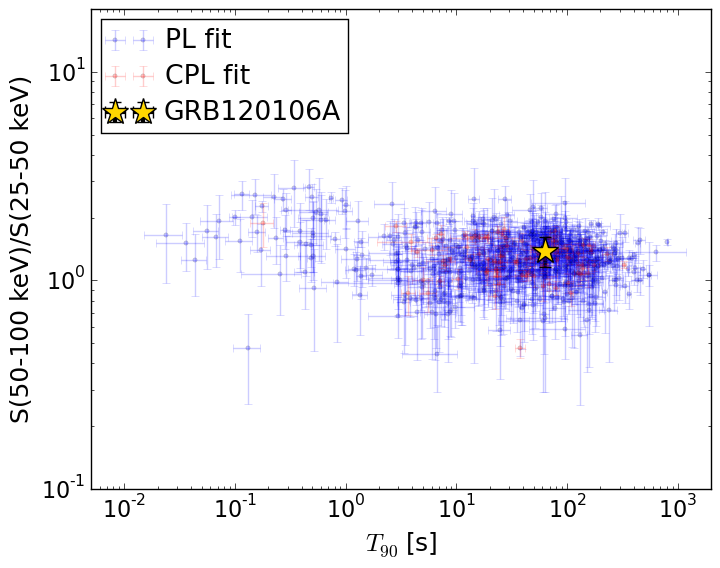
T90                                   = 63.5 sec.
Hardness ratio (energy fluence ratio) = 1.38774623518
S(15-50 keV) vs. S(50-150 keV) plot
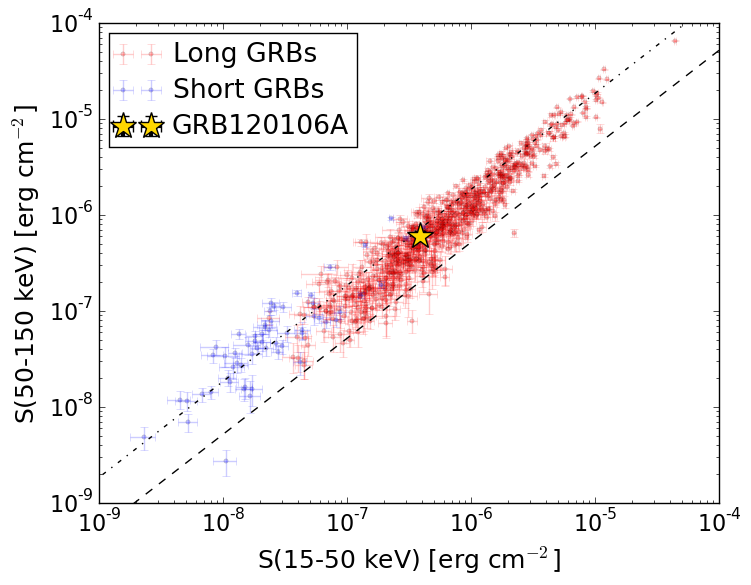
S(15-50 keV)  = 3.857729e-07
S(50-150 keV) = 6.052342e-07
The dash-dotted line and the dashed line traces the fluences calculated from the Band function with Epeak = 15 and 150 keV, respectively. Both lines assume a canonical values of alpha = -1 and beta = -2.5.
Mask shadow pattern
IMX = 5.310376570901550E-01, IMY = -1.535421415736369E-01
Spacecraft aspect plot
Bright source in the pre-burst/pre-slew/post-slew images
Pre-burst image of 15-350 keV band
Time interval of the image:
-748.599400 -731.865300
-239.000000 -34.849300
-34.000000 -6.284000

# RAcent  DECcent POSerr Theta    Phi  PeakCts   SNR AngSep     Name
#  [deg]    [deg]    ['] [deg]  [deg]                   [']
 83.6541  22.0091    1.1  39.5   97.1   9.0544  10.6    1.2	Crab
 10.0686  32.8341    2.2  26.2  -99.5   1.3737   5.3 ------	UNKNOWN
 11.1388  27.5550    3.6  27.8 -110.8   0.8704   3.2 ------	UNKNOWN
  2.1397  34.5024    2.6  31.8  -91.4   1.4079   4.4 ------	UNKNOWN
  7.1489   0.5215    3.6  49.7 -137.9   2.6740   3.2  430.1	UNKNOWN
328.9875  57.8448    2.6  49.1  -48.1   4.7145   4.4 ------	UNKNOWN
Pre-slew background subtracted image of 15-350 keV band
Time interval of the image:
-6.284000 12.300600

# RAcent  DECcent POSerr Theta    Phi  PeakCts   SNR AngSep     Name
#  [deg]    [deg]    ['] [deg]  [deg]                   [']
 83.4574  21.9643    3.5  39.4   97.3   0.6370   3.3   10.2	Crab
104.4571  77.6952    2.2  46.4    9.3   0.5453   5.2 ------	UNKNOWN
 66.1305  64.0489    0.5  28.9   16.1   1.3643  21.7 ------	UNKNOWN
Post-slew image of 15-350 keV band
Time interval of the image:
63.900600 963.099000
1257.000000 1409.160000

# RAcent  DECcent POSerr Theta    Phi  PeakCts   SNR AngSep     Name
#  [deg]    [deg]    ['] [deg]  [deg]                   [']
194.9918  76.3282    3.1  36.0  -18.9   2.6304   3.7 ------	UNKNOWN
 19.7459  30.6801    3.9  44.1 -153.6   3.1854   3.0 ------	UNKNOWN
336.3593  57.2295    4.7  40.8  -93.1   8.9075   2.5 ------	UNKNOWN