Analysis Summary
Notes:
- 1) No attempt has been made to eliminate the non-significant decimal places.
- 2) This batgrbproduct analysis is done using the HEASARC data.
- 3) This batgrbproduct analysis is using the flight position for the mask-weighting calculation.
==========================================================================
           BAT GROUND-DETECTED GRB DATA PROCESSING REPORT
    Process Script: hand-made scripts that follow steps in batgrbproduct
                    but without using TDRSS info
    Process Start Time: Sun Nov 30 02:51:35 EST 2014
             Host Name: bat1
   Current Working Dir: /local/data/bat1/alien/Swift_3rdBATcatalog/event/ground_detect_bursts/scripts
==========================================================================

  BAT Trigger Time: 348250808.0
               UTC: 2012-01-14T16:20:00.217   [includes UTCF correction]
       Where From?: Ground analysis (best_duration.txt)
  NOTE: BAT trigger time for ground-detected burst is the T100 start time.

  Refined Position:   [ source = BAT pre-slew image ]
    RA: 317.929928197   Dec: 57.0286672666  [deg; J2000]
        { 21h 11m 43.2s , +57d 01' 43.2" }
        +/- 2.05337081701 [arcmin] (estimated 90% radius based on SNR)
    SNR: 10.8841174223


  Angular difference between the analysis and refined position is Usage: arcmin

  Partial Coding Fraction: 1.425781e-01    [ including projection effects ]

  Duration
     T90: 48. +/- 1.6
        Measured from: 1.6
                   to: 49.6     [s; relative to TRIGTIME]
     T50: 27.2000000476837 +/- 1.6
        Measured from: 11.2
                   to: 38.4     [s; relative to TRIGTIME]


====== Table of the duration information =============================

        Value   tstart    tstop
T100   51.200    0.000   51.200
T90    48.000    1.600   49.600
T50    27.200   11.200   38.400
Peak    1.000    3.500    4.500


====== Spectral Analysis Summary =====================================

Model      : spectral model: simple power-law (PL) and cutoff power-law (CPL)
Ph_index   : photon index: E^{Ph_index}
Ph_90err   : 90% error of the photon index
Epeak      : Epeak in keV
Epeak_90err: 90% error of Epeak
Norm       : normalization at 50 keV in both the PL model and CPL model
Nomr_90err : 90% error of the normalization
chi2       : Chi-Squared
dof        : degree of freedo

=== Time-averaged spectral analysis ===
(Best model with acceptable fit: PL)

Model Ph_index Ph_90err_low Ph_90err_hi  Epeak  Epeak_90err_low  Epeak_90err_hi  Norm       Nomr_90err_low    Norm_90err_hi    chi2    dof
PL      -1.221    -0.267      0.280       -           -               -         9.46e-03     -1.55e-03          1.53e-03      33.820   57
CPL     -0.923     0.923      1.250      220.511    -220.511      -220.511      1.26e-02     -4.56e-03          2.71e-02      33.590   56


=== 1-s peak spectral analysis ===
(Best model with acceptable fit: N/A)

Model Ph_index Ph_90err_low Ph_90err_hi  Epeak  Epeak_90err_low  Epeak_90err_hi  Norm       Nomr_90err_low    Norm_90err_hi    chi2    dof
PL      -1.110     -0.646     0.737       -           -               -         9.83e-03     -4.50e-03          4.36e-03      59.490   57
CPL      4.429     -3.431    -4.429       80.908     -18.074       175.754      6.88e-01     -6.88e-01          5.80e+01      56.200   56


=== Fluence/Peak Flux Summary ===

              Model    Band1     Band2     Band3     Band4     Band5     Total
                       15-25     25-50    50-100    100-350    15-150    15-350    keV
Fluence         PL   7.54e-08  1.64e-07  2.82e-07  1.12e-06  7.73e-07  1.64e-06   erg/cm2
      90%_error_low -2.37e-08 -3.38e-08 -4.73e-08 -3.69e-07 -1.23e-07 -3.98e-07   erg/cm2
      90%_error_hi   2.66e-08  3.30e-08  4.67e-08  4.76e-07  1.23e-07  4.81e-07   erg/cm2
Peak flux       PL   2.78e-01  3.54e-01  3.28e-01  5.34e-01  1.14e+00  1.49e+00   ph/cm2/s
      90%_error_low -2.78e-01 -1.95e-01 -1.38e-01 -3.35e-01 -5.23e-01 -6.23e-01   ph/cm2/s
      90%_error_hi   2.87e-01  2.03e-01  1.38e-01  5.39e-01  5.56e-01  6.23e-01   ph/cm2/s

Fluence        CPL   6.93e-08  1.67e-07  2.94e-07  8.06e-07  7.69e-07  1.34e-06   erg/cm2
      90%_error_low -3.01e-08 -3.53e-08 -5.62e-08 -5.20e-07 -1.25e-07 -5.29e-07   erg/cm2
      90%_error_hi   3.13e-08  3.60e-08  6.26e-08  4.29e-07  1.24e-07  4.60e-07   erg/cm2
Peak flux      CPL   1.59e-02  2.11e-01  5.27e-01  1.09e-01  8.56e-01  8.64e-01   ph/cm2/s
      90%_error_low -1.59e-02 -2.11e-01 -2.28e-01 -1.09e-01 -3.70e-01 -3.78e-01   ph/cm2/s
      90%_error_hi   3.16e-01  3.26e-01  2.34e-01  3.92e-01  6.01e-01  6.97e-01   ph/cm2/s

======================================================================
Image
15.0-350.0 keV image (Event data)
#RAcent DECcent POSerr Theta  Phi  Peak_Cts  SNR Name
317.930 57.029 0.018 55.098 -10.911 1.225 10.884 TRIG_00511739

Image time interval: -2.000 to 8.101 [sec]
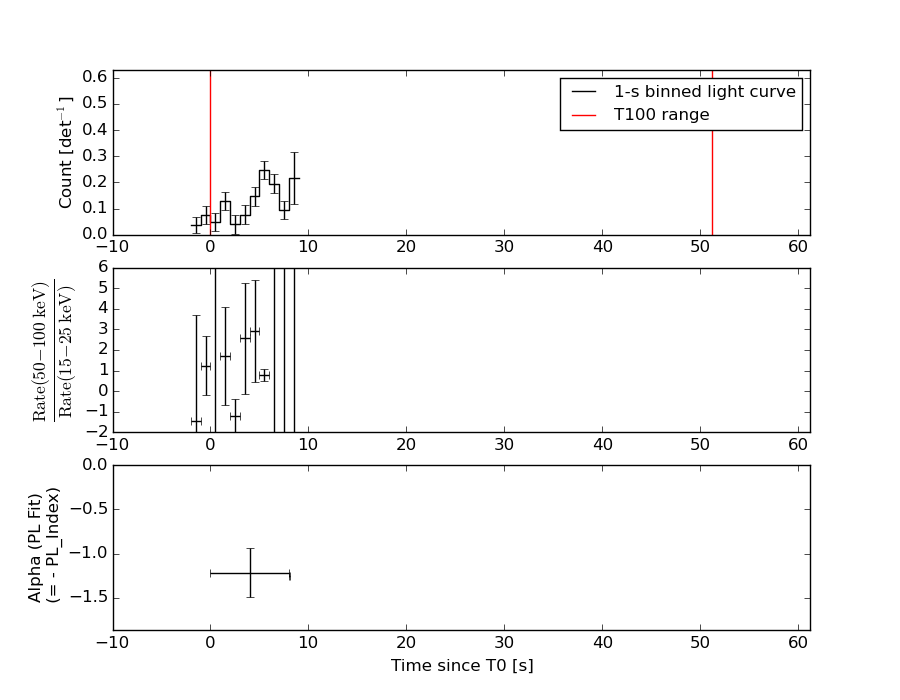
Light Curves
Note: The mask-weighted lightcurves have units of either count/det or counts/sec/det, where a det is 0.4 x 0.4 = 0.16 sq cm.
Best duration plot
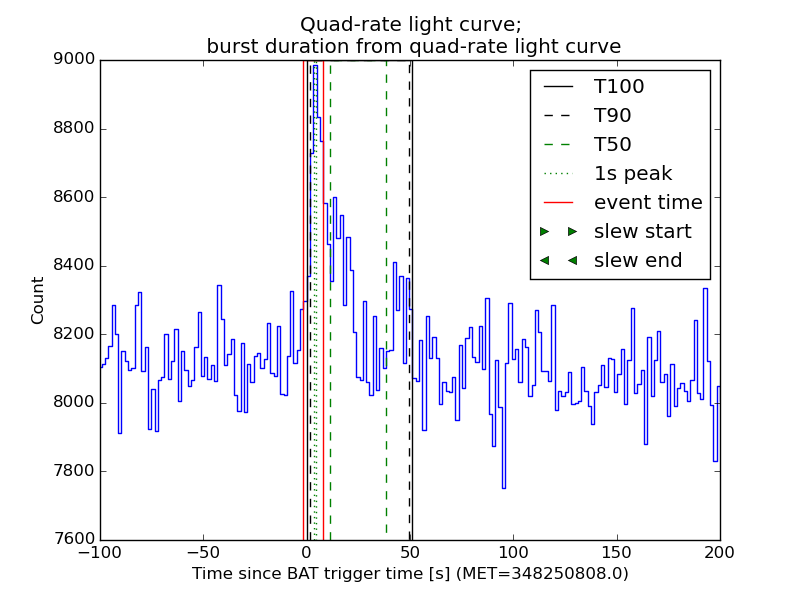
Full-time range; 1 s binning
Other quick-look light curves:
- 64 ms binning (zoomed)
- 16 ms binning (zoomed)
- 8 ms binning (zoomed)
- 2 ms binning (zoomed)
- SN=5 or 10 s binning (full-time range)
- Raw light curve
Spectra
- 64 ms binning (zoomed)
- 16 ms binning (zoomed)
- 8 ms binning (zoomed)
- 2 ms binning (zoomed)
- SN=5 or 10 s binning (full-time range)
- Raw light curve
Spectra
Notes:
- 1) The fitting includes the systematic errors.
- 2) When the burst includes telescope slew time periods, the fitting uses an average response file made from multiple 5-s response files through out the slew time plus single time preiod for the non-slew times, and weighted by the total counts in the corresponding time period using addrmf. An average response file is needed becuase a spectral fit using the pre-slew DRM will introduce some errors in both a spectral shape and a normalization if the PHA file contains a lot of the slew/post-slew time interval.
- 3) For fits to more complicated models (e.g. a power-law over a cutoff power-law), the BAT team has decided to require a chi-square improvement of more than 6 for each extra dof.
Time averaged spectrum fit using the average DRM
Power-law model
Time interval is from    0.000 sec. to    8.101 sec.

Spectral model in power-law:
------------------------------------------------------------
Parameters  : value       lower 90%   higher 90%
Photon index: -1.2206     ( -0.267352   0.280063 )
Norm@50keV  : 9.46166E-03    ( -0.0015514   0.0015323 )
------------------------------------------------------------
#Fit statistic : Chi-Squared =          33.82 using 59 PHA bins.
# Reduced chi-squared =         0.5934 for     57 degrees of freedom
# Null hypothesis probability =   9.937701e-01

Photon flux (15-150 keV)    in 8.101 sec: 1.11394 ( -0.196953  0.19953 ) ph/cm2/s
Energy fluence (15-150 keV)             : 7.73283e-07 ( -1.23021e-07  1.23069e-07 ) ergs/cm2
Cutoff power-law model
Time interval is from    0.000 sec. to    8.101 sec.
Spectral model in the cutoff power-law:
------------------------------------------------------------
Parameters  : value       lower 90%   higher 90%
Photon index: -0.922559     ( 0.922559   1.24965 )
Epeak [keV] : 220.511      ( -220.511 -220.511 )
Norm@50keV  : 1.26481E-02    ( -0.0045558   0.0270677 )
------------------------------------------------------------
#Fit statistic : Chi-Squared =          33.59 using 59 PHA bins.
# Reduced chi-squared =         0.5998 for     56 degrees of freedom
# Null hypothesis probability =   9.923984e-01

Photon flux (15-150 keV)    in 8.101 sec: 1.09833 ( -0.203256  0.20583 ) ph/cm2/s
Energy fluence (15-150 keV)             : 7.69217e-07 ( -1.25035e-07  1.24251e-07 ) ergs/cm2
1-s peak spectrum fit
Power-law model
Time interval is from    3.500 sec. to    4.500 sec.

Spectral model in power-law:
------------------------------------------------------------
Parameters  : value       lower 90%   higher 90%
Photon index: -1.11002     ( -0.647907   0.734717 )
Norm@50keV  : 9.82839E-03    ( -0.00449511   0.00436607 )
------------------------------------------------------------
#Fit statistic : Chi-Squared =          59.49 using 59 PHA bins.
# Reduced chi-squared =          1.044 for     57 degrees of freedom
# Null hypothesis probability =   3.849194e-01

Photon flux (15-150 keV)    in 1 sec: 1.14047 ( -0.522624  0.55581 ) ph/cm2/s
Energy fluence (15-150 keV)             : 1.02452e-07 ( -4.2732e-08  4.28796e-08 ) ergs/cm2
Cutoff power-law model
Time interval is from    3.500 sec. to    4.500 sec.
Spectral model in the cutoff power-law:
------------------------------------------------------------
Parameters  : value       lower 90%   higher 90%
Photon index: 5.06589     ( -4.22974   -5.22867 )
Epeak [keV] : 79.8218      ( -16.6982 177.13 )
Norm@50keV  : 1.06571    ( -1.33569   57.3345 )
------------------------------------------------------------
#Fit statistic : Chi-Squared =          56.19 using 59 PHA bins.
# Reduced chi-squared =          1.003 for     56 degrees of freedom
# Null hypothesis probability =   4.677735e-01

Photon flux (15-150 keV)    in 1 sec: 0.856393 ( -0.369516  0.600697 ) ph/cm2/s
Energy fluence (15-150 keV)             : 9.33082e-08 ( -4.04722e-08  4.57351e-08 ) ergs/cm2
Time-resolved spectra
Distribution
T90 vs. Hardness ratio plot
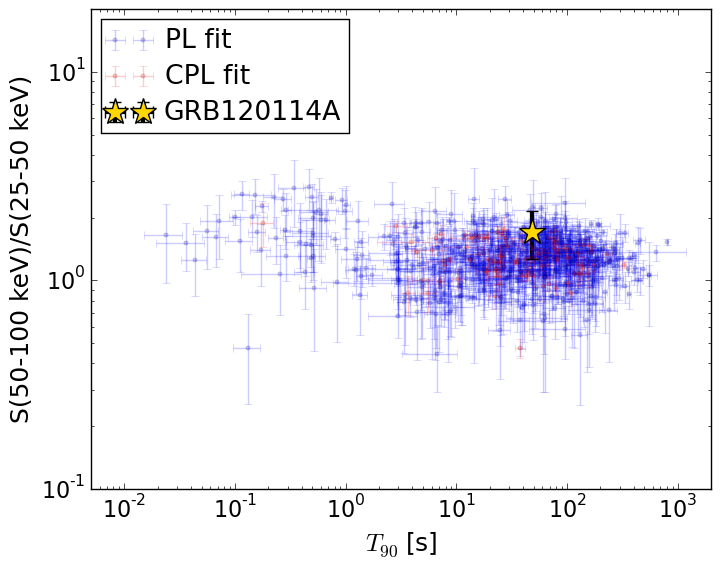
T90                                   = 48.0 sec.
Hardness ratio (energy fluence ratio) = 1.71644611557
S(15-50 keV) vs. S(50-150 keV) plot
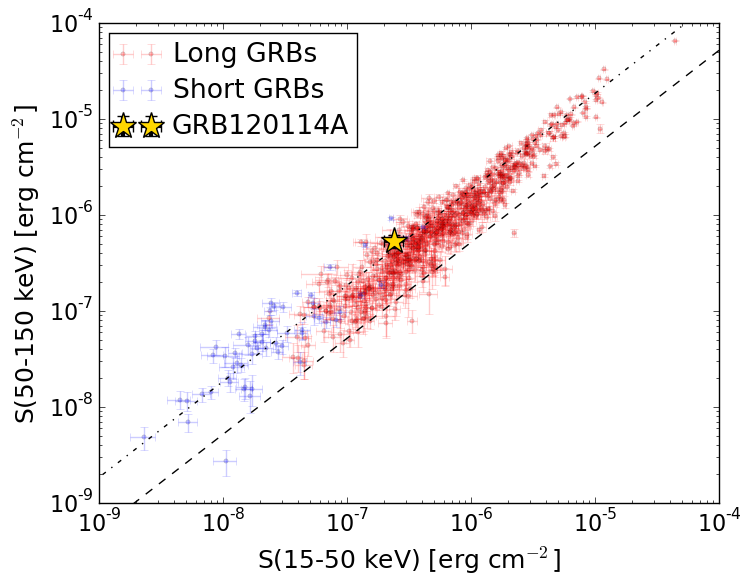
S(15-50 keV)  = 2.3979086e-07
S(50-150 keV) = 5.33488e-07
The dash-dotted line and the dashed line traces the fluences calculated from the Band function with Epeak = 15 and 150 keV, respectively. Both lines assume a canonical values of alpha = -1 and beta = -2.5.
Mask shadow pattern
IMX = 1.40744006143, IMY = 0.271312476419
Spacecraft aspect plot
Bright source in the event data image
Event data image of 15-350 keV band
Time interval of the image:
-2.000000 8.100900

# RAcent  DECcent POSerr Theta    Phi  PeakCts   SNR AngSep     Name
#  [deg]    [deg]    ['] [deg]  [deg]                   [']
308.1646  41.0814    5.3  56.4  -31.6   0.4216   2.2    8.1	Cyg X-3
326.2612  38.4420    7.3  42.3  -30.5  -0.0885  -1.6    8.4	Cyg X-2
317.9299  57.0287    1.1  55.1  -10.9   1.2251  10.9 ------	UNKNOWN
Webpage updated on:
Sun Jun 21 01:09:17 EDT 2015