Analysis Summary
Notes:
- 1) No attempt has been made to eliminate the non-significant decimal places.
- 2) This batgrbproduct analysis is done using the HEASARC data.
- 3) This batgrbproduct analysis is using the flight position for the mask-weighting calculation.
======================================================================
BAT GRB EVENT DATA PROCESSING REPORT
Process Script Ver: batgrbproduct v2.46
Process Start Time: Mon Jan 13 07:13:33 EST 2014
Host Name: batevent1
Current Working Dir: /local/data/batevent/batevent_reproc/trigger512003
======================================================================
Trigger: 00512003 Segment: 000
BAT Trigger Time: 348598828.992 [s; MET]
Trigger Stop: 348598830.016 [s; MET]
UTC: 2012-01-18T17:00:21.195400 [includes UTCF correction]
Where From?: TDRSS position message
BAT
RA: 124.86615353153 Dec: -7.18171893580232 [deg; J2000]
Catalogged Source?: NO
Point Source?: YES
GRB Indicated?: YES [ by BAT flight software ]
Image S/N Ratio: 7.09
Image Trigger?: NO
Rate S/N Ratio: 9.32737905308882 [ if not an image trigger ]
Image S/N Ratio: 7.09
Analysis Position: [ source = BAT ]
RA: 124.86615353153 Dec: -7.18171893580232 [deg; J2000]
Refined Position: [ source = BAT pre-slew burst ]
RA: 124.865649023424 Dec: -7.18247582301905 [deg; J2000]
{ 08h 19m 27.8s , -07d 10' 56.9" }
+/- 1.16587307657909 [arcmin] (estimated 90% radius based on SNR)
+/- 0.363228600514425 [arcmin] (formal 1-sigma fit error)
SNR: 24.4288079513759
Angular difference between the analysis and refined position is 0.054446 arcmin
Partial Coding Fraction: 0.4023438 [ including projection effects ]
Duration
T90: 20.3039999604225 +/- 2.69527737315058
Measured from: 1.19200003147125
to: 21.4959999918938 [s; relative to TRIGTIME]
T50: 9.48399990797043 +/- 1.35020593564578
Measured from: 5.64000004529953
to: 15.12399995327 [s; relative to TRIGTIME]
Fluence
Peak Flux (peak 1 second)
Measured from: 6.68800002336502
to: 7.68800002336502 [s; relative to TRIGTIME]
Total Fluence
Measured from: -1.94400000572205
to: 27.4520000219345 [s; relative to TRIGTIME]
Band 1 Band 2 Band 3 Band 4
15-25 25-50 50-100 100-350 keV
Total 1.141019 1.242310 0.617792 0.146510
0.053204 0.055360 0.047899 0.040806 [error]
Peak 0.084909 0.100161 0.046212 0.017445
0.010752 0.011454 0.009655 0.007657 [error]
[ fluence units of on-axis counts / fully illuminated detector ]
======================================================================
====== Table of the duration information =============================
Value tstart tstop
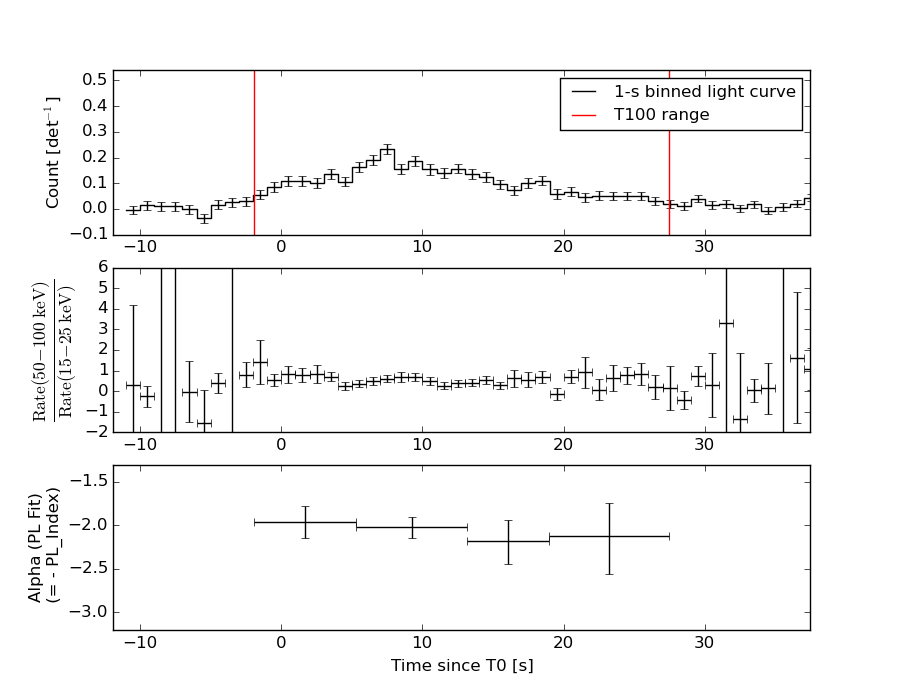
T100 29.396 -1.944 27.452
T90 20.304 1.192 21.496
T50 9.484 5.640 15.124
Peak 1.000 6.688 7.688
====== Spectral Analysis Summary =====================================
Model : spectral model: simple power-law (PL) and cutoff power-law (CPL)
Ph_index : photon index: E^{Ph_index}
Ph_90err : 90% error of the photon index
Epeak : Epeak in keV
Epeak_90err: 90% error of Epeak
Norm : normalization at 50 keV in both the PL model and CPL model
Nomr_90err : 90% error of the normalization
chi2 : Chi-Squared
dof : degree of freedo
=== Time-averaged spectral analysis ===
(Best model with acceptable fit: PL)
Model Ph_index Ph_90err_low Ph_90err_hi Epeak Epeak_90err_low Epeak_90err_hi Norm Nomr_90err_low Norm_90err_hi chi2 dof
PL -2.070 -0.108 0.106 - - - 6.44e-03 -4.31e-04 4.26e-04 43.830 57
CPL -1.593 -0.423 0.481 36.891 -27.824 11.839 1.19e-02 -4.90e-03 1.01e-02 40.170 56
=== 1-s peak spectral analysis ===
(Best model with acceptable fit: PL)
Model Ph_index Ph_90err_low Ph_90err_hi Epeak Epeak_90err_low Epeak_90err_hi Norm Nomr_90err_low Norm_90err_hi chi2 dof
PL -1.899 -0.241 0.228 - - - 1.51e-02 -2.42e-03 2.36e-03 65.640 57
CPL -1.444 -0.738 1.431 51.046 N/A N/A 2.78e-02 N/A N/A 65.120 56
=== Fluence/Peak Flux Summary ===
Model Band1 Band2 Band3 Band4 Band5 Total
15-25 25-50 50-100 100-350 15-150 15-350 keV
Fluence PL 4.14e-07 5.38e-07 5.13e-07 8.66e-07 1.75e-06 2.33e-06 erg/cm2
90%_error_low -3.42e-08 -2.94e-08 -4.72e-08 -1.51e-07 -1.08e-07 -2.03e-07 erg/cm2
90%_error_hi 3.50e-08 2.94e-08 4.77e-08 1.72e-07 1.09e-07 2.17e-07 erg/cm2
Peak flux PL 9.10e-01 7.24e-01 3.88e-01 3.03e-01 2.16e+00 2.33e+00 ph/cm2/s
90%_error_low -1.72e-01 -9.61e-02 -7.99e-02 -1.05e-01 -2.88e-01 -3.12e-01 ph/cm2/s
90%_error_hi 1.77e-01 9.61e-02 8.03e-02 1.33e-01 2.88e-01 3.13e-01 ph/cm2/s
Fluence CPL 3.92e-07 5.66e-07 5.06e-07 3.97e-07 1.67e-06 1.86e-06 erg/cm2
90%_error_low -3.96e-08 -3.82e-08 -5.29e-08 -1.90e-07 -1.27e-07 -2.35e-07 erg/cm2
90%_error_hi 4.00e-08 3.90e-08 5.16e-08 3.94e-07 1.29e-07 4.11e-07 erg/cm2
Peak flux CPL 8.78e-01 7.69e-01 3.88e-01 1.59e-01 2.14e+00 2.19e+00 ph/cm2/s
90%_error_low -1.94e-01 -1.99e-01 -9.74e-02 -1.59e-01 -2.96e-01 -3.37e-01 ph/cm2/s
90%_error_hi 1.92e-01 1.51e-01 8.70e-02 1.81e-01 2.94e-01 3.80e-01 ph/cm2/s
======================================================================
Image
Pre-slew 15.0-350.0 keV image (Event data)
#   RAcent    DECcent   POSerr    Theta     Phi              Peak Cts       SNR   Name
  124.8656    -7.1825   0.0079    35.5778    31.7859         1.9275449     24.429 TRIG_00512003

Foreground time interval of the image:
 -1.944  11.709 (delta_t =  13.653 [sec])
Background time interval of the image:
-239.992  -1.944 (delta_t = 238.048 [sec])
Light Curves
Note: The mask-weighted lightcurves have units of either count/det or counts/sec/det, where a det is 0.4 x 0.4 = 0.16 sq cm.
Full-time range; 1 s binning
Other quick-look light curves:
- 64 ms binning (zoomed)
- 16 ms binning (zoomed)
- 8 ms binning (zoomed)
- 2 ms binning (zoomed)
- SN=5 or 10 s binning (full-time range)
- Raw light curve
Spectra
- 64 ms binning (zoomed)
- 16 ms binning (zoomed)
- 8 ms binning (zoomed)
- 2 ms binning (zoomed)
- SN=5 or 10 s binning (full-time range)
- Raw light curve
Spectra
Notes:
- 1) The fitting includes the systematic errors.
- 2) When the burst includes telescope slew time periods, the fitting uses an average response file made from multiple 5-s response files through out the slew time plus single time preiod for the non-slew times, and weighted by the total counts in the corresponding time period using addrmf. An average response file is needed becuase a spectral fit using the pre-slew DRM will introduce some errors in both a spectral shape and a normalization if the PHA file contains a lot of the slew/post-slew time interval.
- 3) For fits to more complicated models (e.g. a power-law over a cutoff power-law), the BAT team has decided to require a chi-square improvement of more than 6 for each extra dof.
Time averaged spectrum fit using the average DRM
Power-law model
Time interval is from   -1.944 sec. to   27.452 sec.

Spectral model in power-law:
------------------------------------------------------------
Parameters  : value       lower 90%   higher 90%
Photon index: -2.06997     ( -0.1084   0.10555 )
Norm@50keV  : 6.43528E-03    ( -0.00043143   0.000426282 )
------------------------------------------------------------
#Fit statistic : Chi-Squared =          43.83 using 59 PHA bins.
# Reduced chi-squared =         0.7689 for     57 degrees of freedom
# Null hypothesis probability =   8.997743e-01

Photon flux (15-150 keV)    in 29.4 sec: 0.997772 ( -0.056143  0.056228 ) ph/cm2/s
Energy fluence (15-150 keV)             : 1.75342e-06 ( -1.08116e-07  1.09037e-07 ) ergs/cm2
Cutoff power-law model
Time interval is from   -1.944 sec. to   27.452 sec.
Spectral model in the cutoff power-law:
------------------------------------------------------------
Parameters  : value       lower 90%   higher 90%
Photon index: -1.593     ( -0.422657   0.481261 )
Epeak [keV] : 36.8910      ( -27.8237 11.8392 )
Norm@50keV  : 1.18858E-02    ( -0.00490403   0.0100584 )
------------------------------------------------------------
#Fit statistic : Chi-Squared =          40.17 using 59 PHA bins.
# Reduced chi-squared =         0.7173 for     56 degrees of freedom
# Null hypothesis probability =   9.453502e-01

Photon flux (15-150 keV)    in 29.4 sec: 0.973227 ( -0.060144  0.060163 ) ph/cm2/s
Energy fluence (15-150 keV)             : 1.6742e-06 ( -1.26855e-07  1.28599e-07 ) ergs/cm2
1-s peak spectrum fit
Power-law model
Time interval is from    6.688 sec. to    7.688 sec.

Spectral model in power-law:
------------------------------------------------------------
Parameters  : value       lower 90%   higher 90%
Photon index: -1.89927     ( -0.241273   0.227833 )
Norm@50keV  : 1.50556E-02    ( -0.00241963   0.00235627 )
------------------------------------------------------------
#Fit statistic : Chi-Squared =          65.64 using 59 PHA bins.
# Reduced chi-squared =          1.152 for     57 degrees of freedom
# Null hypothesis probability =   2.022423e-01

Photon flux (15-150 keV)    in 1 sec: 2.16010 ( -0.28785  0.28791 ) ph/cm2/s
Energy fluence (15-150 keV)             : 1.38439e-07 ( -2.15725e-08  2.19409e-08 ) ergs/cm2
Cutoff power-law model
Time interval is from    6.688 sec. to    7.688 sec.
Spectral model in the cutoff power-law:
------------------------------------------------------------
Parameters  : value       lower 90%   higher 90%
Photon index: -1.44376     ( -0.739266   1.4291 )
Epeak [keV] : 51.0456      (   )
Norm@50keV  : 2.78018E-02    (     )
------------------------------------------------------------
#Fit statistic : Chi-Squared =          65.12 using 59 PHA bins.
# Reduced chi-squared =          1.163 for     56 degrees of freedom
# Null hypothesis probability =   1.891218e-01

Photon flux (15-150 keV)    in 1 sec: 2.13556 ( -0.29623  0.29416 ) ph/cm2/s
Energy fluence (15-150 keV)             : 0 ( 0  0 ) ergs/cm2
Time-resolved spectra
Distribution
T90 vs. Hardness ratio plot
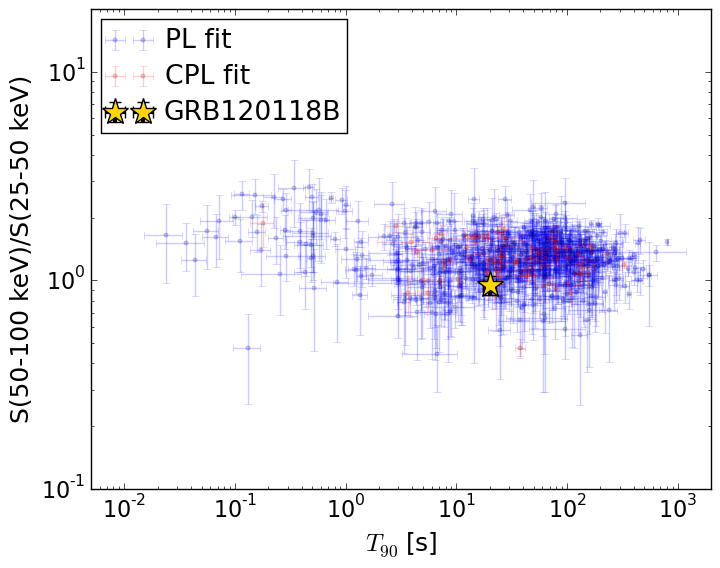
T90                                   = 20.304 sec.
Hardness ratio (energy fluence ratio) = 0.952686649797
S(15-50 keV) vs. S(50-150 keV) plot
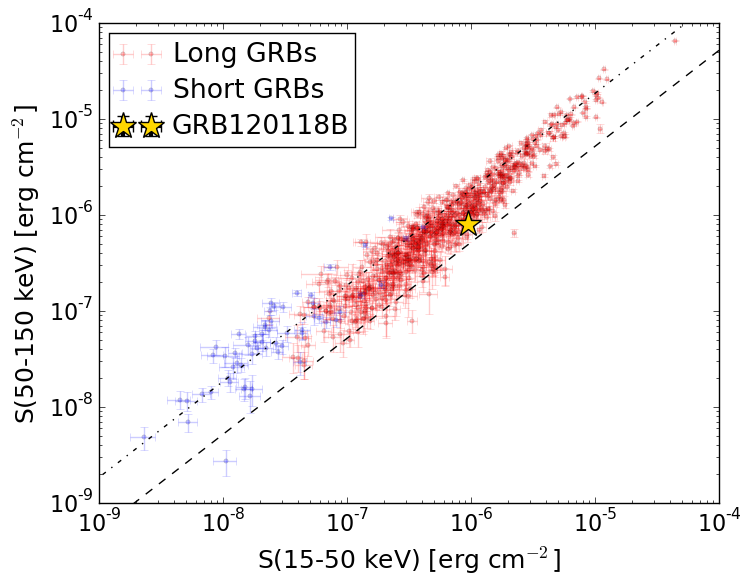
S(15-50 keV)  = 9.520128e-07
S(50-150 keV) = 8.01408e-07
The dash-dotted line and the dashed line traces the fluences calculated from the Band function with Epeak = 15 and 150 keV, respectively. Both lines assume a canonical values of alpha = -1 and beta = -2.5.
Mask shadow pattern
IMX = 6.080588210922173E-01, IMY = -3.768046190414206E-01
Spacecraft aspect plot
Bright source in the pre-burst/pre-slew/post-slew images
Pre-burst image of 15-350 keV band
Time interval of the image:
-239.992000 -1.944000

# RAcent  DECcent POSerr Theta    Phi  PeakCts   SNR AngSep     Name
#  [deg]    [deg]    ['] [deg]  [deg]                   [']
115.9989  -8.2972    3.2  42.8   39.8   1.9666   3.7 ------	UNKNOWN
136.8921 -12.7111    3.1  33.6    8.9   0.9909   3.8 ------	UNKNOWN
208.4467  61.2118    3.5  59.0 -166.2   4.5564   3.3 ------	UNKNOWN
177.9807 -21.0021    3.5  47.8  -50.9   3.4769   3.3 ------	UNKNOWN
190.1874   6.4477    3.7  40.8  -93.2   3.5408   3.1 ------	UNKNOWN
191.9887  10.5197    2.9  41.2  -99.9   4.8462   4.1 ------	UNKNOWN
Pre-slew background subtracted image of 15-350 keV band
Time interval of the image:
-1.944000 11.708590

# RAcent  DECcent POSerr Theta    Phi  PeakCts   SNR AngSep     Name
#  [deg]    [deg]    ['] [deg]  [deg]                   [']
108.5082  13.5794    2.8  40.2   74.8   0.7525   4.1 ------	UNKNOWN
124.8656  -7.1825    0.5  35.6   31.8   1.9275  24.4 ------	UNKNOWN
Post-slew image of 15-350 keV band
Time interval of the image:
94.308600 782.086500
900.008000 962.069600

# RAcent  DECcent POSerr Theta    Phi  PeakCts   SNR AngSep     Name
#  [deg]    [deg]    ['] [deg]  [deg]                   [']
135.5393 -40.6123    2.8  34.8  -94.6   4.8162   4.1    3.5	Vela X-1
 85.9492 -16.9227    3.5  39.2   -8.4   1.9037   3.3 ------	UNKNOWN
 66.8911 -20.0667    3.4  57.5   -9.6   6.7066   3.4 ------	UNKNOWN