Analysis Summary
Notes:
- 1) No attempt has been made to eliminate the non-significant decimal places.
- 2) This batgrbproduct analysis is done using the HEASARC data.
- 3) This batgrbproduct analysis is using the flight position for the mask-weighting calculation.
======================================================================
BAT GRB EVENT DATA PROCESSING REPORT
Process Script Ver: batgrbproduct v2.46
Process Start Time: Mon Jan 13 07:02:03 EST 2014
Host Name: batevent1
Current Working Dir: /local/data/batevent/batevent_reproc/trigger512164
======================================================================
Trigger: 00512164 Segment: 000
BAT Trigger Time: 348831747.072 [s; MET]
Trigger Stop: 348831751.168 [s; MET]
UTC: 2012-01-21T09:42:19.266000 [includes UTCF correction]
Where From?: TDRSS position message
BAT
RA: 249.336314295725 Dec: -23.9543948122384 [deg; J2000]
Catalogged Source?: NO
Point Source?: YES
GRB Indicated?: YES [ by BAT flight software ]
Image S/N Ratio: 9.97
Image Trigger?: NO
Rate S/N Ratio: 8.94427190999916 [ if not an image trigger ]
Image S/N Ratio: 9.97
Analysis Position: [ source = BAT ]
RA: 249.336314295725 Dec: -23.9543948122384 [deg; J2000]
Refined Position: [ source = BAT pre-slew burst ]
RA: 249.363059302669 Dec: -23.9605202040783 [deg; J2000]
{ 16h 37m 27.1s , -23d 57' 37.9" }
+/- 1.38765494269346 [arcmin] (estimated 90% radius based on SNR)
+/- 0.427145077573602 [arcmin] (formal 1-sigma fit error)
SNR: 19.0484267830923
Angular difference between the analysis and refined position is 1.511804 arcmin
Partial Coding Fraction: 0.703125 [ including projection effects ]
Duration
T90: 26.7999999523163 +/- 3.41916774787436
Measured from: -9.62800002098083
to: 17.1719999313354 [s; relative to TRIGTIME]
T50: 11.4919999241829 +/- 2.61489955869669
Measured from: -2.77600002288818
to: 8.71599990129471 [s; relative to TRIGTIME]
Fluence
Peak Flux (peak 1 second)
Measured from: 2.85999995470047
to: 3.85999995470047 [s; relative to TRIGTIME]
Total Fluence
Measured from: -11.0040000081062
to: 19.7759999632835 [s; relative to TRIGTIME]
Band 1 Band 2 Band 3 Band 4
15-25 25-50 50-100 100-350 keV
Total 0.282813 0.564119 0.563091 0.149051
0.045146 0.042370 0.036429 0.030258 [error]
Peak 0.019009 0.032302 0.031983 0.009908
0.008107 0.007661 0.006576 0.005449 [error]
[ fluence units of on-axis counts / fully illuminated detector ]
======================================================================
====== Table of the duration information =============================
Value tstart tstop
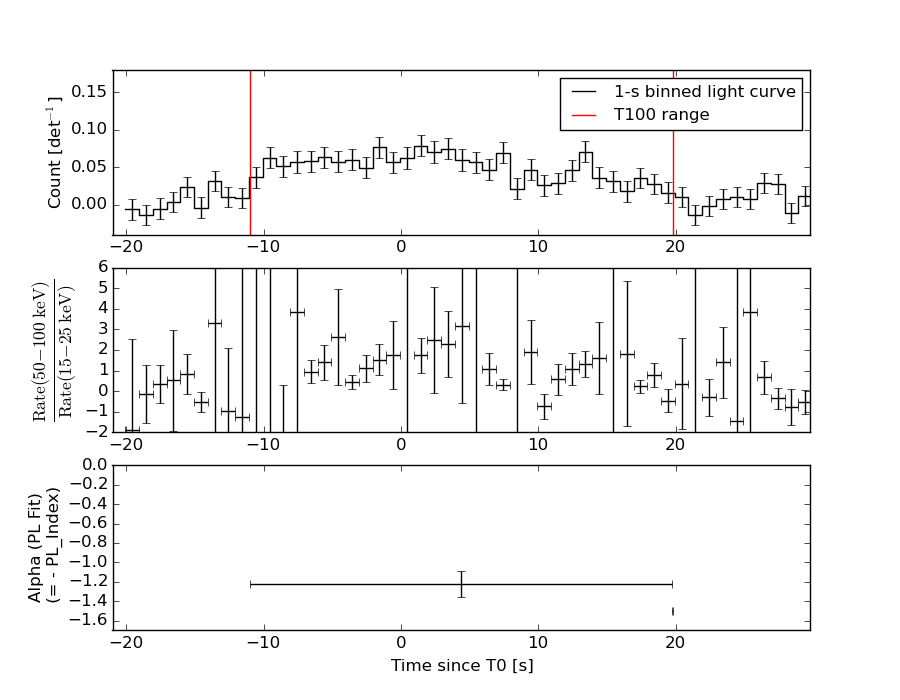
T100 30.780 -11.004 19.776
T90 26.800 -9.628 17.172
T50 11.492 -2.776 8.716
Peak 1.000 2.860 3.860
====== Spectral Analysis Summary =====================================
Model : spectral model: simple power-law (PL) and cutoff power-law (CPL)
Ph_index : photon index: E^{Ph_index}
Ph_90err : 90% error of the photon index
Epeak : Epeak in keV
Epeak_90err: 90% error of Epeak
Norm : normalization at 50 keV in both the PL model and CPL model
Nomr_90err : 90% error of the normalization
chi2 : Chi-Squared
dof : degree of freedo
=== Time-averaged spectral analysis ===
(Best model with acceptable fit: CPL)
Model Ph_index Ph_90err_low Ph_90err_hi Epeak Epeak_90err_low Epeak_90err_hi Norm Nomr_90err_low Norm_90err_hi chi2 dof
PL -1.223 -0.131 0.134 - - - 3.60e-03 -2.76e-04 2.76e-04 59.150 57
CPL -0.365 -0.584 0.681 108.100 -24.864 103.261 8.66e-03 -3.82e-03 8.16e-03 52.470 56
=== 1-s peak spectral analysis ===
(Best model with acceptable fit: PL)
Model Ph_index Ph_90err_low Ph_90err_hi Epeak Epeak_90err_low Epeak_90err_hi Norm Nomr_90err_low Norm_90err_hi chi2 dof
PL -1.397 -0.409 0.415 - - - 6.02e-03 -1.48e-03 1.47e-03 40.100 57
CPL -0.029 -1.063 2.976 78.091 -23.618 -78.091 2.60e-02 -2.60e-02 4.74e-01 38.440 56
=== Fluence/Peak Flux Summary ===
Model Band1 Band2 Band3 Band4 Band5 Total
15-25 25-50 50-100 100-350 15-150 15-350 keV
Fluence PL 1.09e-07 2.38e-07 4.08e-07 1.61e-06 1.12e-06 2.37e-06 erg/cm2
90%_error_low -1.63e-08 -2.20e-08 -3.49e-08 -2.90e-07 -8.92e-08 -3.11e-07 erg/cm2
90%_error_hi 1.72e-08 2.18e-08 3.47e-08 3.32e-07 8.96e-08 3.46e-07 erg/cm2
Peak flux PL 2.24e-01 2.40e-01 1.82e-01 2.26e-01 7.33e-01 8.73e-01 ph/cm2/s
90%_error_low -9.25e-02 -6.82e-02 -5.19e-02 -1.08e-01 -1.88e-01 -2.14e-01 ph/cm2/s
90%_error_hi 1.07e-01 6.68e-02 5.10e-02 1.54e-01 1.90e-01 2.15e-01 ph/cm2/s
Fluence CPL 8.77e-08 2.49e-07 4.41e-07 6.30e-07 1.07e-06 1.41e-06 erg/cm2
90%_error_low -2.06e-08 -2.48e-08 -4.20e-08 -2.63e-07 -9.68e-08 -2.76e-07 erg/cm2
90%_error_hi 2.17e-08 2.51e-08 4.30e-08 5.21e-07 9.65e-08 5.17e-07 erg/cm2
Peak flux CPL 1.62e-01 2.59e-01 2.07e-01 8.00e-02 6.85e-01 7.08e-01 ph/cm2/s
90%_error_low -1.10e-01 -8.03e-02 -6.29e-02 -8.00e-02 -2.00e-01 -2.18e-01 ph/cm2/s
90%_error_hi 1.33e-01 8.19e-02 6.69e-02 2.01e-01 2.01e-01 2.93e-01 ph/cm2/s
======================================================================
Image
Pre-slew 15.0-350.0 keV image (Event data)
#   RAcent    DECcent   POSerr    Theta     Phi              Peak Cts       SNR   Name
  249.3631   -23.9605   0.0101    32.9980   -26.1171         1.5694920     19.048 TRIG_00512164

Foreground time interval of the image:
-11.004  19.776 (delta_t =  30.780 [sec])
Background time interval of the image:
-239.072 -11.004 (delta_t = 228.068 [sec])
Light Curves
Note: The mask-weighted lightcurves have units of either count/det or counts/sec/det, where a det is 0.4 x 0.4 = 0.16 sq cm.
Full-time range; 1 s binning
Other quick-look light curves:
- 64 ms binning (zoomed)
- 16 ms binning (zoomed)
- 8 ms binning (zoomed)
- 2 ms binning (zoomed)
- SN=5 or 10 s binning (full-time range)
- Raw light curve
Spectra
- 64 ms binning (zoomed)
- 16 ms binning (zoomed)
- 8 ms binning (zoomed)
- 2 ms binning (zoomed)
- SN=5 or 10 s binning (full-time range)
- Raw light curve
Spectra
Notes:
- 1) The fitting includes the systematic errors.
- 2) When the burst includes telescope slew time periods, the fitting uses an average response file made from multiple 5-s response files through out the slew time plus single time preiod for the non-slew times, and weighted by the total counts in the corresponding time period using addrmf. An average response file is needed becuase a spectral fit using the pre-slew DRM will introduce some errors in both a spectral shape and a normalization if the PHA file contains a lot of the slew/post-slew time interval.
- 3) For fits to more complicated models (e.g. a power-law over a cutoff power-law), the BAT team has decided to require a chi-square improvement of more than 6 for each extra dof.
Time averaged spectrum fit using the average DRM
Power-law model
Time interval is from  -11.004 sec. to   19.776 sec.

Spectral model in power-law:
------------------------------------------------------------
Parameters  : value       lower 90%   higher 90%
Photon index: -1.22283     ( -0.131331   0.133735 )
Norm@50keV  : 3.60044E-03    ( -0.000276069   0.000275668 )
------------------------------------------------------------
#Fit statistic : Chi-Squared =          59.15 using 59 PHA bins.
# Reduced chi-squared =          1.038 for     57 degrees of freedom
# Null hypothesis probability =   3.970539e-01

Photon flux (15-150 keV)    in 30.78 sec: 0.424024 ( -0.034587  0.034758 ) ph/cm2/s
Energy fluence (15-150 keV)             : 1.11735e-06 ( -8.91927e-08  8.96003e-08 ) ergs/cm2
Cutoff power-law model
Time interval is from  -11.004 sec. to   19.776 sec.
Spectral model in the cutoff power-law:
------------------------------------------------------------
Parameters  : value       lower 90%   higher 90%
Photon index: -0.365091     ( -0.583959   0.681221 )
Epeak [keV] : 108.100      ( -24.8635 103.261 )
Norm@50keV  : 8.66375E-03    ( -0.0038202   0.00815744 )
------------------------------------------------------------
#Fit statistic : Chi-Squared =          52.47 using 59 PHA bins.
# Reduced chi-squared =         0.9370 for     56 degrees of freedom
# Null hypothesis probability =   6.092783e-01

Photon flux (15-150 keV)    in 30.78 sec: 0.404632 ( -0.036915  0.037033 ) ph/cm2/s
Energy fluence (15-150 keV)             : 1.06831e-06 ( -9.68216e-08  9.65341e-08 ) ergs/cm2
1-s peak spectrum fit
Power-law model
Time interval is from    2.860 sec. to    3.860 sec.

Spectral model in power-law:
------------------------------------------------------------
Parameters  : value       lower 90%   higher 90%
Photon index: -1.39693     ( -0.408759   0.414464 )
Norm@50keV  : 6.01987E-03    ( -0.00147531   0.00147376 )
------------------------------------------------------------
#Fit statistic : Chi-Squared =          40.10 using 59 PHA bins.
# Reduced chi-squared =         0.7035 for     57 degrees of freedom
# Null hypothesis probability =   9.563336e-01

Photon flux (15-150 keV)    in 1 sec: 0.732594 ( -0.18805  0.19013 ) ph/cm2/s
Energy fluence (15-150 keV)             : 5.8213e-08 ( -1.5068e-08  1.5257e-08 ) ergs/cm2
Cutoff power-law model

Time interval is from    2.860 sec. to    3.860 sec.
Spectral model in the cutoff power-law:
------------------------------------------------------------
Parameters  : value       lower 90%   higher 90%
Photon index: -0.0286136     ( -1.06336   2.97618 )
Epeak [keV] : 78.0906      ( -23.618 -78.0907 )
Norm@50keV  : 2.59965E-02    ( -0.0259964   0.473637 )
------------------------------------------------------------
#Fit statistic : Chi-Squared =          38.44 using 59 PHA bins.
# Reduced chi-squared =         0.6864 for     56 degrees of freedom
# Null hypothesis probability =   9.647816e-01

Photon flux (15-150 keV)    in 1 sec: 0.685264 ( -0.199732  0.201052 ) ph/cm2/s
Energy fluence (15-150 keV)             : 5.43488e-08 ( -1.57717e-08  1.62228e-08 ) ergs/cm2
Time-resolved spectra
Distribution
T90 vs. Hardness ratio plot
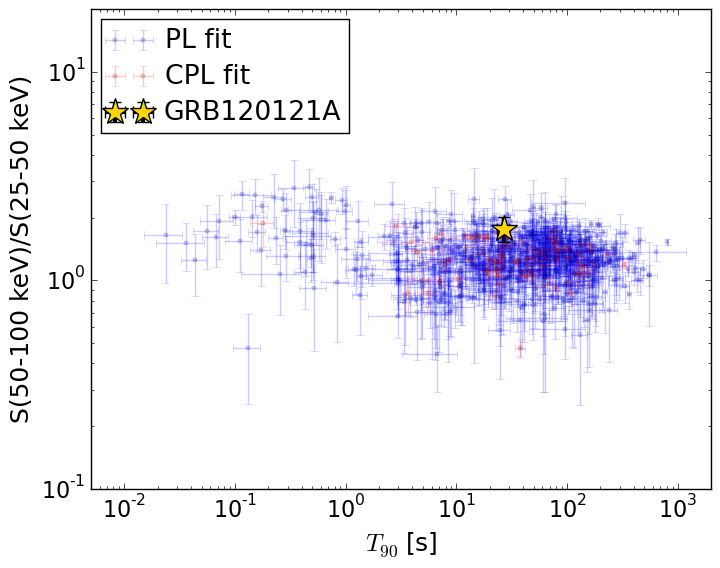
T90                                   = 26.8 sec.
Hardness ratio (energy fluence ratio) = 1.76872455913
S(15-50 keV) vs. S(50-150 keV) plot
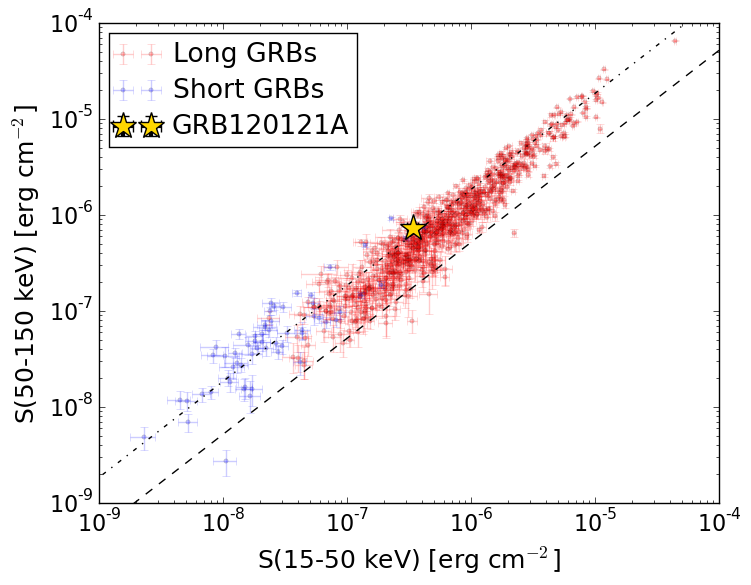
S(15-50 keV)  = 3.3705187e-07
S(50-150 keV) = 7.312438e-07
The dash-dotted line and the dashed line traces the fluences calculated from the Band function with Epeak = 15 and 150 keV, respectively. Both lines assume a canonical values of alpha = -1 and beta = -2.5.
Mask shadow pattern
IMX = 5.830556130485854E-01, IMY = 2.858521460019826E-01
Spacecraft aspect plot
Bright source in the pre-burst/pre-slew/post-slew images
Pre-burst image of 15-350 keV band
Time interval of the image:
-239.072000 -11.004000

# RAcent  DECcent POSerr Theta    Phi  PeakCts   SNR AngSep     Name
#  [deg]    [deg]    ['] [deg]  [deg]                   [']
244.9867 -15.6381    0.4  27.0  -11.9   7.4470  32.2    0.4	Sco X-1
254.4603  35.3411    2.5  27.8  131.5   1.2841   4.6    0.2	Her X-1
255.9904 -37.8301    2.4  45.7  -38.8   2.3248   4.9    0.9	4U 1700-377
256.5503 -36.3908    4.7  44.2  -39.3   1.0615   2.5    5.9	GX 349+2
262.9382 -24.7023   22.5  32.8  -49.0   0.1521   0.5    4.7	GX 1+4
268.4645  -1.4287    3.1  13.6  -89.1   0.8879   3.7    6.0	SW J1753.5-0127
270.2099 -25.0913    2.6  34.9  -60.3   1.5636   4.4    4.1	GX 5-1
270.2510 -25.7017    5.1  35.4  -60.0   0.8255   2.3    3.7	GRS 1758-258
274.0141 -14.0103    2.5  26.7  -76.8   1.3552   4.6    1.6	GX 17+2
275.9459 -30.3935    5.7  41.7  -64.4   1.5321   2.0    1.9	H1820-303
288.7876  10.9523    0.8  30.1 -139.8   3.9421  15.3    0.8	GRS 1915+105
299.5981  35.1200    5.8  46.5 -173.6   0.7975   2.0    4.9	Cyg X-1
308.1301  40.8629   24.8  55.0 -176.7   0.3939   0.5    5.5	Cyg X-3
263.1256 -33.9091    4.1  42.0  -47.3   1.2509   2.8    8.1	GX 354-0
317.6917  29.8915    3.8  59.5 -161.7   4.9696   3.1 ------	UNKNOWN
275.2747 -33.4952    2.8  44.3  -61.7   4.1590   4.1 ------	UNKNOWN
Pre-slew background subtracted image of 15-350 keV band
Time interval of the image:
-11.004000 19.776000

# RAcent  DECcent POSerr Theta    Phi  PeakCts   SNR AngSep     Name
#  [deg]    [deg]    ['] [deg]  [deg]                   [']
244.9427 -15.7267    6.6  27.1  -11.9   0.1298   1.8    5.6	Sco X-1
254.5613  35.2833   25.1  27.7  131.7   0.0428   0.5    6.2	Her X-1
256.0057 -37.7763    3.4  45.7  -38.8   0.5122   3.4    4.2	4U 1700-377
256.4325 -36.4248  113.0  44.3  -39.2   0.0147   0.1    0.2	GX 349+2
263.2006 -24.7025   31.2  32.9  -49.5   0.0349   0.4   10.8	GX 1+4
268.5772  -1.4448    0.0  13.7  -89.4  -0.1156  -1.6   12.6	SW J1753.5-0127
270.3578 -24.9671    5.7  34.8  -60.6  -0.2281  -2.0    7.8	GX 5-1
270.3786 -25.6332   28.8  35.4  -60.2  -0.0478  -0.4    7.8	GRS 1758-258
274.0324 -14.2308    0.0  26.9  -76.6   0.1307   1.5   11.8	GX 17+2
275.7249 -30.4040    5.9  41.7  -64.1   0.4690   1.9   10.6	H1820-303
288.7019  10.8371    9.8  30.0 -139.6   0.1009   1.2    8.6	GRS 1915+105
299.5647  35.3140    4.8  46.6 -173.8  -0.3204  -2.4    6.9	Cyg X-1
308.1788  40.8825    4.5  55.0 -176.7  -0.6535  -2.5    5.2	Cyg X-3
263.0143 -33.8528    5.2  41.9  -47.2  -0.3313  -2.2    1.7	GX 354-0
221.3393  26.2064    2.4  39.7   80.7   1.3009   4.8 ------	UNKNOWN
252.1237  26.6952    2.8  19.8  121.6   0.3024   4.1 ------	UNKNOWN
249.3630 -23.9605    0.6  33.0  -26.1   1.5695  19.0 ------	UNKNOWN
264.0835 -15.5535    2.2  24.0  -54.9   0.4133   5.3 ------	UNKNOWN
317.1054  27.3263    1.9  58.6 -158.8   2.2042   6.0 ------	UNKNOWN
Post-slew image of 15-350 keV band
Time interval of the image:
103.028600 962.961300
1663.928000 1844.138000

# RAcent  DECcent POSerr Theta    Phi  PeakCts   SNR AngSep     Name
#  [deg]    [deg]    ['] [deg]  [deg]                   [']
244.9807 -15.6451    0.3   9.3  146.6  30.7929  45.6    0.3	Sco X-1
255.9700 -37.8446    0.4  15.0  -26.9  18.4065  26.6    0.8	4U 1700-377
256.4377 -36.4333    2.0  13.9  -30.7   4.0109   5.8    0.6	GX 349+2
262.9132 -24.7433    3.9  12.4  -90.0   2.0721   2.9    5.2	GX 1+4
264.5451 -44.3153    0.0  23.8  -34.0  -0.5665  -0.8   11.7	4U 1735-44
268.3178  -1.4396    3.3  29.1 -144.4   2.5646   3.5    3.1	SW J1753.5-0127
270.2349 -25.0929    2.1  19.0  -88.6   4.0297   5.5    2.8	GX 5-1
270.1361 -25.6738  102.3  18.9  -86.8   0.0890   0.1    9.9	GRS 1758-258
273.9810 -14.1512    3.1  25.2 -114.8   3.3794   3.7    7.0	GX 17+2
275.7623 -30.4810    5.7  24.3  -75.0   1.7729   2.0   10.8	H1820-303
285.0113 -25.0527   11.7  32.4  -86.9  -1.2523  -1.0    8.0	HT1900.1-2455
262.8316 -33.9801    8.8  15.4  -52.9   0.9428   1.3   11.7	GX 354-0
257.7068  17.8912    2.7  42.7 -174.5   4.9432   4.3 ------	UNKNOWN
256.8236 -14.8804    3.7  11.5 -147.3   1.9769   3.1 ------	UNKNOWN
269.7219  30.3061    3.7  57.7 -165.5  11.5314   3.2 ------	UNKNOWN