Analysis Summary
Notes:
- 1) No attempt has been made to eliminate the non-significant decimal places.
- 2) This batgrbproduct analysis is done using the HEASARC data.
- 3) This batgrbproduct analysis is using the flight position for the mask-weighting calculation.
======================================================================
BAT GRB EVENT DATA PROCESSING REPORT
Process Script Ver: batgrbproduct v2.46
Process Start Time: Mon Jan 13 06:54:58 EST 2014
Host Name: batevent1
Current Working Dir: /local/data/batevent/batevent_reproc/trigger514586
======================================================================
Trigger: 00514586 Segment: 000
BAT Trigger Time: 350654315.968 [s; MET]
Trigger Stop: 350654324.16 [s; MET]
UTC: 2012-02-11T11:58:28.088540 [includes UTCF correction]
Where From?: TDRSS position message
BAT
RA: 87.751188537819 Dec: -24.7591984547618 [deg; J2000]
Catalogged Source?: NO
Point Source?: YES
GRB Indicated?: YES [ by BAT flight software ]
Image S/N Ratio: 7.93
Image Trigger?: NO
Rate S/N Ratio: 8.24621125123532 [ if not an image trigger ]
Image S/N Ratio: 7.93
Analysis Position: [ source = BAT ]
RA: 87.751188537819 Dec: -24.7591984547618 [deg; J2000]
Refined Position: [ source = BAT pre-slew burst ]
RA: 87.7797455193343 Dec: -24.7911638449394 [deg; J2000]
{ 05h 51m 07.1s , -24d 47' 28.2" }
+/- 2.08983859512222 [arcmin] (estimated 90% radius based on SNR)
+/- 1.16579176176868 [arcmin] (formal 1-sigma fit error)
SNR: 10.6124206961979
Angular difference between the analysis and refined position is 2.469550 arcmin
Partial Coding Fraction: 0.640625 [ including projection effects ]
Duration
T90: 64.3199999928474 +/- 8.83205800550182
Measured from: -0.375999987125397
to: 63.944000005722 [s; relative to TRIGTIME]
T50: 33.0239999890327 +/- 18.4165491049755
Measured from: 8.00800001621246
to: 41.0320000052452 [s; relative to TRIGTIME]
Fluence
Peak Flux (peak 1 second)
Measured from: 41.0120000243187
to: 42.0120000243187 [s; relative to TRIGTIME]
Total Fluence
Measured from: -2.2960000038147
to: 71.688000023365 [s; relative to TRIGTIME]
Band 1 Band 2 Band 3 Band 4
15-25 25-50 50-100 100-350 keV
Total 0.325892 0.428668 0.415169 0.127515
0.055831 0.057817 0.052402 0.050726 [error]
Peak 0.020401 0.010884 0.023897 0.006507
0.006731 0.006769 0.006228 0.006032 [error]
[ fluence units of on-axis counts / fully illuminated detector ]
======================================================================
====== Table of the duration information =============================
Value tstart tstop
T100 73.984 -2.296 71.688
T90 64.320 -0.376 63.944
T50 33.024 8.008 41.032
Peak 1.000 41.012 42.012
====== Spectral Analysis Summary =====================================
Model : spectral model: simple power-law (PL) and cutoff power-law (CPL)
Ph_index : photon index: E^{Ph_index}
Ph_90err : 90% error of the photon index
Epeak : Epeak in keV
Epeak_90err: 90% error of Epeak
Norm : normalization at 50 keV in both the PL model and CPL model
Nomr_90err : 90% error of the normalization
chi2 : Chi-Squared
dof : degree of freedo
=== Time-averaged spectral analysis ===
(Best model with acceptable fit: PL)
Model Ph_index Ph_90err_low Ph_90err_hi Epeak Epeak_90err_low Epeak_90err_hi Norm Nomr_90err_low Norm_90err_hi chi2 dof
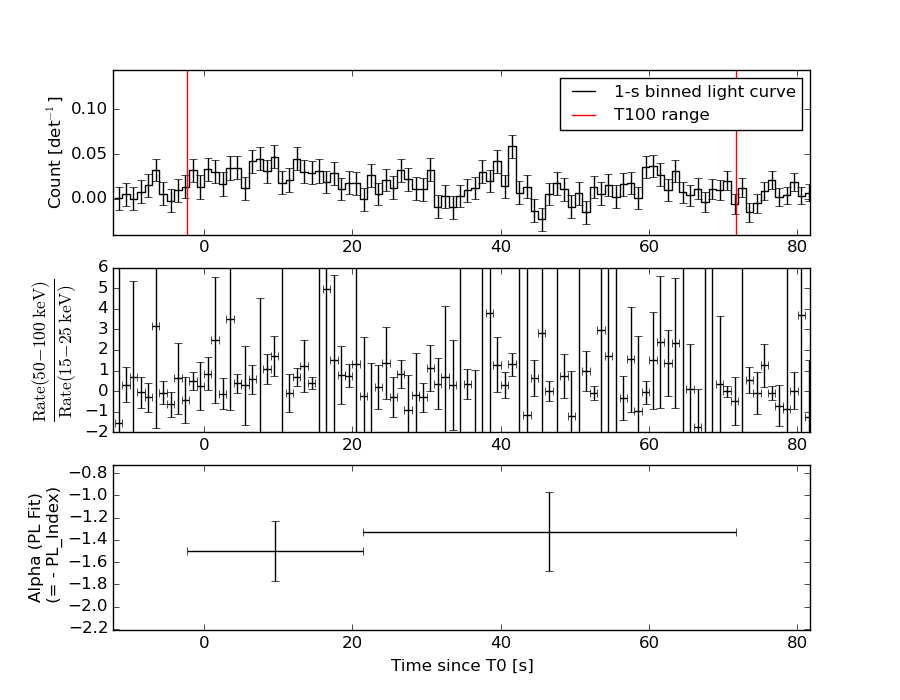
PL -1.413 -0.224 0.223 - - - 1.21e-03 -1.60e-04 1.59e-04 47.930 57
CPL -0.576 -0.921 1.263 84.835 -24.094 -84.835 3.19e-03 -3.19e-03 9.89e-03 45.860 56
=== 1-s peak spectral analysis ===
(Best model with acceptable fit: PL)
Model Ph_index Ph_90err_low Ph_90err_hi Epeak Epeak_90err_low Epeak_90err_hi Norm Nomr_90err_low Norm_90err_hi chi2 dof
PL -1.445 -0.672 0.672 - - - 3.77e-03 -1.42e-03 1.38e-03 56.420 57
CPL -1.108 N/A N/A 129.773 N/A N/A 5.62e-03 N/A N/A 56.410 56
=== Fluence/Peak Flux Summary ===
Model Band1 Band2 Band3 Band4 Band5 Total
15-25 25-50 50-100 100-350 15-150 15-350 keV
Fluence PL 1.05e-07 2.04e-07 3.06e-07 9.96e-07 8.62e-07 1.61e-06 erg/cm2
90%_error_low -2.27e-08 -2.81e-08 -5.19e-08 -3.17e-07 -1.26e-07 -3.64e-07 erg/cm2
90%_error_hi 2.40e-08 2.78e-08 5.16e-08 4.06e-07 1.28e-07 4.38e-07 erg/cm2
Peak flux PL 1.47e-01 1.53e-01 1.12e-01 1.33e-01 4.64e-01 5.46e-01 ph/cm2/s
90%_error_low -8.32e-02 -6.05e-02 -5.22e-02 -9.19e-02 -1.68e-01 -1.99e-01 ph/cm2/s
90%_error_hi 9.82e-02 5.82e-02 5.14e-02 1.76e-01 1.69e-01 2.06e-01 ph/cm2/s
Fluence CPL 9.12e-08 2.21e-07 3.20e-07 3.31e-07 8.06e-07 9.64e-07 erg/cm2
90%_error_low -2.86e-08 -3.48e-08 -5.80e-08 -2.23e-07 -1.40e-07 -2.64e-07 erg/cm2
90%_error_hi 2.91e-08 3.64e-08 5.91e-08 7.77e-07 1.44e-07 4.61e-07 erg/cm2
Peak flux CPL 1.43e-01 1.56e-01 1.14e-01 1.04e-01 4.60e-01 5.17e-01 ph/cm2/s
90%_error_low -5.47e-02 -6.31e-02 -5.36e-02 -1.04e-01 -1.73e-01 -2.20e-01 ph/cm2/s
90%_error_hi 1.02e-01 6.95e-02 5.89e-02 1.18e-01 1.72e-01 2.28e-01 ph/cm2/s
======================================================================
Image
Pre-slew 15.0-350.0 keV image (Event data)
#   RAcent    DECcent   POSerr    Theta     Phi              Peak Cts       SNR   Name
   87.7797   -24.7912   0.0181    32.2416  -141.7938         1.0141090     10.612 TRIG_00514586

Foreground time interval of the image:
 -2.296  50.133 (delta_t =  52.429 [sec])
Background time interval of the image:
-566.567 -546.830 (delta_t =  19.737 [sec])
-239.968  -2.296 (delta_t = 237.672 [sec])
Light Curves
Note: The mask-weighted lightcurves have units of either count/det or counts/sec/det, where a det is 0.4 x 0.4 = 0.16 sq cm.
Full-time range; 1 s binning
Other quick-look light curves:
- 64 ms binning (zoomed)
- 16 ms binning (zoomed)
- 8 ms binning (zoomed)
- 2 ms binning (zoomed)
- SN=5 or 10 s binning (full-time range)
- Raw light curve
Spectra
- 64 ms binning (zoomed)
- 16 ms binning (zoomed)
- 8 ms binning (zoomed)
- 2 ms binning (zoomed)
- SN=5 or 10 s binning (full-time range)
- Raw light curve
Spectra
Notes:
- 1) The fitting includes the systematic errors.
- 2) When the burst includes telescope slew time periods, the fitting uses an average response file made from multiple 5-s response files through out the slew time plus single time preiod for the non-slew times, and weighted by the total counts in the corresponding time period using addrmf. An average response file is needed becuase a spectral fit using the pre-slew DRM will introduce some errors in both a spectral shape and a normalization if the PHA file contains a lot of the slew/post-slew time interval.
- 3) For fits to more complicated models (e.g. a power-law over a cutoff power-law), the BAT team has decided to require a chi-square improvement of more than 6 for each extra dof.
Time averaged spectrum fit using the average DRM
Power-law model
Time interval is from   -2.296 sec. to   71.688 sec.

Spectral model in power-law:
------------------------------------------------------------
Parameters  : value       lower 90%   higher 90%
Photon index: -1.41329     ( -0.224352   0.223277 )
Norm@50keV  : 1.20912E-03    ( -0.000160086   0.000159319 )
------------------------------------------------------------
#Fit statistic : Chi-Squared =          47.93 using 59 PHA bins.
# Reduced chi-squared =         0.8410 for     57 degrees of freedom
# Null hypothesis probability =   7.982454e-01

Photon flux (15-150 keV)    in 73.98 sec: 0.147701 ( -0.019436  0.019468 ) ph/cm2/s
Energy fluence (15-150 keV)             : 8.62133e-07 ( -1.26089e-07  1.27842e-07 ) ergs/cm2
Cutoff power-law model
Time interval is from   -2.296 sec. to   71.688 sec.
Spectral model in the cutoff power-law:
------------------------------------------------------------
Parameters  : value       lower 90%   higher 90%
Photon index: -0.575677     ( -0.921908   1.26289 )
Epeak [keV] : 84.8346      ( -24.0679 -84.8079 )
Norm@50keV  : 3.19071E-03    ( -0.00319325   0.00988342 )
------------------------------------------------------------
#Fit statistic : Chi-Squared =          45.86 using 59 PHA bins.
# Reduced chi-squared =         0.8188 for     56 degrees of freedom
# Null hypothesis probability =   8.313351e-01

Photon flux (15-150 keV)    in 73.98 sec: 0.142127 ( -0.020783  0.020625 ) ph/cm2/s
Energy fluence (15-150 keV)             : 8.0633e-07 ( -1.39655e-07  1.43737e-07 ) ergs/cm2
1-s peak spectrum fit
Power-law model
Time interval is from   41.012 sec. to   42.012 sec.

Spectral model in power-law:
------------------------------------------------------------
Parameters  : value       lower 90%   higher 90%
Photon index: -1.44507     ( -0.672477   0.672446 )
Norm@50keV  : 3.76973E-03    ( -0.00141928   0.0013806 )
------------------------------------------------------------
#Fit statistic : Chi-Squared =          56.42 using 59 PHA bins.
# Reduced chi-squared =         0.9898 for     57 degrees of freedom
# Null hypothesis probability =   4.969213e-01

Photon flux (15-150 keV)    in 1 sec: 0.464012 ( -0.16846  0.169326 ) ph/cm2/s
Energy fluence (15-150 keV)             : 3.6111e-08 ( -1.44833e-08  1.51622e-08 ) ergs/cm2
Cutoff power-law model
Time interval is from   41.012 sec. to   42.012 sec.
Spectral model in the cutoff power-law:
------------------------------------------------------------
Parameters  : value       lower 90%   higher 90%
Photon index: -1.10847     (       )
Epeak [keV] : 129.773      (   )
Norm@50keV  : 5.62007E-03    (     )
------------------------------------------------------------
#Fit statistic : Chi-Squared =          56.41 using 59 PHA bins.
# Reduced chi-squared =          1.007 for     56 degrees of freedom
# Null hypothesis probability =   4.596754e-01

Photon flux (15-150 keV)    in 1 sec: 0.460207 ( -0.173168  0.172059 ) ph/cm2/s
Energy fluence (15-150 keV)             : 3.55189e-08 ( -1.54622e-08  1.55892e-08 ) ergs/cm2
Time-resolved spectra
Distribution
T90 vs. Hardness ratio plot
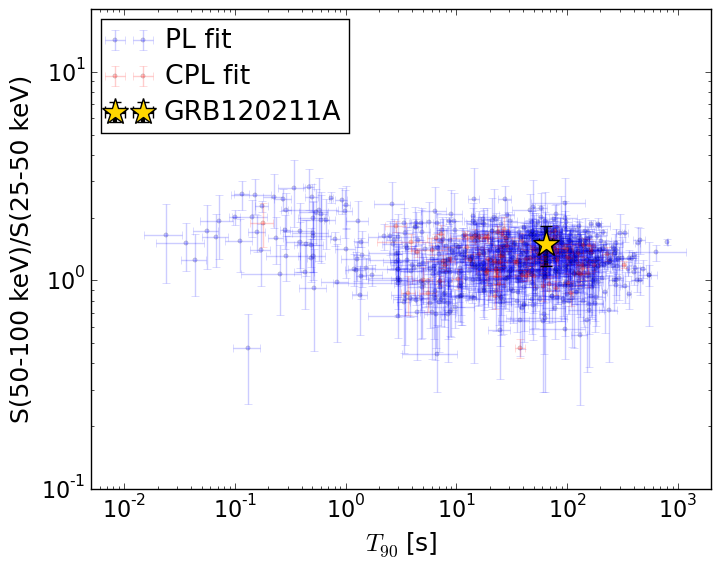
T90                                   = 64.32 sec.
Hardness ratio (energy fluence ratio) = 1.50186205365
S(15-50 keV) vs. S(50-150 keV) plot
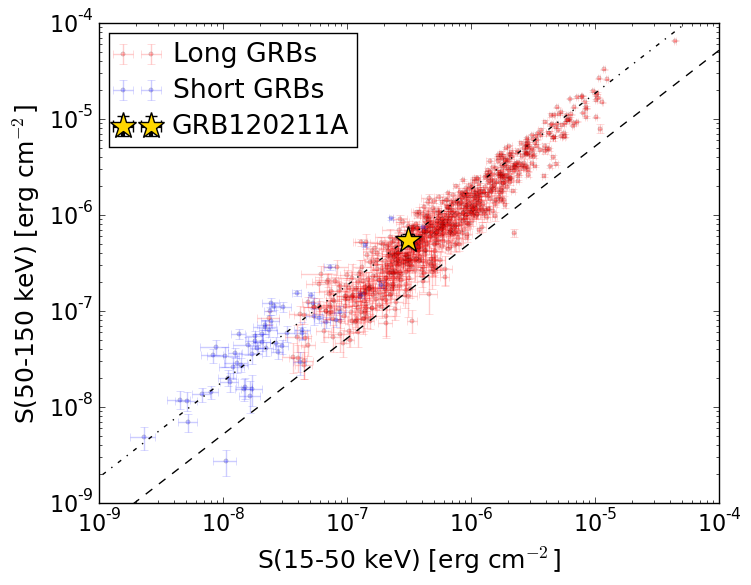
S(15-50 keV)  = 3.093577e-07
S(50-150 keV) = 5.527646e-07
The dash-dotted line and the dashed line traces the fluences calculated from the Band function with Epeak = 15 and 150 keV, respectively. Both lines assume a canonical values of alpha = -1 and beta = -2.5.
Mask shadow pattern
IMX = -4.956360947873087E-01, IMY = 3.901141554868550E-01
Spacecraft aspect plot
Bright source in the pre-burst/pre-slew/post-slew images
Pre-burst image of 15-350 keV band
Time interval of the image:
-566.567360 -546.830400
-239.968000 -2.296000

# RAcent  DECcent POSerr Theta    Phi  PeakCts   SNR AngSep     Name
#  [deg]    [deg]    ['] [deg]  [deg]                   [']
 83.6321  22.0200    0.2  21.5  -19.3  10.4707  53.0    0.3	Crab
109.2785 -41.4897    2.1  48.4 -170.8   2.1773   5.4 ------	UNKNOWN
 70.5319 -34.4407    2.9  48.0 -128.7   3.7622   4.0 ------	UNKNOWN
Pre-slew background subtracted image of 15-350 keV band
Time interval of the image:
-2.296000 50.132600

# RAcent  DECcent POSerr Theta    Phi  PeakCts   SNR AngSep     Name
#  [deg]    [deg]    ['] [deg]  [deg]                   [']
 83.8325  21.9364    0.0  21.3  -19.1  -0.0855  -1.1   12.0	Crab
131.6890 -28.7638    2.3  47.3  159.1   1.0239   5.2 ------	UNKNOWN
 86.5394  45.8503    2.2  41.3    8.0   0.6592   5.3 ------	UNKNOWN
 87.7797 -24.7911    1.1  32.2 -141.8   1.0129  10.6 ------	UNKNOWN
Post-slew image of 15-350 keV band
Time interval of the image:
103.332590 962.101300

# RAcent  DECcent POSerr Theta    Phi  PeakCts   SNR AngSep     Name
#  [deg]    [deg]    ['] [deg]  [deg]                   [']
 83.6322  22.0218    0.5  46.9   23.7  31.1518  22.4    0.4	Crab
135.6637 -40.6668  223.4  42.7  152.9   0.0495   0.1    9.1	Vela X-1
 95.4036  23.2670    2.5  48.6   38.3   9.6699   4.5 ------	UNKNOWN
150.9449 -67.0901    4.2  57.0 -175.6   6.3875   2.7 ------	UNKNOWN
 78.1952 -49.9974    3.1  26.3 -137.1   1.6918   3.7 ------	UNKNOWN
149.4415 -75.3557    3.1  59.1 -166.1  13.0184   3.8 ------	UNKNOWN
 60.1098 -34.6271    3.0  25.9  -90.0   2.0087   3.9 ------	UNKNOWN