Analysis Summary
Notes:
- 1) No attempt has been made to eliminate the non-significant decimal places.
- 2) This batgrbproduct analysis is done using the HEASARC data.
- 3) This batgrbproduct analysis is using the flight position for the mask-weighting calculation.
======================================================================
                  BAT GRB EVENT DATA PROCESSING REPORT
    Process Script Ver: batgrbproduct v2.46
    Process Start Time: Mon Jan 13 06:50:27 EST 2014
             Host Name: batevent1
   Current Working Dir: /local/data/batevent/batevent_reproc/trigger514709
======================================================================

  Trigger: 00514709      Segment: 000

  BAT Trigger Time: 350730690.624   [s; MET]
      Trigger Stop: 350730691.648   [s; MET]
               UTC: 2012-02-12T09:11:22.741460    [includes UTCF correction]
       Where From?: TDRSS position message

  BAT
    RA: 43.1047306460246   Dec: -18.0251590236093  [deg; J2000]

     Catalogged Source?: NO
     Point Source?:      YES
     GRB Indicated?:     YES    [ by BAT flight software ]
     Image S/N Ratio:    9.09
     Image Trigger?:     NO
     Rate S/N Ratio:     11.5325625946708  [ if not an image trigger ]
     Image S/N Ratio:    9.09

  Analysis Position:   [ source = BAT ]
    RA: 43.1047306460246   Dec: -18.0251590236093  [deg; J2000]

  Refined Position:   [ source = BAT pre-slew burst ]
    RA: 43.0865997834577   Dec: -18.0374623581297  [deg; J2000]
        { 02h 52m 20.8s , -18d 02' 14.9" }
         +/- 1.63221183875383 [arcmin] (estimated 90% radius based on SNR)
         +/- 0.728295359400236 [arcmin] (formal 1-sigma fit error)
    SNR: 15.1060847801132

  Angular difference between the analysis and refined position is 1.270816 arcmin

  Partial Coding Fraction: 0.2265625    [ including projection effects ]

  Duration
     T90: 5 +/- 2.23606797749979
        Measured from: -0.624000012874603
                   to: 4.3759999871254     [s; relative to TRIGTIME]
     T50: 2 +/- 1.4142135623731
        Measured from: 0.375999987125397
                   to: 2.3759999871254     [s; relative to TRIGTIME]


  Fluence
     Peak Flux  (peak 1 second)
        Measured from: 0.375999987125397
                   to: 1.3759999871254     [s; relative to TRIGTIME]
     Total Fluence
        Measured from: -0.624000012874603
                   to: 5.3759999871254     [s; relative to TRIGTIME]

             Band 1     Band 2     Band 3     Band 4
              15-25      25-50     50-100    100-350     keV
 Total     0.287611   0.335532   0.175112   0.023053
           0.027735   0.028630   0.024724   0.021113 [error]
 Peak      0.088969   0.061442   0.039922   0.014884
           0.012466   0.012559   0.010492   0.008797 [error]

     [ fluence units of on-axis counts / fully illuminated detector ]

======================================================================


====== Table of the duration information =============================

        Value   tstart    tstop
T100    6.000   -0.624    5.376
T90     5.000   -0.624    4.376
T50     2.000    0.376    2.376
Peak    1.000    0.376    1.376


====== Spectral Analysis Summary =====================================

Model      : spectral model: simple power-law (PL) and cutoff power-law (CPL)
Ph_index   : photon index: E^{Ph_index}
Ph_90err   : 90% error of the photon index
Epeak      : Epeak in keV
Epeak_90err: 90% error of Epeak
Norm       : normalization at 50 keV in both the PL model and CPL model
Nomr_90err : 90% error of the normalization
chi2       : Chi-Squared
dof        : degree of freedo

=== Time-averaged spectral analysis ===
(Best model with acceptable fit: PL)

Model Ph_index Ph_90err_low Ph_90err_hi  Epeak  Epeak_90err_low  Epeak_90err_hi  Norm       Nomr_90err_low    Norm_90err_hi    chi2    dof
PL      -2.058    -0.196      0.186       -           -               -         8.56e-03     -1.09e-03          1.07e-03      59.810   57
CPL     -1.744    -0.333      0.748       35.463      N/A           N/A         1.29e-02        N/A               N/A         59.130   56


=== 1-s peak spectral analysis ===
(Best model with acceptable fit: PL)

Model Ph_index Ph_90err_low Ph_90err_hi  Epeak  Epeak_90err_low  Epeak_90err_hi  Norm       Nomr_90err_low    Norm_90err_hi    chi2    dof
PL      -2.161     -0.395     0.348       -           -               -         1.16e-02     -2.95e-03          2.75e-03      63.900   57
CPL     -1.992      N/A       N/A           4.254      N/A           N/A         1.35e-02        N/A               N/A         64.340   56


=== Fluence/Peak Flux Summary ===

              Model    Band1     Band2     Band3     Band4     Band5     Total
                       15-25     25-50    50-100    100-350    15-150    15-350    keV
Fluence         PL   1.11e-07  1.45e-07  1.40e-07  2.39e-07  4.75e-07  6.35e-07   erg/cm2
      90%_error_low -1.58e-08 -1.46e-08 -2.40e-08 -7.27e-08 -5.54e-08 -1.02e-07   erg/cm2
      90%_error_hi   1.62e-08  1.46e-08  2.44e-08  9.07e-08  5.62e-08  1.15e-07   erg/cm2
Peak flux       PL   9.08e-01  6.20e-01  2.77e-01  1.72e-01  1.89e+00  1.98e+00   ph/cm2/s
      90%_error_low -2.29e-01 -1.11e-01 -8.99e-02 -8.76e-02 -3.37e-01 -3.52e-01   ph/cm2/s
      90%_error_hi   2.37e-01  1.11e-01  9.09e-02  1.27e-01  3.37e-01  3.52e-01   ph/cm2/s

Fluence        CPL    N/A      N/A      N/A      N/A      N/A      N/A      erg/cm2
      90%_error_low -1.58e-08 -1.46e-08 -2.40e-08 -7.27e-08 -5.54e-08 -1.02e-07   erg/cm2
      90%_error_hi   1.62e-08  1.46e-08  2.44e-08  9.07e-08  5.62e-08  1.15e-07   erg/cm2
Peak flux      CPL   8.82e-01  4.70e-01  1.60e-01  8.48e-02  1.56e+00  1.62e+00   ph/cm2/s
      90%_error_low -2.51e-01 -2.42e-01     N/A       N/A   -5.71e-01     N/A     ph/cm2/s
      90%_error_hi   2.50e-01  2.43e-01     N/A       N/A    3.32e-01     N/A     ph/cm2/s

======================================================================
Image
Pre-slew 15.0-350.0 keV image (Event data)
#   RAcent    DECcent   POSerr    Theta     Phi              Peak Cts       SNR   Name
   43.0866   -18.0375   0.0128    41.9362   -51.7517         0.8557065     15.106 TRIG_00514709

Foreground time interval of the image:
 -0.624   5.376 (delta_t =   6.000 [sec])
Background time interval of the image:
-239.624  -0.624 (delta_t = 239.000 [sec])
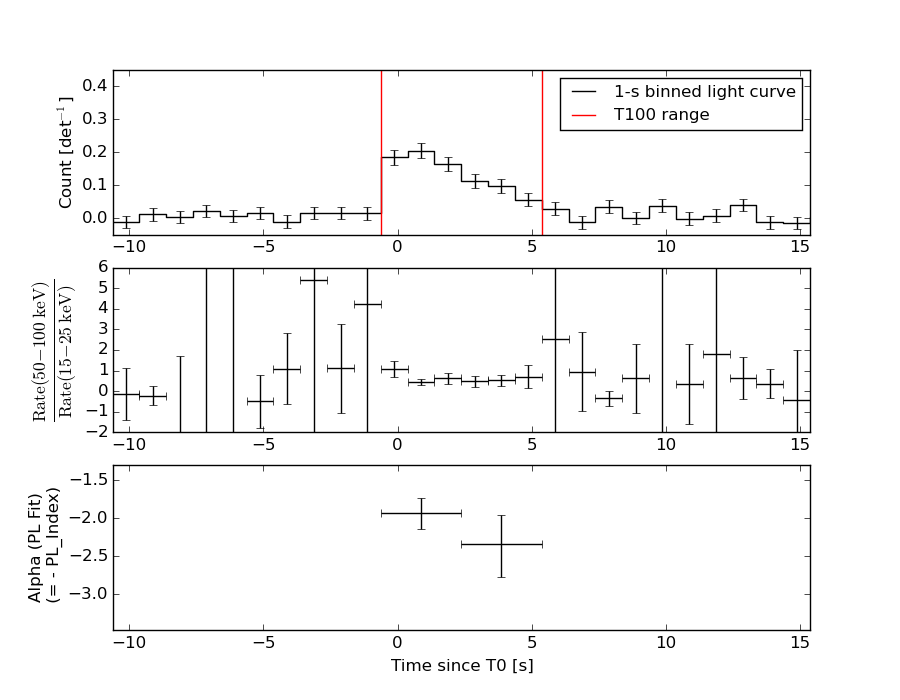
Light Curves
Note: The mask-weighted lightcurves have units of either count/det or counts/sec/det, where a det is 0.4 x 0.4 = 0.16 sq cm.
Full-time range; 1 s binning
Other quick-look light curves:
- 64 ms binning (zoomed)
- 16 ms binning (zoomed)
- 8 ms binning (zoomed)
- 2 ms binning (zoomed)
- SN=5 or 10 s binning (full-time range)
- Raw light curve
Spectra
- 64 ms binning (zoomed)
- 16 ms binning (zoomed)
- 8 ms binning (zoomed)
- 2 ms binning (zoomed)
- SN=5 or 10 s binning (full-time range)
- Raw light curve
Spectra
Notes:
- 1) The fitting includes the systematic errors.
- 2) When the burst includes telescope slew time periods, the fitting uses an average response file made from multiple 5-s response files through out the slew time plus single time preiod for the non-slew times, and weighted by the total counts in the corresponding time period using addrmf. An average response file is needed becuase a spectral fit using the pre-slew DRM will introduce some errors in both a spectral shape and a normalization if the PHA file contains a lot of the slew/post-slew time interval.
- 3) For fits to more complicated models (e.g. a power-law over a cutoff power-law), the BAT team has decided to require a chi-square improvement of more than 6 for each extra dof.
Time averaged spectrum fit using the average DRM
Power-law model
Time interval is from   -0.624 sec. to    5.376 sec.

Spectral model in power-law:
------------------------------------------------------------
Parameters  : value       lower 90%   higher 90%
Photon index: -2.05843     ( -0.196191   0.185551 )
Norm@50keV  : 8.55670E-03    ( -0.00109215   0.00106551 )
------------------------------------------------------------
#Fit statistic : Chi-Squared =          59.81 using 59 PHA bins.
# Reduced chi-squared =          1.049 for     57 degrees of freedom
# Null hypothesis probability =   3.741906e-01

Photon flux (15-150 keV)    in 6 sec: 1.31934 ( -0.13328  0.13336 ) ph/cm2/s
Energy fluence (15-150 keV)             : 4.75358e-07 ( -5.54048e-08  5.62126e-08 ) ergs/cm2
Cutoff power-law model
Time interval is from   -0.624 sec. to    5.376 sec.
Spectral model in the cutoff power-law:
------------------------------------------------------------
Parameters  : value       lower 90%   higher 90%
Photon index: -1.74436     ( -0.33347   0.747699 )
Epeak [keV] : 35.4634      (   )
Norm@50keV  : 1.28630E-02    (     )
------------------------------------------------------------
#Fit statistic : Chi-Squared =          59.13 using 59 PHA bins.
# Reduced chi-squared =          1.056 for     56 degrees of freedom
# Null hypothesis probability =   3.618799e-01

Photon flux (15-150 keV)    in 6 sec: 1.30413 ( -0.13685  0.13686 ) ph/cm2/s
Energy fluence (15-150 keV)             : 0 ( 0  0 ) ergs/cm2
1-s peak spectrum fit
Power-law model
Time interval is from    0.376 sec. to    1.376 sec.

Spectral model in power-law:
------------------------------------------------------------
Parameters  : value       lower 90%   higher 90%
Photon index: -2.16148     ( -0.395192   0.34769 )
Norm@50keV  : 1.16438E-02    ( -0.0029481   0.00275475 )
------------------------------------------------------------
#Fit statistic : Chi-Squared =          63.90 using 59 PHA bins.
# Reduced chi-squared =          1.121 for     57 degrees of freedom
# Null hypothesis probability =   2.471560e-01

Photon flux (15-150 keV)    in 1 sec: 1.88965 ( -0.33729  0.33737 ) ph/cm2/s
Energy fluence (15-150 keV)             : 1.08941e-07 ( -2.31879e-08  2.36793e-08 ) ergs/cm2
Cutoff power-law model
Time interval is from    0.376 sec. to    1.376 sec.
Spectral model in the cutoff power-law:
------------------------------------------------------------
Parameters  : value       lower 90%   higher 90%
Photon index: -1.9918     (       )
Epeak [keV] : 4.25379      (   )
Norm@50keV  : 1.34544E-02    (     )
------------------------------------------------------------
#Fit statistic : Chi-Squared =          64.34 using 59 PHA bins.
# Reduced chi-squared =          1.149 for     56 degrees of freedom
# Null hypothesis probability =   2.078088e-01

Photon flux (15-150 keV)    in 1 sec: 1.55502 ( -0.57148  0.33172 ) ph/cm2/s
Energy fluence (15-150 keV)             : 0 ( 0  0 ) ergs/cm2
Time-resolved spectra
Distribution
T90 vs. Hardness ratio plot
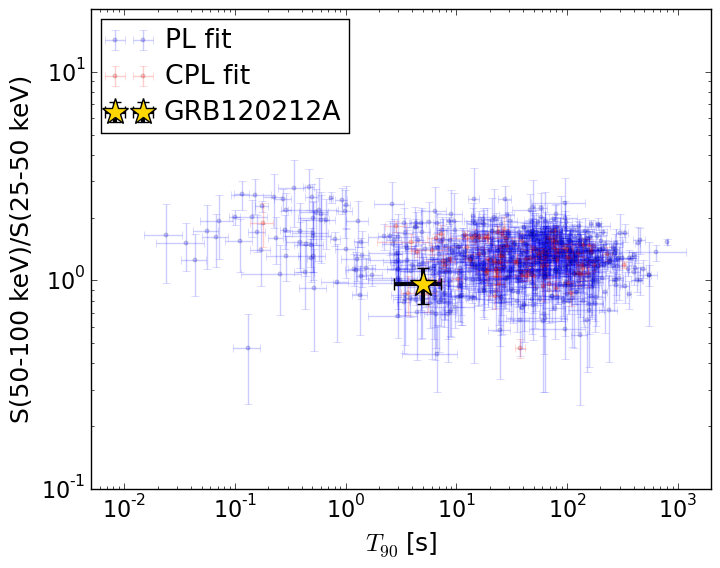
T90                                   = 5.0 sec.
Hardness ratio (energy fluence ratio) = 0.960350396957
S(15-50 keV) vs. S(50-150 keV) plot
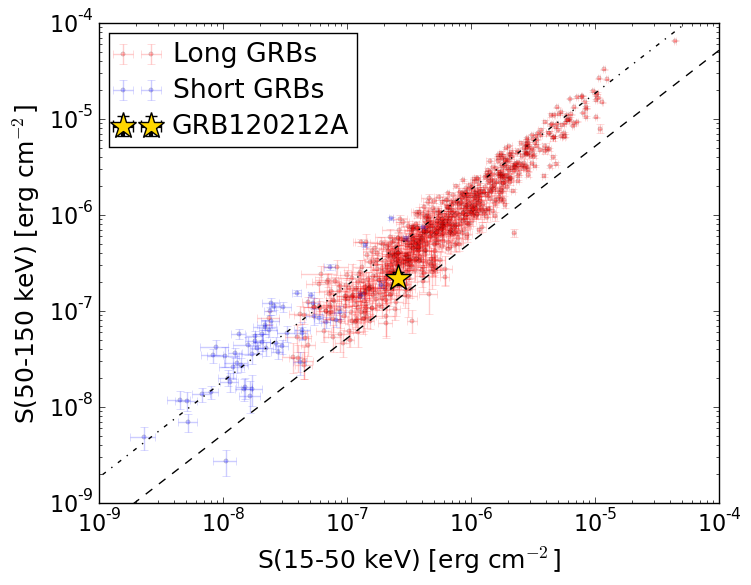
S(15-50 keV)  = 2.565225e-07
S(50-150 keV) = 2.1883514e-07
The dash-dotted line and the dashed line traces the fluences calculated from the Band function with Epeak = 15 and 150 keV, respectively. Both lines assume a canonical values of alpha = -1 and beta = -2.5.
Mask shadow pattern
IMX = 5.561663115064384E-01, IMY = 7.055375896096804E-01
Spacecraft aspect plot
Bright source in the pre-burst/pre-slew/post-slew images
Pre-burst image of 15-350 keV band
Time interval of the image:
-239.624000 -0.624000

# RAcent  DECcent POSerr Theta    Phi  PeakCts   SNR AngSep     Name
#  [deg]    [deg]    ['] [deg]  [deg]                   [']
 83.6238  22.0150    0.7  47.0   32.8   9.2586  15.7    0.5	Crab
135.5920 -40.5060    4.0  42.7  161.8   0.9470   2.8    4.1	Vela X-1
 37.5518 -17.5279    4.3  47.1  -53.3   2.3436   2.7 ------	UNKNOWN
Pre-slew background subtracted image of 15-350 keV band
Time interval of the image:
-0.624000 5.376000

# RAcent  DECcent POSerr Theta    Phi  PeakCts   SNR AngSep     Name
#  [deg]    [deg]    ['] [deg]  [deg]                   [']
 83.5996  22.0435    4.9  47.0   32.8  -0.1999  -2.4    2.6	Crab
135.6608 -40.5232    7.9  42.7  161.8  -0.0645  -1.4    6.3	Vela X-1
 91.5109  12.6077    2.4  37.6   44.1   0.2256   4.8 ------	UNKNOWN
109.7717 -57.1091    2.0  36.0 -162.2   0.1595   5.8 ------	UNKNOWN
113.9830 -60.1399    2.6  39.8 -162.1   0.1422   4.4 ------	UNKNOWN
 43.0866 -18.0375    0.8  41.9  -51.8   0.8556  15.1 ------	UNKNOWN
Post-slew image of 15-350 keV band
Time interval of the image:
434.776600 962.447800

# RAcent  DECcent POSerr Theta    Phi  PeakCts   SNR AngSep     Name
#  [deg]    [deg]    ['] [deg]  [deg]                   [']
135.5325 -40.5665    0.6   3.1   85.6   5.2384  18.8    0.7	Vela X-1
170.2550 -60.5825    2.1  27.2 -147.2   1.7037   5.5    3.0	Cen X-3
186.6587 -62.7780    1.0  35.3 -147.1   5.2008  12.0    0.5	GX 301-2
144.5297 -12.4849    2.6  32.2   90.1   2.8865   4.4 ------	UNKNOWN
169.8582 -27.8891    2.6  32.3  144.4   2.0253   4.4 ------	UNKNOWN
193.1097 -46.6013    2.4  40.5 -172.9   1.9876   4.7 ------	UNKNOWN
214.4876 -45.8638    2.4  54.4 -165.9   4.7834   4.8 ------	UNKNOWN
227.4502 -66.7576    3.2  51.8 -138.5   5.8848   3.6 ------	UNKNOWN
213.7648 -80.7339    2.9  45.4 -121.2   5.1383   4.0 ------	UNKNOWN