Analysis Summary
Notes:
- 1) No attempt has been made to eliminate the non-significant decimal places.
- 2) This batgrbproduct analysis is done using the HEASARC data.
- 3) This batgrbproduct analysis is using the flight position for the mask-weighting calculation.
======================================================================
                  BAT GRB EVENT DATA PROCESSING REPORT
    Process Script Ver: batgrbproduct v2.46
    Process Start Time: Mon Jan 13 06:40:22 EST 2014
             Host Name: batevent1
   Current Working Dir: /local/data/batevent/batevent_reproc/trigger515015
======================================================================

  Trigger: 00515015      Segment: 000

  BAT Trigger Time: 350959283.2   [s; MET]
      Trigger Stop: 350959287.296   [s; MET]
               UTC: 2012-02-15T00:41:15.308260    [includes UTCF correction]
       Where From?: TDRSS position message

  BAT
    RA: 30.0323071653144   Dec: 8.79177878164953  [deg; J2000]

     Catalogged Source?: NO
     Point Source?:      YES
     GRB Indicated?:     YES    [ by BAT flight software ]
     Image S/N Ratio:    8.68
     Image Trigger?:     NO
     Rate S/N Ratio:     12.8062484748657  [ if not an image trigger ]
     Image S/N Ratio:    8.68

  Analysis Position:   [ source = BAT ]
    RA: 30.0323071653144   Dec: 8.79177878164953  [deg; J2000]

  Refined Position:   [ source = BAT pre-slew burst ]
    RA: 30.0530280079406   Dec: 8.80195054428953  [deg; J2000]
        { 02h 00m 12.7s , +08d 48' 07.0" }
         +/- 1.78962062589511 [arcmin] (estimated 90% radius based on SNR)
         +/- 1.04380251779661 [arcmin] (formal 1-sigma fit error)
    SNR: 13.2443689584423

  Angular difference between the analysis and refined position is 1.371858 arcmin

  Partial Coding Fraction: 0.84375    [ including projection effects ]

  Duration
     T90: 7.92399996519089 +/- 1.19836059316863
        Measured from: 0.364000022411346
                   to: 8.28799998760223     [s; relative to TRIGTIME]
     T50: 2.98799991607666 +/- 1.24086746531098
        Measured from: 2.04000002145767
                   to: 5.02799993753433     [s; relative to TRIGTIME]


  Fluence
     Peak Flux  (peak 1 second)
        Measured from: 1.75599998235703
                   to: 2.75599998235703     [s; relative to TRIGTIME]
     Total Fluence
        Measured from: -1.19199997186661
                   to: 8.78400003910065     [s; relative to TRIGTIME]

             Band 1     Band 2     Band 3     Band 4
              15-25      25-50     50-100    100-350     keV
 Total     0.131800   0.174669   0.106805   0.028537
           0.016737   0.017312   0.015335   0.013047 [error]
 Peak      0.012389   0.030076   0.021575   0.005184
           0.005355   0.005616   0.004917   0.004139 [error]

     [ fluence units of on-axis counts / fully illuminated detector ]

======================================================================


====== Table of the duration information =============================

        Value   tstart    tstop
T100    9.976   -1.192    8.784
T90     7.924    0.364    8.288
T50     2.988    2.040    5.028
Peak    1.000    1.756    2.756


====== Spectral Analysis Summary =====================================

Model      : spectral model: simple power-law (PL) and cutoff power-law (CPL)
Ph_index   : photon index: E^{Ph_index}
Ph_90err   : 90% error of the photon index
Epeak      : Epeak in keV
Epeak_90err: 90% error of Epeak
Norm       : normalization at 50 keV in both the PL model and CPL model
Nomr_90err : 90% error of the normalization
chi2       : Chi-Squared
dof        : degree of freedo

=== Time-averaged spectral analysis ===
(Best model with acceptable fit: PL)

Model Ph_index Ph_90err_low Ph_90err_hi  Epeak  Epeak_90err_low  Epeak_90err_hi  Norm       Nomr_90err_low    Norm_90err_hi    chi2    dof
PL      -1.684    -0.208      0.202       -           -               -         2.76e-03     -3.56e-04          3.50e-04      56.610   57
CPL     -1.259    -0.418      0.963       78.582     -25.829       -78.582      4.73e-03     -1.51e-03          1.13e-02      55.800   56


=== 1-s peak spectral analysis ===
(Best model with acceptable fit: PL)

Model Ph_index Ph_90err_low Ph_90err_hi  Epeak  Epeak_90err_low  Epeak_90err_hi  Norm       Nomr_90err_low    Norm_90err_hi    chi2    dof
PL      -1.341     -0.374     0.379       -           -               -         4.85e-03     -1.06e-03          1.06e-03      52.010   57
CPL     -0.671     -1.690     2.451      101.424    -101.424      -101.424      1.04e-02     -6.51e-03          1.65e-01      51.490   56


=== Fluence/Peak Flux Summary ===

              Model    Band1     Band2     Band3     Band4     Band5     Total
                       15-25     25-50    50-100    100-350    15-150    15-350    keV
Fluence         PL   4.18e-08  6.87e-08  8.54e-08  2.11e-07  2.55e-07  4.07e-07   erg/cm2
      90%_error_low -7.32e-09 -7.96e-09 -1.47e-08 -6.58e-08 -3.44e-08 -8.13e-08   erg/cm2
      90%_error_hi   7.58e-09  7.95e-09  1.47e-08  8.33e-08  3.50e-08  9.53e-08   erg/cm2
Peak flux       PL   1.71e-01  1.90e-01  1.50e-01  1.95e-01  5.83e-01  7.06e-01   ph/cm2/s
      90%_error_low -6.37e-02 -4.72e-02 -3.94e-02 -8.81e-02 -1.31e-01 -1.57e-01   ph/cm2/s
      90%_error_hi   7.14e-02  4.60e-02  3.86e-02  1.24e-01  1.31e-01  1.60e-01   ph/cm2/s

Fluence        CPL   3.99e-08  7.24e-08  8.58e-08  1.03e-07  2.45e-07  3.02e-07   erg/cm2
      90%_error_low -8.29e-09 -1.01e-08 -1.61e-08 -7.40e-08 -3.97e-08 -8.58e-08   erg/cm2
      90%_error_hi   8.36e-09  1.10e-08  1.58e-08  1.29e-07  4.01e-08  1.40e-07   erg/cm2
Peak flux      CPL   1.51e-01  2.01e-01  1.59e-01  9.76e-02  5.68e-01  6.08e-01   ph/cm2/s
      90%_error_low -7.75e-02 -5.40e-02 -4.44e-02 -9.76e-02 -1.38e-01 -1.71e-01   ph/cm2/s
      90%_error_hi   8.44e-02  5.98e-02  4.68e-02  1.31e-01  1.36e-01  1.90e-01   ph/cm2/s

======================================================================
Image
Pre-slew 15.0-350.0 keV image (Event data)
#   RAcent    DECcent   POSerr    Theta     Phi              Peak Cts       SNR   Name
   30.0530     8.8020   0.0145    29.7040    -8.5363         0.4331100     13.244 TRIG_00515015

Foreground time interval of the image:
 -1.192   8.784 (delta_t =   9.976 [sec])
Background time interval of the image:
-239.200  -1.192 (delta_t = 238.008 [sec])
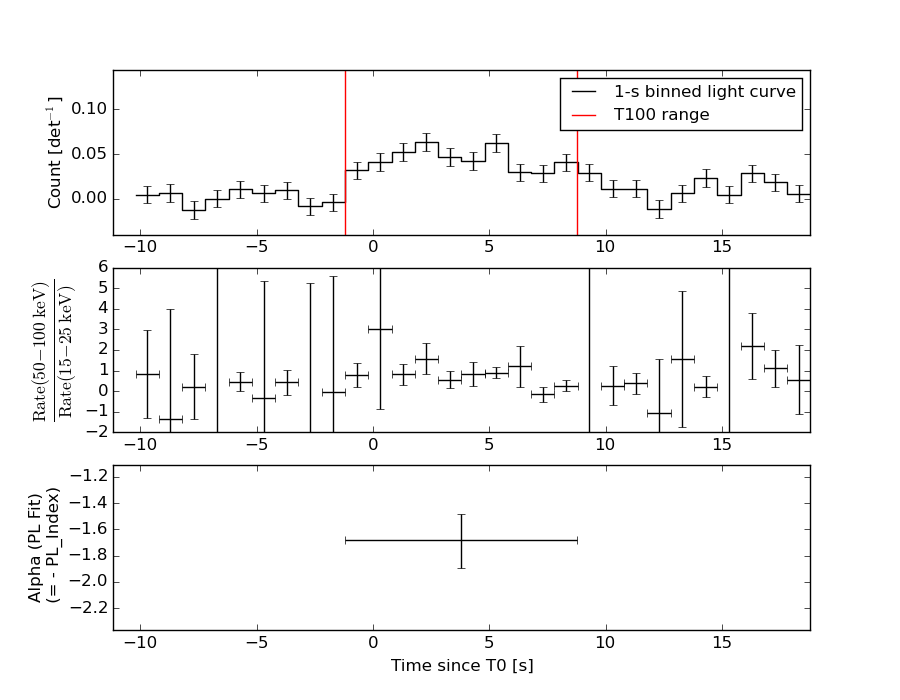
Light Curves
Note: The mask-weighted lightcurves have units of either count/det or counts/sec/det, where a det is 0.4 x 0.4 = 0.16 sq cm.
Full-time range; 1 s binning
Other quick-look light curves:
- 64 ms binning (zoomed)
- 16 ms binning (zoomed)
- 8 ms binning (zoomed)
- 2 ms binning (zoomed)
- SN=5 or 10 s binning (full-time range)
- Raw light curve
Spectra
- 64 ms binning (zoomed)
- 16 ms binning (zoomed)
- 8 ms binning (zoomed)
- 2 ms binning (zoomed)
- SN=5 or 10 s binning (full-time range)
- Raw light curve
Spectra
Notes:
- 1) The fitting includes the systematic errors.
- 2) When the burst includes telescope slew time periods, the fitting uses an average response file made from multiple 5-s response files through out the slew time plus single time preiod for the non-slew times, and weighted by the total counts in the corresponding time period using addrmf. An average response file is needed becuase a spectral fit using the pre-slew DRM will introduce some errors in both a spectral shape and a normalization if the PHA file contains a lot of the slew/post-slew time interval.
- 3) For fits to more complicated models (e.g. a power-law over a cutoff power-law), the BAT team has decided to require a chi-square improvement of more than 6 for each extra dof.
Time averaged spectrum fit using the average DRM
Power-law model
Time interval is from   -1.192 sec. to    8.784 sec.

Spectral model in power-law:
------------------------------------------------------------
Parameters  : value       lower 90%   higher 90%
Photon index: -1.68432     ( -0.207994   0.201608 )
Norm@50keV  : 2.75969E-03    ( -0.000355949   0.00034995 )
------------------------------------------------------------
#Fit statistic : Chi-Squared =          56.61 using 59 PHA bins.
# Reduced chi-squared =         0.9931 for     57 degrees of freedom
# Null hypothesis probability =   4.897692e-01

Photon flux (15-150 keV)    in 9.976 sec: 0.364548 ( -0.042324  0.042347 ) ph/cm2/s
Energy fluence (15-150 keV)             : 2.55268e-07 ( -3.44489e-08  3.50184e-08 ) ergs/cm2
Cutoff power-law model
Time interval is from   -1.192 sec. to    8.784 sec.
Spectral model in the cutoff power-law:
------------------------------------------------------------
Parameters  : value       lower 90%   higher 90%
Photon index: -1.2594     ( -0.418152   0.963008 )
Epeak [keV] : 78.5818      ( -25.829 -78.5818 )
Norm@50keV  : 4.73009E-03    ( -0.00151363   0.0112848 )
------------------------------------------------------------
#Fit statistic : Chi-Squared =          55.80 using 59 PHA bins.
# Reduced chi-squared =         0.9965 for     56 degrees of freedom
# Null hypothesis probability =   4.823374e-01

Photon flux (15-150 keV)    in 9.976 sec: 0.358670 ( -0.043899  0.043767 ) ph/cm2/s
Energy fluence (15-150 keV)             : 2.4469e-07 ( -3.97174e-08  4.00614e-08 ) ergs/cm2
1-s peak spectrum fit
Power-law model
Time interval is from    1.756 sec. to    2.756 sec.

Spectral model in power-law:
------------------------------------------------------------
Parameters  : value       lower 90%   higher 90%
Photon index: -1.34144     ( -0.374368   0.37889 )
Norm@50keV  : 4.85008E-03    ( -0.00106375   0.00106163 )
------------------------------------------------------------
#Fit statistic : Chi-Squared =          52.01 using 59 PHA bins.
# Reduced chi-squared =         0.9125 for     57 degrees of freedom
# Null hypothesis probability =   6.621958e-01

Photon flux (15-150 keV)    in 1 sec: 0.583283 ( -0.130735  0.131274 ) ph/cm2/s
Energy fluence (15-150 keV)             : 4.74668e-08 ( -1.13599e-08  1.15275e-08 ) ergs/cm2
Cutoff power-law model
Time interval is from    1.756 sec. to    2.756 sec.
Spectral model in the cutoff power-law:
------------------------------------------------------------
Parameters  : value       lower 90%   higher 90%
Photon index: -0.670975     ( -1.6908   2.45065 )
Epeak [keV] : 101.424      ( -101.389 -101.389 )
Norm@50keV  : 1.04344E-02    ( -0.0065192   0.165045 )
------------------------------------------------------------
#Fit statistic : Chi-Squared =          51.49 using 59 PHA bins.
# Reduced chi-squared =         0.9195 for     56 degrees of freedom
# Null hypothesis probability =   6.459983e-01

Photon flux (15-150 keV)    in 1 sec: 0.567874 ( -0.137798  0.136309 ) ph/cm2/s
Energy fluence (15-150 keV)             : 4.52814e-08 ( -1.30306e-08  1.26268e-08 ) ergs/cm2
Time-resolved spectra
Distribution
T90 vs. Hardness ratio plot
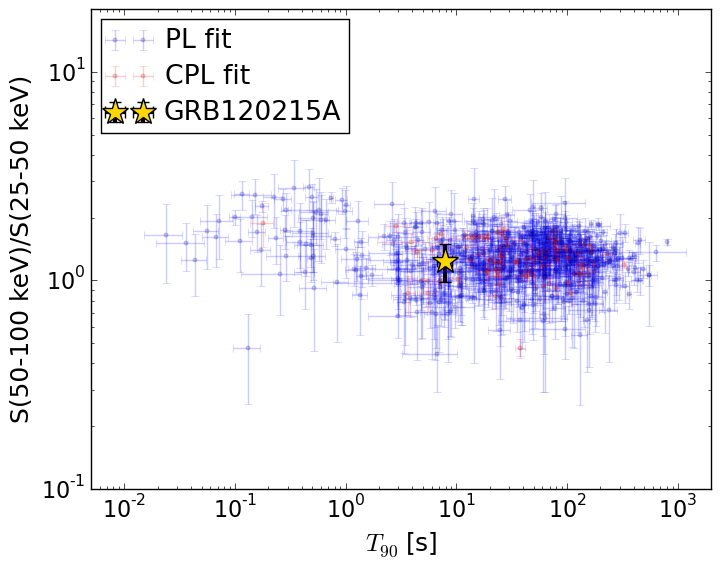
T90                                   = 7.924 sec.
Hardness ratio (energy fluence ratio) = 1.24462931529
S(15-50 keV) vs. S(50-150 keV) plot
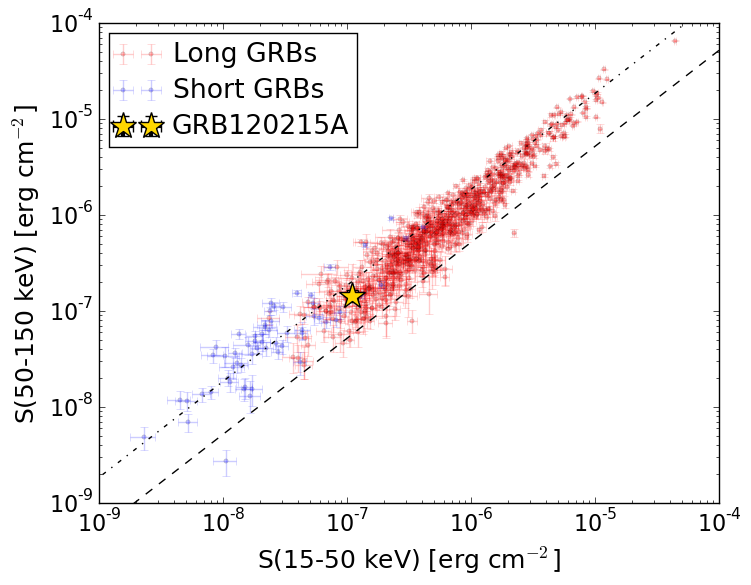
S(15-50 keV)  = 1.1045383e-07
S(50-150 keV) = 1.4481215e-07
The dash-dotted line and the dashed line traces the fluences calculated from the Band function with Epeak = 15 and 150 keV, respectively. Both lines assume a canonical values of alpha = -1 and beta = -2.5.
Mask shadow pattern
IMX = 5.641625483784699E-01, IMY = 8.468029804374197E-02
Spacecraft aspect plot
Bright source in the pre-burst/pre-slew/post-slew images
Pre-burst image of 15-350 keV band
Time interval of the image:
-239.200000 -1.192000

# RAcent  DECcent POSerr Theta    Phi  PeakCts   SNR AngSep     Name
#  [deg]    [deg]    ['] [deg]  [deg]                   [']
 77.2567 -42.8201    2.1  38.1  156.1   1.4439   5.4 ------	UNKNOWN
 40.0347 -37.7344    3.0  19.9 -155.0   0.6271   3.8 ------	UNKNOWN
  1.3527  17.7448    3.6  54.4  -33.1   2.8369   3.2 ------	UNKNOWN
Pre-slew background subtracted image of 15-350 keV band
Time interval of the image:
-1.192000 8.784000

# RAcent  DECcent POSerr Theta    Phi  PeakCts   SNR AngSep     Name
#  [deg]    [deg]    ['] [deg]  [deg]                   [']
 30.0530   8.8020    0.9  29.7   -8.5   0.4330  13.2 ------	UNKNOWN
 10.5226 -71.1119    2.5  56.5 -149.9   0.7013   4.6 ------	UNKNOWN
  1.8899 -57.6429    2.9  49.9 -134.5   0.5777   4.0 ------	UNKNOWN
359.1968   9.9013    2.5  51.5  -42.6   0.6725   4.7  596.0	UNKNOWN
359.2801   5.8682    2.2  49.3  -47.0   0.6886   5.2  354.7	UNKNOWN
359.2219 -13.0547    2.4  42.4  -71.7   0.5772   4.7 ------	UNKNOWN
Post-slew image of 15-350 keV band
Time interval of the image:
90.900600 962.830000

# RAcent  DECcent POSerr Theta    Phi  PeakCts   SNR AngSep     Name
#  [deg]    [deg]    ['] [deg]  [deg]                   [']
359.1029  30.6586    2.6  36.2  -29.6   2.3732   4.4 ------	UNKNOWN
  9.8202 -41.0556    3.0  53.2 -142.1  10.1446   3.9 ------	UNKNOWN
  2.4213 -31.1894    2.5  47.9 -128.9   8.9654   4.5 ------	UNKNOWN