Analysis Summary
Notes:
- 1) No attempt has been made to eliminate the non-significant decimal places.
- 2) This batgrbproduct analysis is done using the HEASARC data.
- 3) This batgrbproduct analysis is using the flight position for the mask-weighting calculation.
======================================================================
                  BAT GRB EVENT DATA PROCESSING REPORT
    Process Script Ver: batgrbproduct v2.46
    Process Start Time: Mon Jan 13 06:28:12 EST 2014
             Host Name: batevent1
   Current Working Dir: /local/data/batevent/batevent_reproc/trigger515375
======================================================================

  Trigger: 00515375      Segment: 000

  BAT Trigger Time: 351354616   [s; MET]
      Trigger Stop: 351354680   [s; MET]
               UTC: 2012-02-19T14:30:08.092340    [includes UTCF correction]
       Where From?: TDRSS position message

  BAT
    RA: 129.792968291079   Dec: 51.0246599454996  [deg; J2000]

     Catalogged Source?: NO
     Point Source?:      YES
     GRB Indicated?:     YES    [ by BAT flight software ]
     Image S/N Ratio:    8.92
     Image Trigger?:     YES
     Rate S/N Ratio:     0  [ if not an image trigger ]
     Image S/N Ratio:    8.92

  Analysis Position:   [ source = BAT ]
    RA: 129.792968291079   Dec: 51.0246599454996  [deg; J2000]

  Refined Position:   [ source = BAT pre-slew burst ]
    RA: 129.843235607354   Dec: 51.0154664710579  [deg; J2000]
        { 08h 39m 22.4s , +51d 00' 55.7" }
         +/- 2.12731942031514 [arcmin] (estimated 90% radius based on SNR)
         +/- 1.09657339834554 [arcmin] (formal 1-sigma fit error)
    SNR: 10.3463209065604

  Angular difference between the analysis and refined position is 1.975796 arcmin

  Partial Coding Fraction: 0.7734375    [ including projection effects ]

  Duration
     T90: 92.5279999375343 +/- 10.9226570392907
        Measured from: -8.73600000143051
                   to: 83.7919999361038     [s; relative to TRIGTIME]
     T50: 61.3719999790192 +/- 10.5487432507463
        Measured from: 0.279999971389771
                   to: 61.6519999504089     [s; relative to TRIGTIME]


  Fluence
     Peak Flux  (peak 1 second)
        Measured from: -2.2960000038147
                   to: -1.2960000038147     [s; relative to TRIGTIME]
     Total Fluence
        Measured from: -11.3640000224113
                   to: 86.8240000009537     [s; relative to TRIGTIME]

             Band 1     Band 2     Band 3     Band 4
              15-25      25-50     50-100    100-350     keV
 Total     0.329122   0.510367   0.240020   0.114542
           0.051406   0.053038   0.047322   0.042140 [error]
 Peak      0.007589   0.016182   0.013503   0.007804
           0.005262   0.005531   0.004793   0.004297 [error]

     [ fluence units of on-axis counts / fully illuminated detector ]

======================================================================


====== Table of the duration information =============================

        Value   tstart    tstop
T100   98.188  -11.364   86.824
T90    92.528   -8.736   83.792
T50    61.372    0.280   61.652
Peak    1.000   -2.296   -1.296


====== Spectral Analysis Summary =====================================

Model      : spectral model: simple power-law (PL) and cutoff power-law (CPL)
Ph_index   : photon index: E^{Ph_index}
Ph_90err   : 90% error of the photon index
Epeak      : Epeak in keV
Epeak_90err: 90% error of Epeak
Norm       : normalization at 50 keV in both the PL model and CPL model
Nomr_90err : 90% error of the normalization
chi2       : Chi-Squared
dof        : degree of freedo

=== Time-averaged spectral analysis ===
(Best model with acceptable fit: PL)

Model Ph_index Ph_90err_low Ph_90err_hi  Epeak  Epeak_90err_low  Epeak_90err_hi  Norm       Nomr_90err_low    Norm_90err_hi    chi2    dof
PL      -1.544    -0.224      0.219       -           -               -         7.38e-04     -1.07e-04          1.06e-04      67.310   57
CPL      0.389    -1.264      1.940       53.526      -9.698        24.659      8.80e-03     -8.80e-03          9.90e-02      59.490   56


=== 1-s peak spectral analysis ===
(Best model with acceptable fit: N/A)

Model Ph_index Ph_90err_low Ph_90err_hi  Epeak  Epeak_90err_low  Epeak_90err_hi  Norm       Nomr_90err_low    Norm_90err_hi    chi2    dof
PL      -1.379     -0.652     0.644       -           -               -         2.59e-03     -1.04e-03          1.03e-03      44.280   57
CPL      1.205     -2.691    -1.205       58.951     -19.523      9675.439      5.22e-02     -5.22e-02          3.15e+03      41.970   56


=== Fluence/Peak Flux Summary ===

              Model    Band1     Band2     Band3     Band4     Band5     Total
                       15-25     25-50    50-100    100-350    15-150    15-350    keV
Fluence         PL   9.65e-08  1.73e-07  2.37e-07  6.73e-07  6.83e-07  1.18e-06   erg/cm2
      90%_error_low -1.94e-08 -2.36e-08 -4.43e-08 -2.24e-07 -1.07e-07 -2.72e-07   erg/cm2
      90%_error_hi   2.02e-08  2.36e-08  4.46e-08  2.90e-07  1.09e-07  3.26e-07   erg/cm2
Peak flux       PL   9.48e-02  1.03e-01  7.88e-02  9.91e-02  3.14e-01  3.75e-01   ph/cm2/s
      90%_error_low -5.45e-02 -4.37e-02 -3.75e-02 -9.91e-02 -1.25e-01 -1.51e-01   ph/cm2/s
      90%_error_hi   6.51e-02  4.29e-02  3.75e-02  1.24e-01  1.25e-01  1.57e-01   ph/cm2/s

Fluence        CPL   7.84e-08  2.14e-07  2.22e-07  6.04e-08  5.65e-07  5.75e-07   erg/cm2
      90%_error_low -2.38e-08 -3.55e-08 -6.56e-08    N/A    -1.09e-07 -1.18e-07   erg/cm2
      90%_error_hi   2.39e-08  3.77e-08  5.88e-08    N/A     1.26e-07  2.09e-07   erg/cm2
Peak flux      CPL   4.46e-02  1.36e-01  8.44e-02  4.77e-03  2.70e-01  2.70e-01   ph/cm2/s
      90%_error_low -4.46e-02 -6.28e-02 -8.44e-02 -4.77e-03 -1.19e-01 -1.19e-01   ph/cm2/s
      90%_error_hi   8.28e-02  6.95e-02  5.27e-02  1.08e-01  1.35e-01  1.42e-01   ph/cm2/s

======================================================================
Image
Pre-slew 15.0-350.0 keV image (Event data)
#   RAcent    DECcent   POSerr    Theta     Phi              Peak Cts       SNR   Name
  129.8432    51.0155   0.0185    20.2317   130.8611         1.1069480     10.346 TRIG_00515375

Foreground time interval of the image:
-11.364  72.701 (delta_t =  84.065 [sec])
Background time interval of the image:
-721.599 -650.480 (delta_t =  71.119 [sec])
-239.000 -11.364 (delta_t = 227.636 [sec])
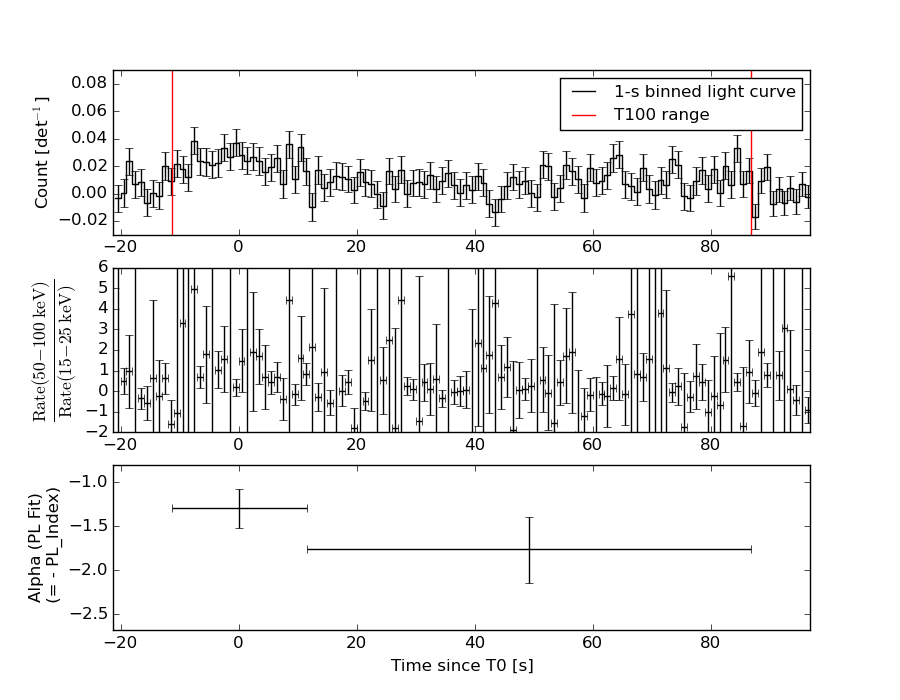
Light Curves
Note: The mask-weighted lightcurves have units of either count/det or counts/sec/det, where a det is 0.4 x 0.4 = 0.16 sq cm.
Full-time range; 1 s binning
Other quick-look light curves:
- 64 ms binning (zoomed)
- 16 ms binning (zoomed)
- 8 ms binning (zoomed)
- 2 ms binning (zoomed)
- SN=5 or 10 s binning (full-time range)
- Raw light curve
Spectra
- 64 ms binning (zoomed)
- 16 ms binning (zoomed)
- 8 ms binning (zoomed)
- 2 ms binning (zoomed)
- SN=5 or 10 s binning (full-time range)
- Raw light curve
Spectra
Notes:
- 1) The fitting includes the systematic errors.
- 2) When the burst includes telescope slew time periods, the fitting uses an average response file made from multiple 5-s response files through out the slew time plus single time preiod for the non-slew times, and weighted by the total counts in the corresponding time period using addrmf. An average response file is needed becuase a spectral fit using the pre-slew DRM will introduce some errors in both a spectral shape and a normalization if the PHA file contains a lot of the slew/post-slew time interval.
- 3) For fits to more complicated models (e.g. a power-law over a cutoff power-law), the BAT team has decided to require a chi-square improvement of more than 6 for each extra dof.
Time averaged spectrum fit using the average DRM
Power-law model
Time interval is from  -11.364 sec. to   86.824 sec.

Spectral model in power-law:
------------------------------------------------------------
Parameters  : value       lower 90%   higher 90%
Photon index: -1.54387     ( -0.223385   0.219553 )
Norm@50keV  : 7.38466E-04    ( -0.000107211   0.000106108 )
------------------------------------------------------------
#Fit statistic : Chi-Squared =          67.31 using 59 PHA bins.
# Reduced chi-squared =          1.181 for     57 degrees of freedom
# Null hypothesis probability =   1.648802e-01

Photon flux (15-150 keV)    in 98.19 sec: 9.33237E-02 ( -0.0126509  0.0126563 ) ph/cm2/s
Energy fluence (15-150 keV)             : 6.83278e-07 ( -1.0698e-07  1.09237e-07 ) ergs/cm2
Cutoff power-law model
Time interval is from  -11.364 sec. to   86.824 sec.
Spectral model in the cutoff power-law:
------------------------------------------------------------
Parameters  : value       lower 90%   higher 90%
Photon index: 0.388512     ( -1.28711   1.91681 )
Epeak [keV] : 53.5264      ( -9.45579 24.9013 )
Norm@50keV  : 8.79744E-03    ( -0.00925593   0.0985568 )
------------------------------------------------------------
#Fit statistic : Chi-Squared =          59.49 using 59 PHA bins.
# Reduced chi-squared =          1.062 for     56 degrees of freedom
# Null hypothesis probability =   3.498405e-01

Photon flux (15-150 keV)    in 98.19 sec: 8.68828E-02 ( -0.0132516  0.0132982 ) ph/cm2/s
Energy fluence (15-150 keV)             : 5.6466e-07 ( -1.08636e-07  1.26037e-07 ) ergs/cm2
1-s peak spectrum fit
Power-law model
Time interval is from   -2.296 sec. to   -1.296 sec.

Spectral model in power-law:
------------------------------------------------------------
Parameters  : value       lower 90%   higher 90%
Photon index: -1.37881     ( -0.650963   0.644405 )
Norm@50keV  : 2.58654E-03    ( -0.0010438   0.00103323 )
------------------------------------------------------------
#Fit statistic : Chi-Squared =          44.28 using 59 PHA bins.
# Reduced chi-squared =         0.7769 for     57 degrees of freedom
# Null hypothesis probability =   8.905372e-01

Photon flux (15-150 keV)    in 1 sec: 0.313532 ( -0.124603  0.125255 ) ph/cm2/s
Energy fluence (15-150 keV)             : 2.51021e-08 ( -1.07878e-08  1.12752e-08 ) ergs/cm2
Cutoff power-law model
Time interval is from   -2.296 sec. to   -1.296 sec.
Spectral model in the cutoff power-law:
------------------------------------------------------------
Parameters  : value       lower 90%   higher 90%
Photon index: 3.33013     ( -5.49   -4.00392 )
Epeak [keV] : 52.6669      ( -12.2332 9682.73 )
Norm@50keV  : 0.676028    ( -0.64939   3152.08 )
------------------------------------------------------------
#Fit statistic : Chi-Squared =          41.61 using 59 PHA bins.
# Reduced chi-squared =         0.7430 for     56 degrees of freedom
# Null hypothesis probability =   9.241289e-01

Photon flux (15-150 keV)    in 1 sec: 0.269911 ( -0.119308  0.134608 ) ph/cm2/s
Energy fluence (15-150 keV)             : 1.9215e-08 ( -8.89713e-09  1.23627e-08 ) ergs/cm2
Time-resolved spectra
Distribution
T90 vs. Hardness ratio plot
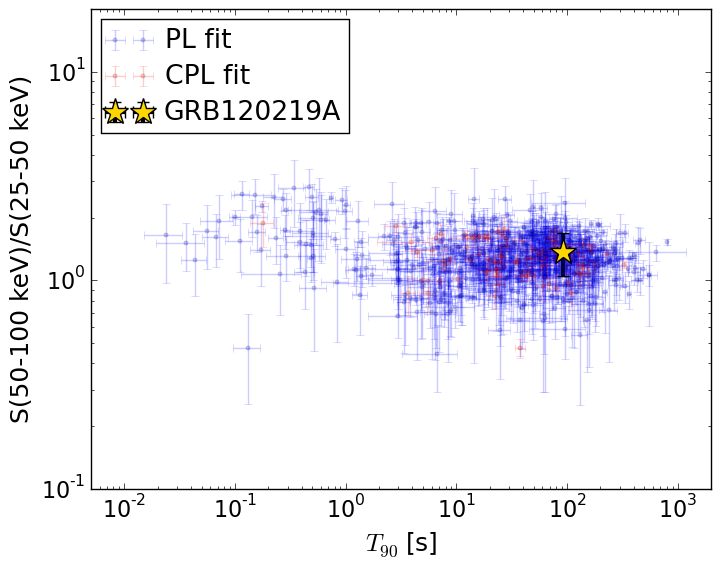
T90                                   = 92.528 sec.
Hardness ratio (energy fluence ratio) = 1.3717660514
S(15-50 keV) vs. S(50-150 keV) plot
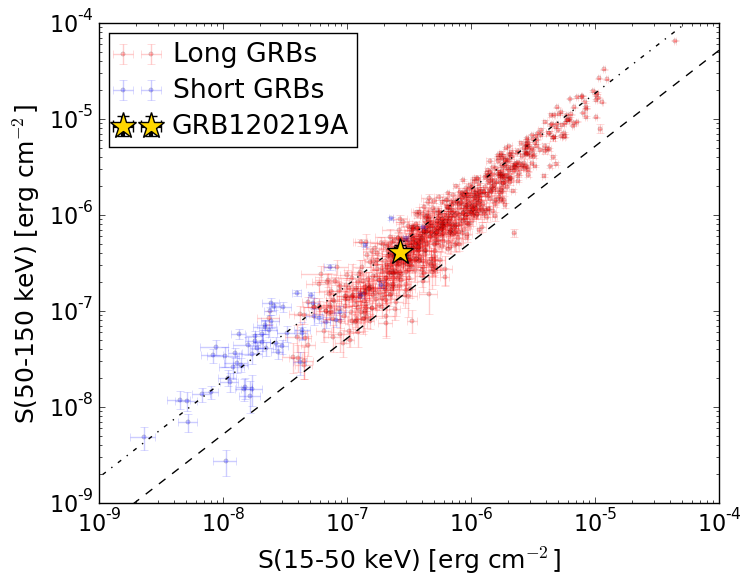
S(15-50 keV)  = 2.6908748e-07
S(50-150 keV) = 4.14199e-07
The dash-dotted line and the dashed line traces the fluences calculated from the Band function with Epeak = 15 and 150 keV, respectively. Both lines assume a canonical values of alpha = -1 and beta = -2.5.
Mask shadow pattern
IMX = -2.411198009835102E-01, IMY = -2.787382714111378E-01
Spacecraft aspect plot
Bright source in the pre-burst/pre-slew/post-slew images
Pre-burst image of 15-350 keV band
Time interval of the image:
-721.599400 -650.480000
-239.000000 -11.364000

# RAcent  DECcent POSerr Theta    Phi  PeakCts   SNR AngSep     Name
#  [deg]    [deg]    ['] [deg]  [deg]                   [']
 76.5501  28.8829    3.6  57.0  179.1   3.5221   3.2 ------	UNKNOWN
228.8250  31.9482    3.2  56.8    0.8   3.4623   3.5 ------	UNKNOWN
 98.4326  57.0835    2.3  24.9 -178.9   0.9262   5.0 ------	UNKNOWN
250.8581  53.4276    2.8  45.0  -30.4   1.4527   4.1 ------	UNKNOWN
Pre-slew background subtracted image of 15-350 keV band
Time interval of the image:
-11.364000 72.700600

# RAcent  DECcent POSerr Theta    Phi  PeakCts   SNR AngSep     Name
#  [deg]    [deg]    ['] [deg]  [deg]                   [']
189.2078  27.2642    2.5  47.9   43.5   1.9629   4.5 ------	UNKNOWN
112.0930  32.4382    2.5  42.1  143.3   1.0407   4.6 ------	UNKNOWN
129.8432  51.0155    1.1  20.2  130.9   1.1070  10.3 ------	UNKNOWN
 80.6721  35.7357    1.9  49.3  178.7   1.2664   6.2 ------	UNKNOWN
Post-slew image of 15-350 keV band
Time interval of the image:
116.900600 628.300600

# RAcent  DECcent POSerr Theta    Phi  PeakCts   SNR AngSep     Name
#  [deg]    [deg]    ['] [deg]  [deg]                   [']
 83.6139  22.0168    0.4  46.0 -168.3  18.2018  31.0    1.1	Crab
104.2183   2.3103    2.8  53.3  155.8   6.5802   4.1 ------	UNKNOWN
117.2764  23.0045    2.7  29.7  147.0   1.7135   4.2 ------	UNKNOWN
223.8587  49.9020    3.8  55.5   -5.6   2.8176   3.0 ------	UNKNOWN
 84.7749  18.9502    2.4  47.7 -172.0   2.9025   4.8 ------	UNKNOWN
 56.0742  53.0839    2.7  43.3 -114.0   6.7535   4.3 ------	UNKNOWN
 48.9130  67.4575    3.9  40.8  -92.1   4.4689   3.0 ------	UNKNOWN
 58.7986  41.5446    2.7  48.0 -129.0   5.6309   4.2 ------	UNKNOWN