Analysis Summary
Notes:
- 1) No attempt has been made to eliminate the non-significant decimal places.
- 2) This batgrbproduct analysis is done using the HEASARC data.
- 3) This batgrbproduct analysis is using the flight position for the mask-weighting calculation.
======================================================================
                  BAT GRB EVENT DATA PROCESSING REPORT
    Process Script Ver: batgrbproduct v2.46
    Process Start Time: Mon Jan 13 06:22:08 EST 2014
             Host Name: batevent1
   Current Working Dir: /local/data/batevent/batevent_reproc/trigger515976
======================================================================

  Trigger: 00515976      Segment: 000

  BAT Trigger Time: 351751204.416   [s; MET]
      Trigger Stop: 351751208.512   [s; MET]
               UTC: 2012-02-24T04:39:56.492380    [includes UTCF correction]
       Where From?: TDRSS position message

  BAT
    RA: 40.9754640993993   Dec: -17.7926294691115  [deg; J2000]

     Catalogged Source?: NO
     Point Source?:      YES
     GRB Indicated?:     YES    [ by BAT flight software ]
     Image S/N Ratio:    7.8
     Image Trigger?:     NO
     Rate S/N Ratio:     9.8488578017961  [ if not an image trigger ]
     Image S/N Ratio:    7.8

  Analysis Position:   [ source = BAT ]
    RA: 40.9754640993993   Dec: -17.7926294691115  [deg; J2000]

  Refined Position:   [ source = BAT pre-slew burst ]
    RA: 40.9352492353547   Dec: -17.7805838114318  [deg; J2000]
        { 02h 43m 44.5s , -17d 46' 50.1" }
         +/- 2.36674659485247 [arcmin] (estimated 90% radius based on SNR)
         +/- 1.09760698224247 [arcmin] (formal 1-sigma fit error)
    SNR: 8.88414962720802

  Angular difference between the analysis and refined position is 2.408552 arcmin

  Partial Coding Fraction: 0.296875    [ including projection effects ]

  Duration
     T90: 7 +/- 2.23606797749979
        Measured from: -1.41600000858307
                   to: 5.58399999141693     [s; relative to TRIGTIME]
     T50: 4 +/- 1
        Measured from: -0.416000008583069
                   to: 3.58399999141693     [s; relative to TRIGTIME]


  Fluence
     Peak Flux  (peak 1 second)
        Measured from: -0.416000008583069
                   to: 0.583999991416931     [s; relative to TRIGTIME]
     Total Fluence
        Measured from: -1.41600000858307
                   to: 6.58399999141693     [s; relative to TRIGTIME]

             Band 1     Band 2     Band 3     Band 4
              15-25      25-50     50-100    100-350     keV
 Total     0.171260   0.184099   0.052321   0.032755
           0.026116   0.026961   0.023974   0.022327 [error]
 Peak      0.032861   0.039973   0.011694   0.009748
           0.009204   0.009491   0.008499   0.007739 [error]

     [ fluence units of on-axis counts / fully illuminated detector ]

======================================================================


====== Table of the duration information =============================

        Value   tstart    tstop
T100    8.000   -1.416    6.584
T90     7.000   -1.416    5.584
T50     4.000   -0.416    3.584
Peak    1.000   -0.416    0.584


====== Spectral Analysis Summary =====================================

Model      : spectral model: simple power-law (PL) and cutoff power-law (CPL)
Ph_index   : photon index: E^{Ph_index}
Ph_90err   : 90% error of the photon index
Epeak      : Epeak in keV
Epeak_90err: 90% error of Epeak
Norm       : normalization at 50 keV in both the PL model and CPL model
Nomr_90err : 90% error of the normalization
chi2       : Chi-Squared
dof        : degree of freedo

=== Time-averaged spectral analysis ===
(Best model with acceptable fit: PL)

Model Ph_index Ph_90err_low Ph_90err_hi  Epeak  Epeak_90err_low  Epeak_90err_hi  Norm       Nomr_90err_low    Norm_90err_hi    chi2    dof
PL      -2.341    -0.415      0.356       -           -               -         2.81e-03     -8.12e-04          7.88e-04      45.140   57
CPL     -1.955     N/A        N/A           4.437      N/A           N/A         4.87e-03        N/A               N/A         44.990   56


=== 1-s peak spectral analysis ===
(Best model with acceptable fit: N/A)

Model Ph_index Ph_90err_low Ph_90err_hi  Epeak  Epeak_90err_low  Epeak_90err_hi  Norm       Nomr_90err_low    Norm_90err_hi    chi2    dof
PL      -2.459     -0.847     0.578       -           -               -         4.43e-03     -4.43e-03          2.17e-03      55.680   57
CPL     -1.853      N/A       N/A          10.463      N/A           N/A         9.88e-03        N/A               N/A         55.620   56


=== Fluence/Peak Flux Summary ===

              Model    Band1     Band2     Band3     Band4     Band5     Total
                       15-25     25-50    50-100    100-350    15-150    15-350    keV
Fluence         PL   6.36e-08  7.03e-08  5.55e-08  7.24e-08  2.16e-07  2.62e-07   erg/cm2
      90%_error_low -1.38e-08 -1.41e-08 -2.06e-08 -4.10e-08 -4.83e-08 -7.34e-08   erg/cm2
      90%_error_hi   1.40e-08  1.36e-08  2.27e-08  6.70e-08  5.10e-08  9.34e-08   erg/cm2
Peak flux       PL   4.62e-01  2.66e-01  9.66e-02  4.64e-02  8.49e-01  8.71e-01   ph/cm2/s
      90%_error_low -1.59e-01 -9.31e-02 -5.99e-02 -4.64e-02 -2.40e-01 -2.50e-01   ph/cm2/s
      90%_error_hi   1.67e-01  8.39e-02  6.76e-02  7.77e-02  2.40e-01  2.52e-01   ph/cm2/s

Fluence        CPL    N/A      N/A      N/A      N/A      N/A      N/A      erg/cm2
      90%_error_low -1.38e-08 -1.41e-08 -2.06e-08 -4.10e-08 -4.83e-08 -7.34e-08   erg/cm2
      90%_error_hi   1.40e-08  1.36e-08  2.27e-08  6.70e-08  5.10e-08  9.34e-08   erg/cm2
Peak flux      CPL     N/A      N/A      N/A      N/A      N/A      N/A     ph/cm2/s
      90%_error_low -1.59e-01 -9.31e-02 -5.99e-02 -4.64e-02 -2.40e-01 -2.50e-01   ph/cm2/s
      90%_error_hi   1.67e-01  8.39e-02  6.76e-02  7.77e-02  2.40e-01  2.52e-01   ph/cm2/s

======================================================================
Image
Pre-slew 15.0-350.0 keV image (Event data)

#   RAcent    DECcent   POSerr    Theta     Phi              Peak Cts       SNR   Name
   40.9352   -17.7806   0.0216    35.5738  -113.5179         0.4945639      8.884 TRIG_00515976

Foreground time interval of the image:
 -1.416   6.584 (delta_t =   8.000 [sec])
Background time interval of the image:
-515.215 -496.569 (delta_t =  18.646 [sec])
-239.416  -1.416 (delta_t = 238.000 [sec])
Light Curves
Note: The mask-weighted lightcurves have units of either count/det or counts/sec/det, where a det is 0.4 x 0.4 = 0.16 sq cm.
Full-time range; 1 s binning
Other quick-look light curves:
- 64 ms binning (zoomed)
- 16 ms binning (zoomed)
- 8 ms binning (zoomed)
- 2 ms binning (zoomed)
- SN=5 or 10 s binning (full-time range)
- Raw light curve
Spectra
- 64 ms binning (zoomed)
- 16 ms binning (zoomed)
- 8 ms binning (zoomed)
- 2 ms binning (zoomed)
- SN=5 or 10 s binning (full-time range)
- Raw light curve
Spectra
Notes:
- 1) The fitting includes the systematic errors.
- 2) When the burst includes telescope slew time periods, the fitting uses an average response file made from multiple 5-s response files through out the slew time plus single time preiod for the non-slew times, and weighted by the total counts in the corresponding time period using addrmf. An average response file is needed becuase a spectral fit using the pre-slew DRM will introduce some errors in both a spectral shape and a normalization if the PHA file contains a lot of the slew/post-slew time interval.
- 3) For fits to more complicated models (e.g. a power-law over a cutoff power-law), the BAT team has decided to require a chi-square improvement of more than 6 for each extra dof.
Time averaged spectrum fit using the average DRM
Power-law model
Time interval is from   -1.416 sec. to    6.584 sec.

Spectral model in power-law:
------------------------------------------------------------
Parameters  : value       lower 90%   higher 90%
Photon index: -2.34101     ( -0.41549   0.355647 )
Norm@50keV  : 2.80748E-03    ( -0.000812369   0.000788379 )
------------------------------------------------------------
#Fit statistic : Chi-Squared =          45.14 using 59 PHA bins.
# Reduced chi-squared =         0.7919 for     57 degrees of freedom
# Null hypothesis probability =   8.718559e-01

Photon flux (15-150 keV)    in 8 sec: 0.502142 ( -0.087172  0.08718 ) ph/cm2/s
Energy fluence (15-150 keV)             : 2.16382e-07 ( -4.82885e-08  5.09744e-08 ) ergs/cm2
Cutoff power-law model
Time interval is from   -1.416 sec. to    6.584 sec.
Spectral model in the cutoff power-law:
------------------------------------------------------------
Parameters  : value       lower 90%   higher 90%
Photon index: -1.95458     (       )
Epeak [keV] : 4.43745      (   )
Norm@50keV  : 4.86667E-03    (     )
------------------------------------------------------------
#Fit statistic : Chi-Squared =          44.99 using 59 PHA bins.
# Reduced chi-squared =         0.8033 for     56 degrees of freedom
# Null hypothesis probability =   8.540077e-01

Photon flux (15-150 keV)    in 8 sec: 0.496925 ( -0.088234  0.086884 ) ph/cm2/s
Energy fluence (15-150 keV)             : 0 ( 0  0 ) ergs/cm2
1-s peak spectrum fit
Power-law model
Time interval is from   -0.416 sec. to    0.584 sec.

Spectral model in power-law:
------------------------------------------------------------
Parameters  : value       lower 90%   higher 90%
Photon index: -2.45904     ( -0.847412   0.578123 )
Norm@50keV  : 4.43184E-03    ( -0.00443184   0.00217024 )
------------------------------------------------------------
#Fit statistic : Chi-Squared =          55.68 using 59 PHA bins.
# Reduced chi-squared =         0.9769 for     57 degrees of freedom
# Null hypothesis probability =   5.245289e-01

Photon flux (15-150 keV)    in 1 sec: 0.849352 ( -0.239915  0.240138 ) ph/cm2/s
Energy fluence (15-150 keV)             : 4.38571e-08 ( -1.60856e-08  1.73949e-08 ) ergs/cm2
Cutoff power-law model
Time interval is from   -0.416 sec. to    0.584 sec.
Spectral model in the cutoff power-law:
------------------------------------------------------------
Parameters  : value       lower 90%   higher 90%
Photon index: -1.85349     (       )
Epeak [keV] : 10.4631      (   )
Norm@50keV  : 9.88012E-03    (     )
------------------------------------------------------------
#Fit statistic : Chi-Squared =          55.62 using 59 PHA bins.
# Reduced chi-squared =         0.9933 for     56 degrees of freedom
# Null hypothesis probability =   4.890036e-01

Photon flux (15-150 keV)    in 1 sec:  (    ) ph/cm2/s
Energy fluence (15-150 keV)             : 0 ( 0  0 ) ergs/cm2
Time-resolved spectra
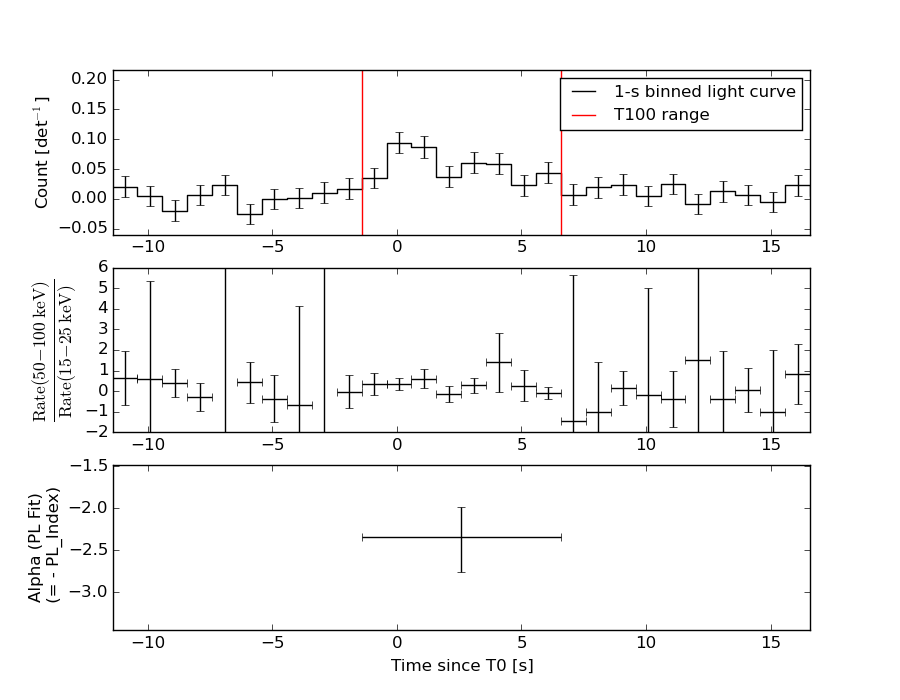
Distribution
T90 vs. Hardness ratio plot
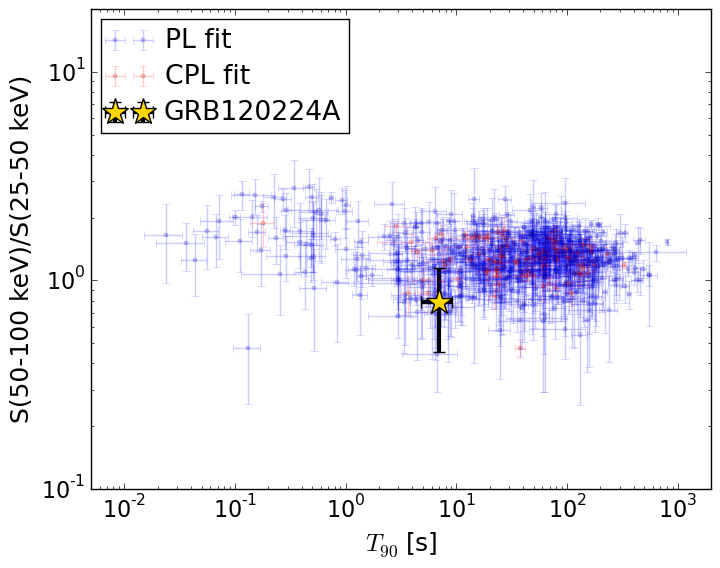
T90                                   = 7.0 sec.
Hardness ratio (energy fluence ratio) = 0.789532594593
S(15-50 keV) vs. S(50-150 keV) plot
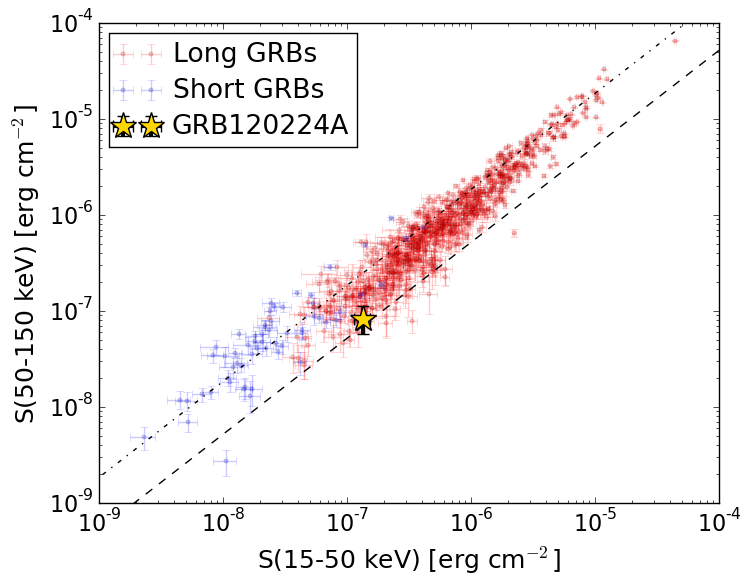
S(15-50 keV)  = 1.3394373e-07
S(50-150 keV) = 8.243919e-08
The dash-dotted line and the dashed line traces the fluences calculated from the Band function with Epeak = 15 and 150 keV, respectively. Both lines assume a canonical values of alpha = -1 and beta = -2.5.
Mask shadow pattern
IMX = -2.854052604166931E-01, IMY = 6.558275520128743E-01
Spacecraft aspect plot
Bright source in the pre-burst/pre-slew/post-slew images
Pre-burst image of 15-350 keV band
Time interval of the image:
-515.215400 -496.569100
-239.416000 -1.416000

# RAcent  DECcent POSerr Theta    Phi  PeakCts   SNR AngSep     Name
#  [deg]    [deg]    ['] [deg]  [deg]                   [']
 83.6336  22.0131    0.3  22.3   58.0  10.6004  44.0    0.1	Crab
 75.2035  27.5277    3.2  23.1   33.5   0.7689   3.6 ------	UNKNOWN
 68.3973  25.3142    2.4  19.9   18.0   0.9569   4.8 ------	UNKNOWN
 81.4657 -51.9624    2.6  58.4 -171.8   5.4540   4.5 ------	UNKNOWN
 43.5451 -41.1528    2.9  51.8 -138.6   4.5835   4.0 ------	UNKNOWN
Pre-slew background subtracted image of 15-350 keV band
Time interval of the image:
-1.416000 6.584000

# RAcent  DECcent POSerr Theta    Phi  PeakCts   SNR AngSep     Name
#  [deg]    [deg]    ['] [deg]  [deg]                   [']
 83.4896  22.1314    6.8  22.3   57.6  -0.0564  -1.7   10.6	Crab
109.1579   0.4680    3.1  41.1  113.2   0.4157   3.6 ------	UNKNOWN
103.3959 -31.4524    2.6  49.8  157.7   0.4279   4.4 ------	UNKNOWN
 40.9352 -17.7806    1.3  35.6 -113.5   0.4947   8.9 ------	UNKNOWN
Post-slew image of 15-350 keV band
Time interval of the image:
93.084600 962.645700

# RAcent  DECcent POSerr Theta    Phi  PeakCts   SNR AngSep     Name
#  [deg]    [deg]    ['] [deg]  [deg]                   [']
 43.6596 -46.1520    2.2  28.5  178.2   2.3995   5.3 ------	UNKNOWN
 33.7254 -74.6547    4.3  57.0 -175.6   5.6798   2.7 ------	UNKNOWN
 21.4382 -24.7601    2.8  19.5 -112.3   1.8800   4.1 ------	UNKNOWN
 16.0026  15.0251    2.8  41.0  -36.4   2.9549   4.2 ------	UNKNOWN
352.0843 -41.9545    3.4  48.0 -128.9   6.8738   3.4 ------	UNKNOWN