Analysis Summary
Notes:
- 1) No attempt has been made to eliminate the non-significant decimal places.
- 2) This batgrbproduct analysis is done using the HEASARC data.
- 3) This batgrbproduct analysis is using the flight position for the mask-weighting calculation.
======================================================================
                  BAT GRB EVENT DATA PROCESSING REPORT
    Process Script Ver: batgrbproduct v2.46
    Process Start Time: Mon Jan 13 06:15:46 EST 2014
             Host Name: batevent1
   Current Working Dir: /local/data/batevent/batevent_reproc/trigger516571
======================================================================

  Trigger: 00516571      Segment: 000

  BAT Trigger Time: 352218919.104   [s; MET]
      Trigger Stop: 352218919.36   [s; MET]
               UTC: 2012-02-29T14:35:11.161400    [includes UTCF correction]
       Where From?: TDRSS position message

  BAT
    RA: 20.0351563795243   Dec: -35.8075827980141  [deg; J2000]

     Catalogged Source?: NO
     Point Source?:      YES
     GRB Indicated?:     YES    [ by BAT flight software ]
     Image S/N Ratio:    9.66
     Image Trigger?:     NO
     Rate S/N Ratio:     19.6977156035922  [ if not an image trigger ]
     Image S/N Ratio:    9.66

  Analysis Position:   [ source = BAT ]
    RA: 20.0351563795243   Dec: -35.8075827980141  [deg; J2000]

  Refined Position:   [ source = BAT pre-slew burst ]
    RA: 20.0407969220775   Dec: -35.7984398286839  [deg; J2000]
        { 01h 20m 09.8s , -35d 47' 54.4" }
         +/- 1.86735064570347 [arcmin] (estimated 90% radius based on SNR)
         +/- 0.981412447146205 [arcmin] (formal 1-sigma fit error)
    SNR: 12.4638680486458

  Angular difference between the analysis and refined position is 0.613414 arcmin

  Partial Coding Fraction: 0.859375    [ including projection effects ]

  Duration
     T90: 0.235999941825867 +/- 0.0368781685195268
        Measured from: 0.0160000324249268
                   to: 0.251999974250793     [s; relative to TRIGTIME]
     T50: 0.167999923229218 +/- 0.0199999928474746
        Measured from: 0.0440000295639038
                   to: 0.211999952793121     [s; relative to TRIGTIME]


  Fluence
     Peak Flux  (peak 1 second)
        Measured from: -0.367999970912933
                   to: 0.632000029087067     [s; relative to TRIGTIME]
     Total Fluence
        Measured from: -0.0079999566078186
                   to: 0.26800000667572     [s; relative to TRIGTIME]

             Band 1     Band 2     Band 3     Band 4
              15-25      25-50     50-100    100-350     keV
 Total     0.015271   0.025555   0.019528   0.007692
           0.003012   0.003358   0.003191   0.002473 [error]
 Peak      0.017321   0.026563   0.019690   0.006567
           0.005158   0.005509   0.005060   0.004008 [error]

     [ fluence units of on-axis counts / fully illuminated detector ]

======================================================================


====== Table of the duration information =============================

        Value   tstart    tstop
T100    0.276   -0.008    0.268
T90     0.236    0.016    0.252
T50     0.168    0.044    0.212
Peak    1.000   -0.368    0.632


====== Spectral Analysis Summary =====================================

Model      : spectral model: simple power-law (PL) and cutoff power-law (CPL)
Ph_index   : photon index: E^{Ph_index}
Ph_90err   : 90% error of the photon index
Epeak      : Epeak in keV
Epeak_90err: 90% error of Epeak
Norm       : normalization at 50 keV in both the PL model and CPL model
Nomr_90err : 90% error of the normalization
chi2       : Chi-Squared
dof        : degree of freedo

=== Time-averaged spectral analysis ===
(Best model with acceptable fit: PL)

Model Ph_index Ph_90err_low Ph_90err_hi  Epeak  Epeak_90err_low  Epeak_90err_hi  Norm       Nomr_90err_low    Norm_90err_hi    chi2    dof
PL      -1.319    -0.249      0.247       -           -               -         1.53e-02     -2.38e-03          2.37e-03      68.130   57
CPL     -0.474    -0.887      1.091       94.035     -32.035       -94.035      3.98e-02     -2.47e-02          9.09e-02      65.460   56


=== 1-s peak spectral analysis ===
(Best model with acceptable fit: PL)

Model Ph_index Ph_90err_low Ph_90err_hi  Epeak  Epeak_90err_low  Epeak_90err_hi  Norm       Nomr_90err_low    Norm_90err_hi    chi2    dof
PL      -1.331     -0.413     0.414       -           -               -         4.33e-03     -1.07e-03          1.07e-03      63.400   57
CPL     -0.729     -0.952     1.784      109.394    -109.394      -109.394      8.59e-03     -5.19e-03          5.43e-02      62.820   56


=== Fluence/Peak Flux Summary ===

              Model    Band1     Band2     Band3     Band4     Band5     Total
                       15-25     25-50    50-100    100-350    15-150    15-350    keV
Fluence         PL   4.54e-09  9.33e-09  1.49e-08  5.35e-08  4.14e-08  8.23e-08   erg/cm2
      90%_error_low -1.11e-09 -1.52e-09 -2.90e-09 -1.88e-08 -7.20e-09 -2.16e-08   erg/cm2
      90%_error_hi   1.18e-09  1.50e-09  2.88e-09  2.45e-08  7.30e-09  2.63e-08   erg/cm2
Peak flux       PL   1.52e-01  1.69e-01  1.34e-01  1.76e-01  5.19e-01  6.31e-01   ph/cm2/s
      90%_error_low -6.02e-02 -4.57e-02 -4.02e-02 -8.76e-02 -1.29e-01 -1.59e-01   ph/cm2/s
      90%_error_hi   6.75e-02  4.47e-02  3.95e-02  1.28e-01  1.29e-01  1.64e-01   ph/cm2/s

Fluence        CPL   3.91e-09  1.02e-08  1.61e-08  1.90e-08  3.97e-08  4.92e-08   erg/cm2
      90%_error_low -1.30e-09 -1.81e-09 -3.33e-09 -1.23e-08 -7.49e-09 -1.44e-08   erg/cm2
      90%_error_hi   1.36e-09  1.89e-09  3.43e-09  3.85e-08  7.59e-09  3.80e-08   erg/cm2
Peak flux      CPL   1.35e-01  1.78e-01  1.42e-01  9.51e-02  5.09e-01  5.51e-01   ph/cm2/s
      90%_error_low -6.96e-02 -5.09e-02 -4.48e-02 -9.51e-02 -1.31e-01 -1.58e-01   ph/cm2/s
      90%_error_hi   7.61e-02  5.42e-02  4.73e-02  1.21e-01  1.31e-01  1.52e-01   ph/cm2/s

======================================================================
Image
Pre-slew 15.0-350.0 keV image (Event data)
#   RAcent    DECcent   POSerr    Theta     Phi              Peak Cts       SNR   Name
   20.0408   -35.7984   0.0155    25.8886  -150.2481         0.0733313     12.464 TRIG_00516571

Foreground time interval of the image:
 -0.008   0.268 (delta_t =   0.276 [sec])
Background time interval of the image:
-127.603  -0.008 (delta_t = 127.595 [sec])
Light Curves
Note: The mask-weighted lightcurves have units of either count/det or counts/sec/det, where a det is 0.4 x 0.4 = 0.16 sq cm.
Full-time range; 1 s binning
Other quick-look light curves:
- 64 ms binning (zoomed)
- 16 ms binning (zoomed)
- 8 ms binning (zoomed)
- 2 ms binning (zoomed)
- SN=5 or 10 s binning (full-time range)
- Raw light curve
Spectra
- 64 ms binning (zoomed)
- 16 ms binning (zoomed)
- 8 ms binning (zoomed)
- 2 ms binning (zoomed)
- SN=5 or 10 s binning (full-time range)
- Raw light curve
Spectra
Notes:
- 1) The fitting includes the systematic errors.
- 2) When the burst includes telescope slew time periods, the fitting uses an average response file made from multiple 5-s response files through out the slew time plus single time preiod for the non-slew times, and weighted by the total counts in the corresponding time period using addrmf. An average response file is needed becuase a spectral fit using the pre-slew DRM will introduce some errors in both a spectral shape and a normalization if the PHA file contains a lot of the slew/post-slew time interval.
- 3) For fits to more complicated models (e.g. a power-law over a cutoff power-law), the BAT team has decided to require a chi-square improvement of more than 6 for each extra dof.
Time averaged spectrum fit using the average DRM
Power-law model
Time interval is from   -0.008 sec. to    0.268 sec.

Spectral model in power-law:
------------------------------------------------------------
Parameters  : value       lower 90%   higher 90%
Photon index: -1.31937     ( -0.24902   0.246593 )
Norm@50keV  : 1.52657E-02    ( -0.00238304   0.00237392 )
------------------------------------------------------------
#Fit statistic : Chi-Squared =          68.13 using 59 PHA bins.
# Reduced chi-squared =          1.195 for     57 degrees of freedom
# Null hypothesis probability =   1.485366e-01

Photon flux (15-150 keV)    in 0.276 sec: 1.82792 ( -0.28294  0.28318 ) ph/cm2/s
Energy fluence (15-150 keV)             : 4.14466e-08 ( -7.2007e-09  7.29711e-09 ) ergs/cm2
Cutoff power-law model
Time interval is from   -0.008 sec. to    0.268 sec.
Spectral model in the cutoff power-law:
------------------------------------------------------------
Parameters  : value       lower 90%   higher 90%
Photon index: -0.473764     ( -0.885865   1.09251 )
Epeak [keV] : 94.0347      ( -32.0973 -94.0973 )
Norm@50keV  : 3.98282E-02    ( -0.0246036   0.0909117 )
------------------------------------------------------------
#Fit statistic : Chi-Squared =          65.46 using 59 PHA bins.
# Reduced chi-squared =          1.169 for     56 degrees of freedom
# Null hypothesis probability =   1.813889e-01

Photon flux (15-150 keV)    in 0.276 sec: 1.78566 ( -0.28575  0.28634 ) ph/cm2/s
Energy fluence (15-150 keV)             : 3.96998e-08 ( -7.49219e-09  7.58578e-09 ) ergs/cm2
1-s peak spectrum fit
Power-law model
Time interval is from   -0.368 sec. to    0.632 sec.

Spectral model in power-law:
------------------------------------------------------------
Parameters  : value       lower 90%   higher 90%
Photon index: -1.33123     ( -0.413332   0.413564 )
Norm@50keV  : 4.32827E-03    ( -0.00107309   0.00106774 )
------------------------------------------------------------
#Fit statistic : Chi-Squared =          63.40 using 59 PHA bins.
# Reduced chi-squared =          1.112 for     57 degrees of freedom
# Null hypothesis probability =   2.609558e-01

Photon flux (15-150 keV)    in 1 sec: 0.519466 ( -0.128794  0.129103 ) ph/cm2/s
Energy fluence (15-150 keV)             : 4.246e-08 ( -1.15819e-08  1.184e-08 ) ergs/cm2
Cutoff power-law model
Time interval is from   -0.368 sec. to    0.632 sec.
Spectral model in the cutoff power-law:
------------------------------------------------------------
Parameters  : value       lower 90%   higher 90%
Photon index: -0.729266     ( -0.953597   1.78186 )
Epeak [keV] : 109.394      ( -109.261 -109.261 )
Norm@50keV  : 8.58609E-03    ( -0.00520933   0.0543175 )
------------------------------------------------------------
#Fit statistic : Chi-Squared =          62.82 using 59 PHA bins.
# Reduced chi-squared =          1.122 for     56 degrees of freedom
# Null hypothesis probability =   2.473904e-01

Photon flux (15-150 keV)    in 1 sec: 0.509104 ( -0.130661  0.131095 ) ph/cm2/s
Energy fluence (15-150 keV)             : 4.09553e-08 ( -1.22105e-08  1.35966e-08 ) ergs/cm2
Time-resolved spectra

Distribution
T90 vs. Hardness ratio plot
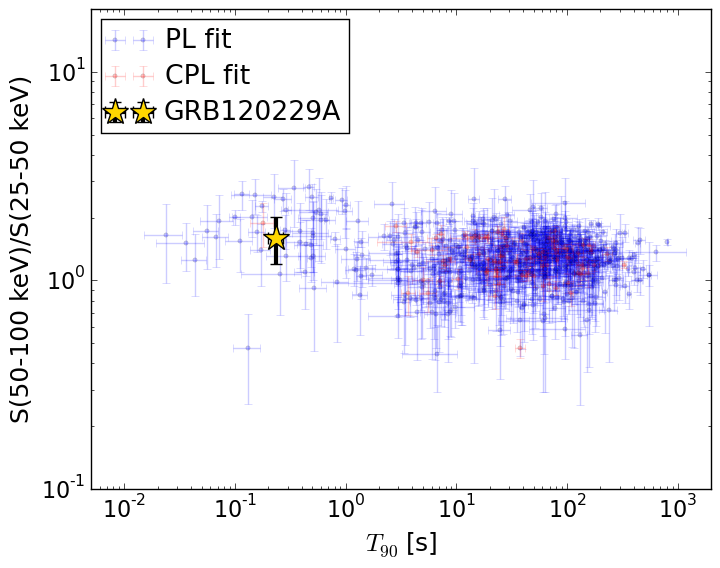
T90                                   = 0.2359999 sec.
Hardness ratio (energy fluence ratio) = 1.60283982411
S(15-50 keV) vs. S(50-150 keV) plot
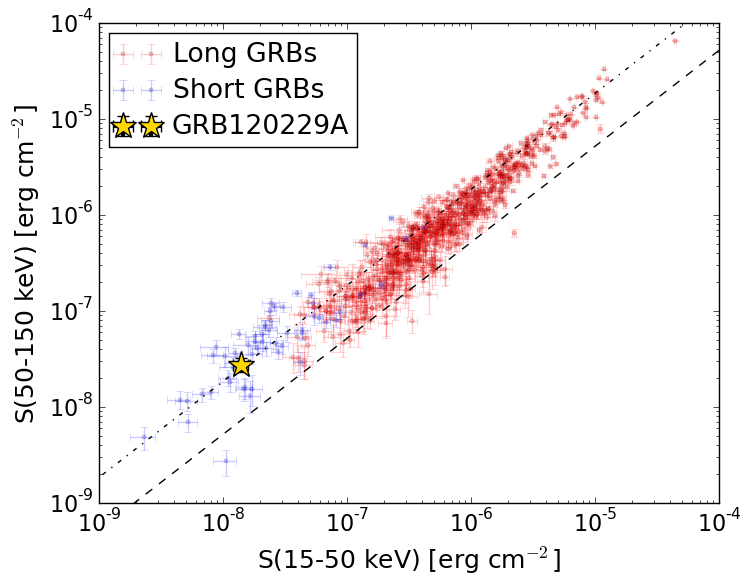
S(15-50 keV)  = 1.3869028e-08
S(50-150 keV) = 2.757769e-08
The dash-dotted line and the dashed line traces the fluences calculated from the Band function with Epeak = 15 and 150 keV, respectively. Both lines assume a canonical values of alpha = -1 and beta = -2.5.
Mask shadow pattern
IMX = -4.213536167508830E-01, IMY = 2.408422241329696E-01
Spacecraft aspect plot
Bright source in the pre-burst/pre-slew/post-slew images
Pre-burst image of 15-350 keV band
Time interval of the image:
-127.603410 -0.008000

# RAcent  DECcent POSerr Theta    Phi  PeakCts   SNR AngSep     Name
#  [deg]    [deg]    ['] [deg]  [deg]                   [']
 82.8395 -29.4367    2.5  39.9  103.1   2.0733   4.6 ------	UNKNOWN
Pre-slew background subtracted image of 15-350 keV band
Time interval of the image:
-0.008000 0.268000

# RAcent  DECcent POSerr Theta    Phi  PeakCts   SNR AngSep     Name
#  [deg]    [deg]    ['] [deg]  [deg]                   [']
 20.0408 -35.7984    0.9  25.9 -150.2   0.0733  12.5 ------	UNKNOWN
  2.3588 -59.7460    2.3  50.4 -167.7   0.0691   5.0 ------	UNKNOWN
 34.5881  35.6914    2.5  53.8  -18.3   0.0748   4.6 ------	UNKNOWN
Post-slew image of 15-350 keV band
Time interval of the image:
-239.104000 962.947400

# RAcent  DECcent POSerr Theta    Phi  PeakCts   SNR AngSep     Name
#  [deg]    [deg]    ['] [deg]  [deg]                   [']
 69.2734 -62.6067    2.4  49.0  151.3   9.9071   4.9 ------	UNKNOWN
 54.3460  -9.0377    2.6  15.6   46.1   2.2720   4.4 ------	UNKNOWN
 38.9553 -56.1350    2.7  38.4  170.0   3.5608   4.4 ------	UNKNOWN
 58.0458  35.1919    2.9  55.3    5.1   8.8750   4.1 ------	UNKNOWN
 19.3257 -62.2979    2.9  47.1 -178.3   4.3293   4.0 ------	UNKNOWN
 37.7293   5.6590    3.4  23.6  -20.0   1.5624   3.4 ------	UNKNOWN
 41.2178  34.2118    3.0  51.9  -11.6   5.2831   3.9 ------	UNKNOWN
342.0948 -55.3233    4.0  58.0 -156.8  12.6343   2.9 ------	UNKNOWN
349.9963 -31.7930    3.2  47.9 -129.0   8.9488   3.6 ------	UNKNOWN