Analysis Summary
Notes:
- 1) No attempt has been made to eliminate the non-significant decimal places.
- 2) This batgrbproduct analysis is done using the HEASARC data.
- 3) This batgrbproduct analysis is using the flight position for the mask-weighting calculation.
======================================================================
BAT GRB EVENT DATA PROCESSING REPORT
Process Script Ver: batgrbproduct v2.46
Process Start Time: Mon Jan 13 06:04:32 EST 2014
Host Name: batevent1
Current Working Dir: /local/data/batevent/batevent_reproc/trigger517234
======================================================================
Trigger: 00517234 Segment: 000
BAT Trigger Time: 352880026.624 [s; MET]
Trigger Stop: 352880030.72 [s; MET]
UTC: 2012-03-08T06:13:38.654560 [includes UTCF correction]
Where From?: TDRSS position message
BAT
RA: 219.077930337103 Dec: 79.7034623843718 [deg; J2000]
Catalogged Source?: NO
Point Source?: YES
GRB Indicated?: YES [ by BAT flight software ]
Image S/N Ratio: 8.74
Image Trigger?: NO
Rate S/N Ratio: 8.30662386291807 [ if not an image trigger ]
Image S/N Ratio: 8.74
Analysis Position: [ source = BAT ]
RA: 219.077930337103 Dec: 79.7034623843718 [deg; J2000]
Refined Position: [ source = BAT pre-slew burst ]
RA: 219.12266054142 Dec: 79.677734855378 [deg; J2000]
{ 14h 36m 29.4s , +79d 40' 39.8" }
+/- 1.31455536765174 [arcmin] (estimated 90% radius based on SNR)
+/- 0.425188706623284 [arcmin] (formal 1-sigma fit error)
SNR: 20.5794735924838
Angular difference between the analysis and refined position is 1.616649 arcmin
Partial Coding Fraction: 0.9765625 [ including projection effects ]
Duration
T90: 61.2559999227524 +/- 16.8148358036733
Measured from: -19.4639999866486
to: 41.7919999361038 [s; relative to TRIGTIME]
T50: 23.1159999966621 +/- 3.68487558487293
Measured from: -6.28400003910065
to: 16.8319999575615 [s; relative to TRIGTIME]
Fluence
Peak Flux (peak 1 second)
Measured from: 0.624000012874603
to: 1.6240000128746 [s; relative to TRIGTIME]
Total Fluence
Measured from: -24.7520000338554
to: 58.2039999961853 [s; relative to TRIGTIME]
Band 1 Band 2 Band 3 Band 4
15-25 25-50 50-100 100-350 keV
Total 0.667613 0.803141 0.502276 0.097781
0.045030 0.047349 0.043354 0.041502 [error]
Peak 0.023313 0.030163 0.019870 0.001468
0.005007 0.005475 0.005001 0.004647 [error]
[ fluence units of on-axis counts / fully illuminated detector ]
======================================================================
====== Table of the duration information =============================
Value tstart tstop
T100 82.956 -24.752 58.204
T90 61.256 -19.464 41.792
T50 23.116 -6.284 16.832
Peak 1.000 0.624 1.624
====== Spectral Analysis Summary =====================================
Model : spectral model: simple power-law (PL) and cutoff power-law (CPL)
Ph_index : photon index: E^{Ph_index}
Ph_90err : 90% error of the photon index
Epeak : Epeak in keV
Epeak_90err: 90% error of Epeak
Norm : normalization at 50 keV in both the PL model and CPL model
Nomr_90err : 90% error of the normalization
chi2 : Chi-Squared
dof : degree of freedo
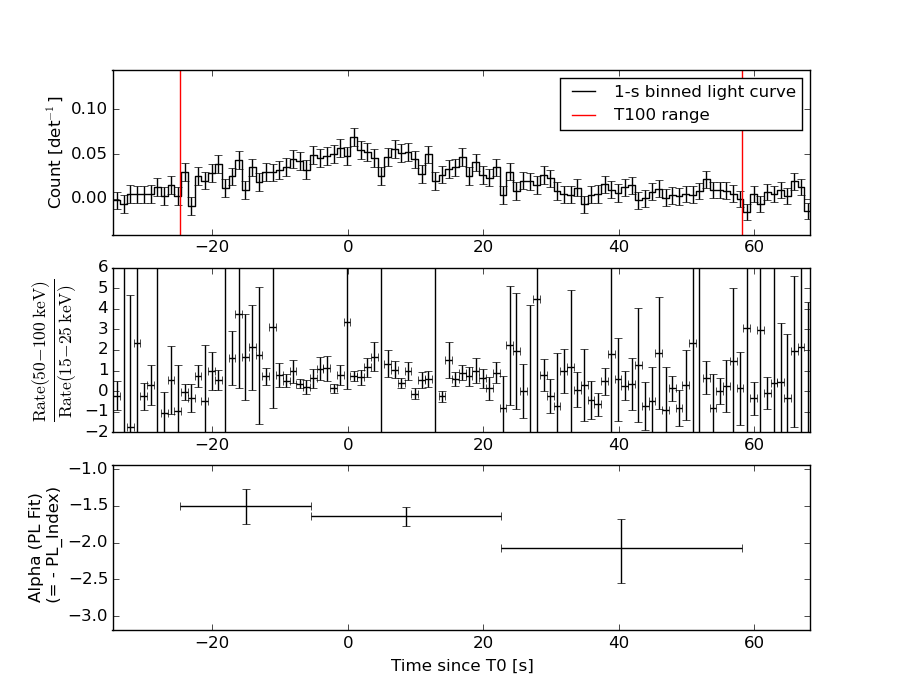
=== Time-averaged spectral analysis ===
(Best model with acceptable fit: PL)
Model Ph_index Ph_90err_low Ph_90err_hi Epeak Epeak_90err_low Epeak_90err_hi Norm Nomr_90err_low Norm_90err_hi chi2 dof
PL -1.719 -0.130 0.127 - - - 1.52e-03 -1.21e-04 1.20e-04 53.070 57
CPL -1.095 -0.507 0.581 65.035 -14.143 80.572 3.34e-03 -1.55e-03 3.55e-03 48.520 56
=== 1-s peak spectral analysis ===
(Best model with acceptable fit: PL)
Model Ph_index Ph_90err_low Ph_90err_hi Epeak Epeak_90err_low Epeak_90err_hi Norm Nomr_90err_low Norm_90err_hi chi2 dof
PL -1.707 -0.408 0.374 - - - 4.48e-03 -1.16e-03 1.11e-03 68.960 57
CPL -1.335 -1.071 1.997 76.369 -76.325 -76.369 7.33e-03 -7.33e-03 1.02e-01 68.790 56
=== Fluence/Peak Flux Summary ===
Model Band1 Band2 Band3 Band4 Band5 Total
15-25 25-50 50-100 100-350 15-150 15-350 keV
Fluence PL 1.98e-07 3.19e-07 3.88e-07 9.25e-07 1.17e-06 1.83e-06 erg/cm2
90%_error_low -2.12e-08 -2.22e-08 -4.20e-08 -1.91e-07 -9.72e-08 -2.33e-07 erg/cm2
90%_error_hi 2.17e-08 2.22e-08 4.23e-08 2.23e-07 9.87e-08 2.59e-07 erg/cm2
Peak flux PL 2.25e-01 2.00e-01 1.23e-01 1.14e-01 5.96e-01 6.62e-01 ph/cm2/s
90%_error_low -6.76e-02 -4.22e-02 -4.06e-02 -5.97e-02 -1.26e-01 -1.46e-01 ph/cm2/s
90%_error_hi 7.12e-02 4.22e-02 4.13e-02 8.97e-02 1.26e-01 1.50e-01 ph/cm2/s
Fluence CPL 1.84e-07 3.42e-07 3.86e-07 3.45e-07 1.09e-06 1.26e-06 erg/cm2
90%_error_low -2.45e-08 -2.86e-08 -4.71e-08 -1.79e-07 -1.11e-07 -2.14e-07 erg/cm2
90%_error_hi 2.47e-08 2.94e-08 4.63e-08 4.04e-07 1.14e-07 4.15e-07 erg/cm2
Peak flux CPL 2.17e-01 2.10e-01 1.23e-01 6.60e-02 5.89e-01 6.16e-01 ph/cm2/s
90%_error_low -7.64e-02 -5.04e-02 -4.75e-02 -6.60e-02 -1.30e-01 -1.53e-01 ph/cm2/s
90%_error_hi 7.63e-02 6.05e-02 4.41e-02 6.54e-02 1.30e-01 1.89e-01 ph/cm2/s
======================================================================
Image
Pre-slew 15.0-350.0 keV image (Event data)
#   RAcent    DECcent   POSerr    Theta     Phi              Peak Cts       SNR   Name
  219.1227    79.6777   0.0093    19.8523   -28.6161         1.8948941     20.579 TRIG_00517234

Foreground time interval of the image:
-24.752  35.877 (delta_t =  60.629 [sec])
Background time interval of the image:
-239.624 -24.752 (delta_t = 214.872 [sec])
Light Curves
Note: The mask-weighted lightcurves have units of either count/det or counts/sec/det, where a det is 0.4 x 0.4 = 0.16 sq cm.
Full-time range; 1 s binning
Other quick-look light curves:
- 64 ms binning (zoomed)
- 16 ms binning (zoomed)
- 8 ms binning (zoomed)
- 2 ms binning (zoomed)
- SN=5 or 10 s binning (full-time range)
- Raw light curve
Spectra
- 64 ms binning (zoomed)
- 16 ms binning (zoomed)
- 8 ms binning (zoomed)
- 2 ms binning (zoomed)
- SN=5 or 10 s binning (full-time range)
- Raw light curve
Spectra
Notes:
- 1) The fitting includes the systematic errors.
- 2) When the burst includes telescope slew time periods, the fitting uses an average response file made from multiple 5-s response files through out the slew time plus single time preiod for the non-slew times, and weighted by the total counts in the corresponding time period using addrmf. An average response file is needed becuase a spectral fit using the pre-slew DRM will introduce some errors in both a spectral shape and a normalization if the PHA file contains a lot of the slew/post-slew time interval.
- 3) For fits to more complicated models (e.g. a power-law over a cutoff power-law), the BAT team has decided to require a chi-square improvement of more than 6 for each extra dof.
Time averaged spectrum fit using the average DRM
Power-law model
Time interval is from  -24.752 sec. to   58.204 sec.

Spectral model in power-law:
------------------------------------------------------------
Parameters  : value       lower 90%   higher 90%
Photon index: -1.71877     ( -0.13013   0.127256 )
Norm@50keV  : 1.52465E-03    ( -0.000121361   0.000119971 )
------------------------------------------------------------
#Fit statistic : Chi-Squared =          53.07 using 59 PHA bins.
# Reduced chi-squared =         0.9310 for     57 degrees of freedom
# Null hypothesis probability =   6.233013e-01

Photon flux (15-150 keV)    in 82.96 sec: 0.203846 ( -0.014245  0.014249 ) ph/cm2/s
Energy fluence (15-150 keV)             : 1.16963e-06 ( -9.72233e-08  9.87207e-08 ) ergs/cm2
Cutoff power-law model
Time interval is from  -24.752 sec. to   58.204 sec.
Spectral model in the cutoff power-law:
------------------------------------------------------------
Parameters  : value       lower 90%   higher 90%
Photon index: -1.09529     ( -0.507256   0.581077 )
Epeak [keV] : 65.0351      ( -14.1435 80.5721 )
Norm@50keV  : 3.33995E-03    ( -0.00154588   0.00354594 )
------------------------------------------------------------
#Fit statistic : Chi-Squared =          48.52 using 59 PHA bins.
# Reduced chi-squared =         0.8664 for     56 degrees of freedom
# Null hypothesis probability =   7.510014e-01

Photon flux (15-150 keV)    in 82.96 sec: 0.197629 ( -0.015055  0.015057 ) ph/cm2/s
Energy fluence (15-150 keV)             : 1.09423e-06 ( -1.1129e-07  1.14327e-07 ) ergs/cm2
1-s peak spectrum fit
Power-law model
Time interval is from    0.624 sec. to    1.624 sec.

Spectral model in power-law:
------------------------------------------------------------
Parameters  : value       lower 90%   higher 90%
Photon index: -1.70676     ( -0.40814   0.373793 )
Norm@50keV  : 4.47972E-03    ( -0.00116422   0.00111349 )
------------------------------------------------------------
#Fit statistic : Chi-Squared =          68.96 using 59 PHA bins.
# Reduced chi-squared =          1.210 for     57 degrees of freedom
# Null hypothesis probability =   1.331063e-01

Photon flux (15-150 keV)    in 1 sec: 0.596394 ( -0.125695  0.125703 ) ph/cm2/s
Energy fluence (15-150 keV)             : 4.14629e-08 ( -1.09116e-08  1.14218e-08 ) ergs/cm2
Cutoff power-law model
Time interval is from    0.624 sec. to    1.624 sec.
Spectral model in the cutoff power-law:
------------------------------------------------------------
Parameters  : value       lower 90%   higher 90%
Photon index: -1.33483     ( -1.07114   1.99716 )
Epeak [keV] : 76.3689      ( -76.3249 -76.3689 )
Norm@50keV  : 7.32874E-03    ( -0.00732874   0.102406 )
------------------------------------------------------------
#Fit statistic : Chi-Squared =          68.79 using 59 PHA bins.
# Reduced chi-squared =          1.228 for     56 degrees of freedom
# Null hypothesis probability =   1.172487e-01

Photon flux (15-150 keV)    in 1 sec: 0.588502 ( -0.129571  0.1295 ) ph/cm2/s
Energy fluence (15-150 keV)             : 3.96333e-08 ( -1.23875e-08  1.28305e-08 ) ergs/cm2
Time-resolved spectra
Distribution
T90 vs. Hardness ratio plot
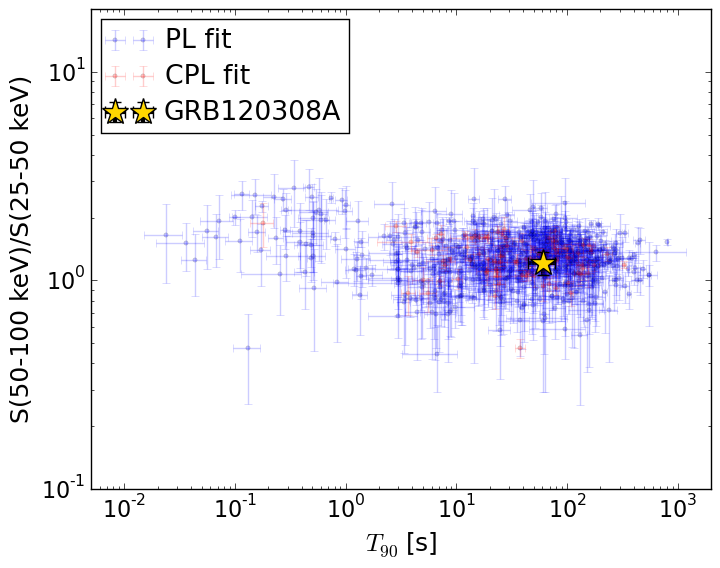
T90                                   = 61.256 sec.
Hardness ratio (energy fluence ratio) = 1.21526198291
S(15-50 keV) vs. S(50-150 keV) plot
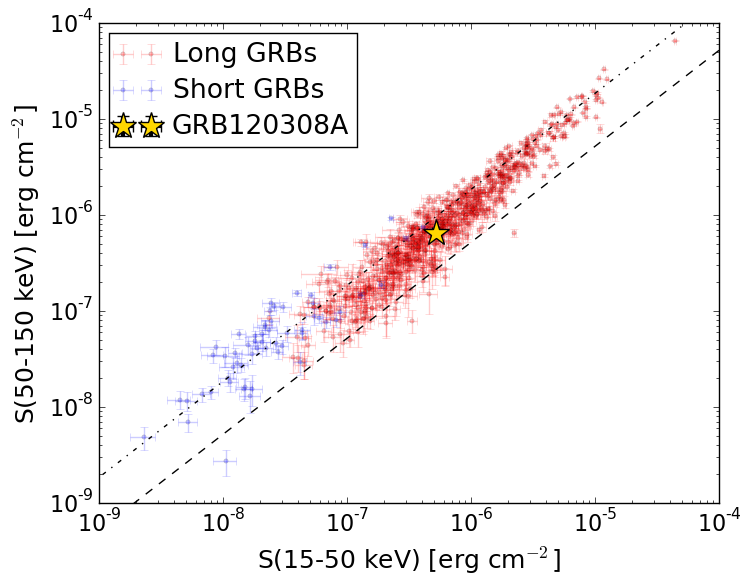
S(15-50 keV)  = 5.174588e-07
S(50-150 keV) = 6.52176e-07
The dash-dotted line and the dashed line traces the fluences calculated from the Band function with Epeak = 15 and 150 keV, respectively. Both lines assume a canonical values of alpha = -1 and beta = -2.5.
Mask shadow pattern
IMX = 3.169507521572804E-01, IMY = 1.729227277776173E-01
Spacecraft aspect plot
Bright source in the pre-burst/pre-slew/post-slew images
Pre-burst image of 15-350 keV band
Time interval of the image:
-239.624000 -24.752000

# RAcent  DECcent POSerr Theta    Phi  PeakCts   SNR AngSep     Name
#  [deg]    [deg]    ['] [deg]  [deg]                   [']
119.5113  29.0995    2.9  43.4  160.5   3.1401   4.1 ------	UNKNOWN
181.6244  64.0018    3.3  13.7   37.3   1.0944   3.5 ------	UNKNOWN
273.5135  47.6238    3.4  56.4  -16.5   4.0004   3.4 ------	UNKNOWN
 42.9076  71.6806    2.4  31.2  -94.0   2.1690   4.7 ------	UNKNOWN
348.6917  67.7828    3.4  42.5  -69.2   4.8346   3.4 ------	UNKNOWN
Pre-slew background subtracted image of 15-350 keV band
Time interval of the image:
-24.752000 35.876600

# RAcent  DECcent POSerr Theta    Phi  PeakCts   SNR AngSep     Name
#  [deg]    [deg]    ['] [deg]  [deg]                   [']
108.8372  29.2816    1.8  46.0  173.2   1.2152   6.4 ------	UNKNOWN
229.5714  61.6525    2.2  31.8    4.3   0.5931   5.2 ------	UNKNOWN
219.1226  79.6777    0.6  19.9  -28.6   1.8951  20.6 ------	UNKNOWN
264.3770  43.0810    2.7  58.3   -7.4   2.3159   4.3 ------	UNKNOWN
Post-slew image of 15-350 keV band
Time interval of the image:
81.076600 962.389400

# RAcent  DECcent POSerr Theta    Phi  PeakCts   SNR AngSep     Name
#  [deg]    [deg]    ['] [deg]  [deg]                   [']
254.5862  35.3309   20.2  46.5   -1.7  -0.5422  -0.6    6.3	Her X-1
244.1700  26.7860    3.2  54.0   11.1   6.3867   3.6 ------	UNKNOWN
128.2402  74.0845    2.7  19.0  161.8   1.8933   4.3 ------	UNKNOWN
 40.5183  47.1049    2.9  53.2 -142.2  10.8523   3.9 ------	UNKNOWN
 24.5181  52.1135    2.5  47.9 -129.0   9.6344   4.6 ------	UNKNOWN