Analysis Summary
Notes:
- 1) No attempt has been made to eliminate the non-significant decimal places.
- 2) This batgrbproduct analysis is done using the HEASARC data.
- 3) This batgrbproduct analysis is using the flight position for the mask-weighting calculation.
======================================================================
BAT GRB EVENT DATA PROCESSING REPORT
Process Script Ver: batgrbproduct v2.46
Process Start Time: Mon Jan 13 05:53:43 EST 2014
Host Name: batevent1
Current Working Dir: /local/data/batevent/batevent_reproc/trigger517469
======================================================================
Trigger: 00517469 Segment: 000
BAT Trigger Time: 353136826.304 [s; MET]
Trigger Stop: 353136826.56 [s; MET]
UTC: 2012-03-11T05:33:38.324140 [includes UTCF correction]
Where From?: TDRSS position message
BAT
RA: 273.086737373698 Dec: 14.2755565148965 [deg; J2000]
Catalogged Source?: NO
Point Source?: YES
GRB Indicated?: YES [ by BAT flight software ]
Image S/N Ratio: 12.99
Image Trigger?: NO
Rate S/N Ratio: 25.0199920063936 [ if not an image trigger ]
Image S/N Ratio: 12.99
Analysis Position: [ source = BAT ]
RA: 273.086737373698 Dec: 14.2755565148965 [deg; J2000]
Refined Position: [ source = BAT pre-slew burst ]
RA: 273.075094741315 Dec: 14.2965464351011 [deg; J2000]
{ 18h 12m 18.0s , +14d 17' 47.6" }
+/- 1.12471480168645 [arcmin] (estimated 90% radius based on SNR)
+/- 0.517870236248799 [arcmin] (formal 1-sigma fit error)
SNR: 25.7158361797186
Angular difference between the analysis and refined position is 1.429806 arcmin
Partial Coding Fraction: 0.71875 [ including projection effects ]
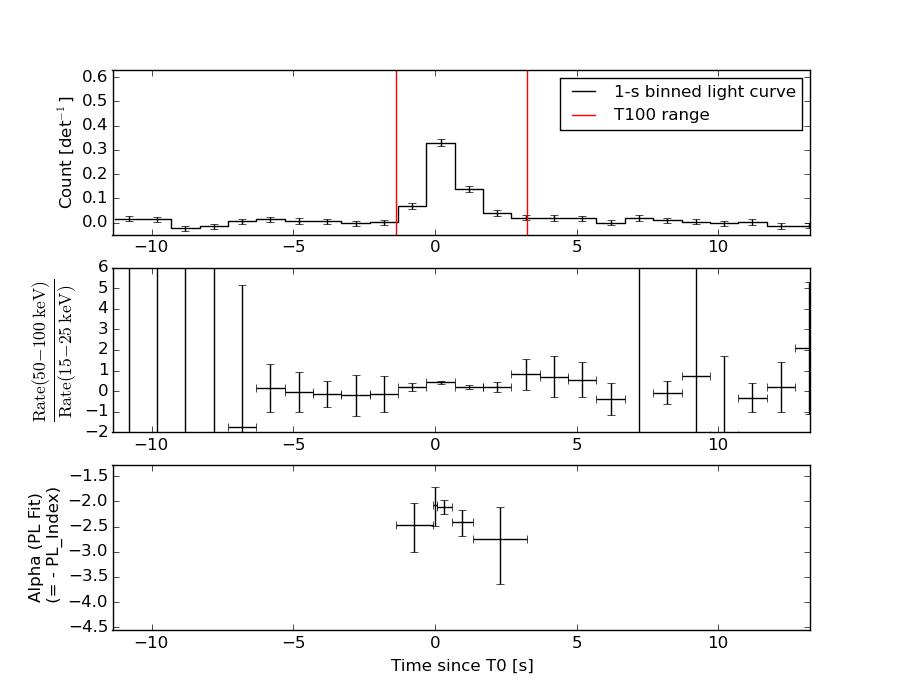
Duration
T90: 3.47999995946884 +/- 0.819795078477236
Measured from: -0.952000021934509
to: 2.52799993753433 [s; relative to TRIGTIME]
T50: 0.815999984741211 +/- 0.13792750112767
Measured from: 0.0959999561309814
to: 0.911999940872192 [s; relative to TRIGTIME]
Fluence
Peak Flux (peak 1 second)
Measured from: -0.0720000267028809
to: 0.927999973297119 [s; relative to TRIGTIME]
Total Fluence
Measured from: -1.37600004673004
to: 3.22799998521805 [s; relative to TRIGTIME]
Band 1 Band 2 Band 3 Band 4
15-25 25-50 50-100 100-350 keV
Total 0.259436 0.235777 0.089076 0.027720
0.015187 0.014845 0.011766 0.009414 [error]
Peak 0.144512 0.150025 0.058510 0.013671
0.008378 0.008238 0.006104 0.004522 [error]
[ fluence units of on-axis counts / fully illuminated detector ]
======================================================================
====== Table of the duration information =============================
Value tstart tstop
T100 4.604 -1.376 3.228
T90 3.480 -0.952 2.528
T50 0.816 0.096 0.912
Peak 1.000 -0.072 0.928
====== Spectral Analysis Summary =====================================
Model : spectral model: simple power-law (PL) and cutoff power-law (CPL)
Ph_index : photon index: E^{Ph_index}
Ph_90err : 90% error of the photon index
Epeak : Epeak in keV
Epeak_90err: 90% error of Epeak
Norm : normalization at 50 keV in both the PL model and CPL model
Nomr_90err : 90% error of the normalization
chi2 : Chi-Squared
dof : degree of freedo
=== Time-averaged spectral analysis ===
(Best model with acceptable fit: PL)
Model Ph_index Ph_90err_low Ph_90err_hi Epeak Epeak_90err_low Epeak_90err_hi Norm Nomr_90err_low Norm_90err_hi chi2 dof
PL -2.293 -0.157 0.150 - - - 6.73e-03 -6.98e-04 6.87e-04 46.570 57
CPL -2.294 N/A N/A 10000.000 N/A N/A 6.72e-03 N/A N/A 46.580 56
=== 1-s peak spectral analysis ===
(Best model with acceptable fit: PL)
Model Ph_index Ph_90err_low Ph_90err_hi Epeak Epeak_90err_low Epeak_90err_hi Norm Nomr_90err_low Norm_90err_hi chi2 dof
PL -2.185 -0.128 0.124 - - - 1.95e-02 -1.65e-03 1.63e-03 42.690 57
CPL -2.176 -0.136 0.115 9999.360 N/A N/A 1.97e-02 N/A N/A 42.730 56
=== Fluence/Peak Flux Summary ===
Model Band1 Band2 Band3 Band4 Band5 Total
15-25 25-50 50-100 100-350 15-150 15-350 keV
Fluence PL 8.38e-08 9.54e-08 7.79e-08 1.06e-07 2.96e-07 3.63e-07 erg/cm2
90%_error_low -8.70e-09 -7.22e-09 -1.10e-08 -2.68e-08 -2.52e-08 -4.10e-08 erg/cm2
90%_error_hi 8.88e-09 7.21e-09 1.13e-08 3.25e-08 2.56e-08 4.48e-08 erg/cm2
Peak flux PL 1.56e+00 1.05e+00 4.61e-01 2.80e-01 3.21e+00 3.35e+00 ph/cm2/s
90%_error_low -1.51e-01 -7.03e-02 -5.08e-02 -5.47e-02 -2.20e-01 -2.25e-01 ph/cm2/s
90%_error_hi 1.55e-01 7.03e-02 5.13e-02 6.23e-02 2.20e-01 2.25e-01 ph/cm2/s
Fluence CPL N/A N/A N/A N/A N/A N/A erg/cm2
90%_error_low -8.70e-09 -7.22e-09 -1.10e-08 -2.68e-08 -2.52e-08 -4.10e-08 erg/cm2
90%_error_hi 8.88e-09 7.21e-09 1.13e-08 3.25e-08 2.56e-08 4.48e-08 erg/cm2
Peak flux CPL 1.44e+00 1.14e+00 4.52e-01 1.08e-01 3.11e+00 3.14e+00 ph/cm2/s
90%_error_low -1.76e-01 -9.60e-02 -6.08e-02 -5.72e-02 -2.31e-01 -2.42e-01 ph/cm2/s
90%_error_hi 1.77e-01 9.87e-02 5.80e-02 1.08e-01 2.30e-01 2.50e-01 ph/cm2/s
======================================================================
Image
Pre-slew 15.0-350.0 keV image (Event data)
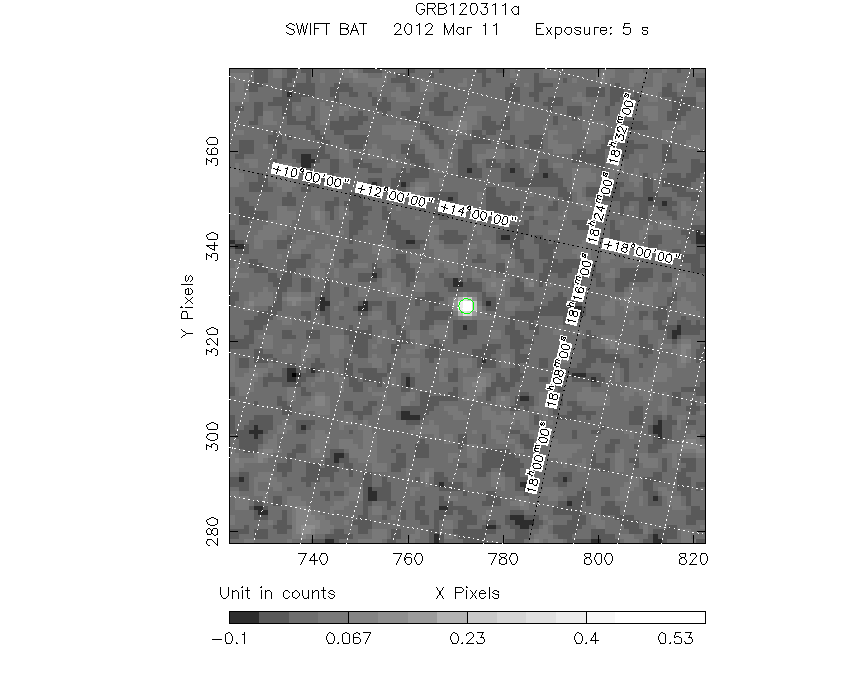
#   RAcent    DECcent   POSerr    Theta     Phi              Peak Cts       SNR   Name
  273.0751    14.2965   0.0075    21.1147    54.2487         0.6593838     25.716 TRIG_00517469

Foreground time interval of the image:
 -1.376   3.228 (delta_t =   4.604 [sec])
Background time interval of the image:
-213.003  -1.376 (delta_t = 211.627 [sec])
Light Curves
Note: The mask-weighted lightcurves have units of either count/det or counts/sec/det, where a det is 0.4 x 0.4 = 0.16 sq cm.
Full-time range; 1 s binning
Other quick-look light curves:
- 64 ms binning (zoomed)
- 16 ms binning (zoomed)
- 8 ms binning (zoomed)
- 2 ms binning (zoomed)
- SN=5 or 10 s binning (full-time range)
- Raw light curve
Spectra
- 64 ms binning (zoomed)
- 16 ms binning (zoomed)
- 8 ms binning (zoomed)
- 2 ms binning (zoomed)
- SN=5 or 10 s binning (full-time range)
- Raw light curve
Spectra
Notes:
- 1) The fitting includes the systematic errors.
- 2) When the burst includes telescope slew time periods, the fitting uses an average response file made from multiple 5-s response files through out the slew time plus single time preiod for the non-slew times, and weighted by the total counts in the corresponding time period using addrmf. An average response file is needed becuase a spectral fit using the pre-slew DRM will introduce some errors in both a spectral shape and a normalization if the PHA file contains a lot of the slew/post-slew time interval.
- 3) For fits to more complicated models (e.g. a power-law over a cutoff power-law), the BAT team has decided to require a chi-square improvement of more than 6 for each extra dof.
Time averaged spectrum fit using the average DRM
Power-law model

Time interval is from   -1.376 sec. to    3.228 sec.

Spectral model in power-law:
------------------------------------------------------------
Parameters  : value       lower 90%   higher 90%
Photon index: -2.29308     ( -0.157243   0.150109 )
Norm@50keV  : 6.73011E-03    ( -0.000698384   0.000686575 )
------------------------------------------------------------
#Fit statistic : Chi-Squared =          46.57 using 59 PHA bins.
# Reduced chi-squared =         0.8170 for     57 degrees of freedom
# Null hypothesis probability =   8.365582e-01

Photon flux (15-150 keV)    in 4.604 sec: 1.17177 ( -0.08779  0.08787 ) ph/cm2/s
Energy fluence (15-150 keV)             : 2.95791e-07 ( -2.51866e-08  2.55638e-08 ) ergs/cm2
Cutoff power-law model
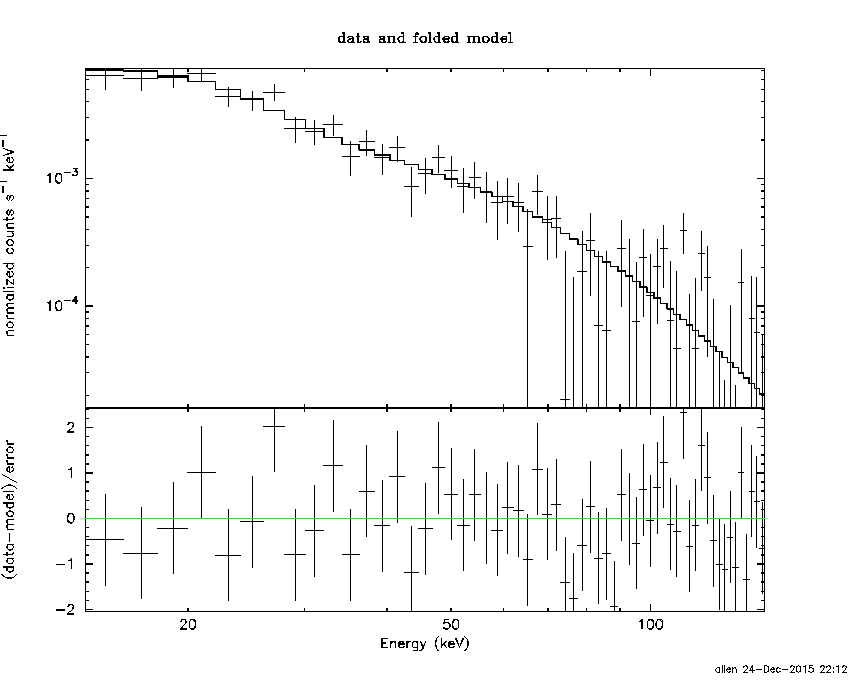
Time interval is from   -1.376 sec. to    3.228 sec.
Spectral model in the cutoff power-law:
------------------------------------------------------------
Parameters  : value       lower 90%   higher 90%
Photon index: -2.29425     (       )
Epeak [keV] : 1.00000E+04      (   )
Norm@50keV  : 6.72012E-03    (     )
------------------------------------------------------------
#Fit statistic : Chi-Squared =          46.58 using 59 PHA bins.
# Reduced chi-squared =         0.8317 for     56 degrees of freedom
# Null hypothesis probability =   8.111287e-01

Photon flux (15-150 keV)    in 4.604 sec: 1.15500 ( -0.09429  0.08675 ) ph/cm2/s
Energy fluence (15-150 keV)             : 0 ( 0  0 ) ergs/cm2
1-s peak spectrum fit
Power-law model
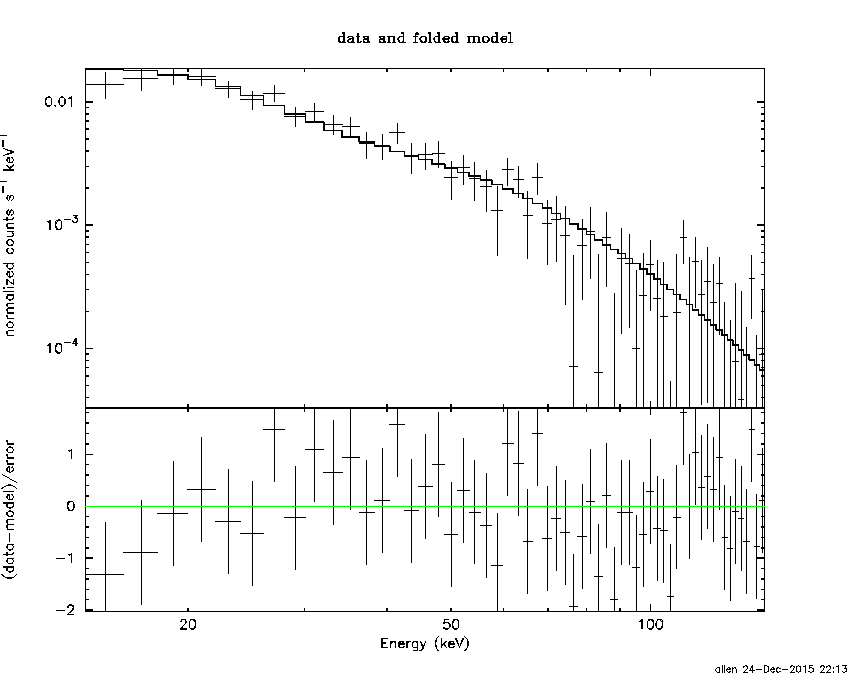
Time interval is from   -0.072 sec. to    0.928 sec.

Spectral model in power-law:
------------------------------------------------------------
Parameters  : value       lower 90%   higher 90%
Photon index: -2.18487     ( -0.12825   0.123834 )
Norm@50keV  : 1.95132E-02    ( -0.00164918   0.0016262 )
------------------------------------------------------------
#Fit statistic : Chi-Squared =          42.69 using 59 PHA bins.
# Reduced chi-squared =         0.7489 for     57 degrees of freedom
# Null hypothesis probability =   9.205282e-01

Photon flux (15-150 keV)    in 1 sec: 3.20532 ( -0.21997  0.22023 ) ph/cm2/s
Energy fluence (15-150 keV)             : 1.83122e-07 ( -1.36609e-08  1.37754e-08 ) ergs/cm2
Cutoff power-law model

Time interval is from   -0.072 sec. to    0.928 sec.
Spectral model in the cutoff power-law:
------------------------------------------------------------
Parameters  : value       lower 90%   higher 90%
Photon index: -2.17574     ( -0.135393   0.116095 )
Epeak [keV] : 9999.36      (   )
Norm@50keV  : 1.96717E-02    (     )
------------------------------------------------------------
#Fit statistic : Chi-Squared =          42.72 using 59 PHA bins.
# Reduced chi-squared =         0.7628 for     56 degrees of freedom
# Null hypothesis probability =   9.043335e-01

Photon flux (15-150 keV)    in 1 sec: 3.11480 ( -0.23051  0.2303 ) ph/cm2/s
Energy fluence (15-150 keV)             : 0 ( 0  0 ) ergs/cm2
Time-resolved spectra
Distribution
T90 vs. Hardness ratio plot

T90                                   = 3.48 sec.
Hardness ratio (energy fluence ratio) = 0.816206729402
S(15-50 keV) vs. S(50-150 keV) plot
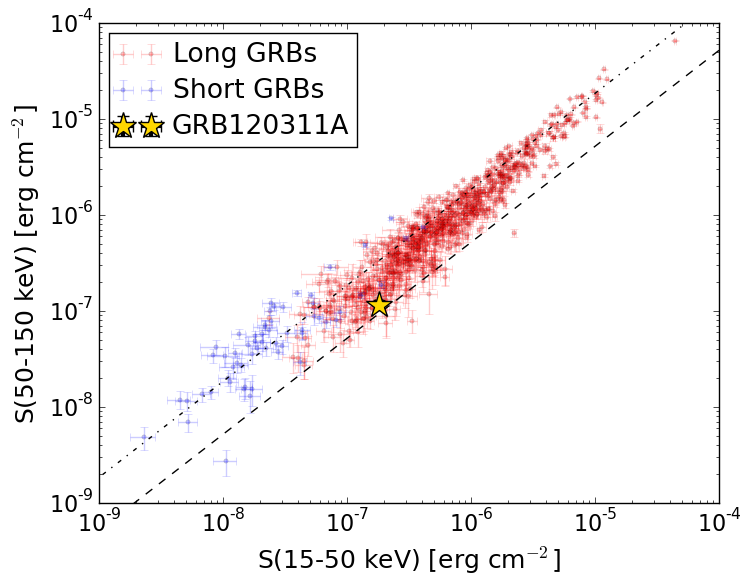
S(15-50 keV)  = 1.792026e-07
S(50-150 keV) = 1.165882e-07
The dash-dotted line and the dashed line traces the fluences calculated from the Band function with Epeak = 15 and 150 keV, respectively. Both lines assume a canonical values of alpha = -1 and beta = -2.5.
Mask shadow pattern
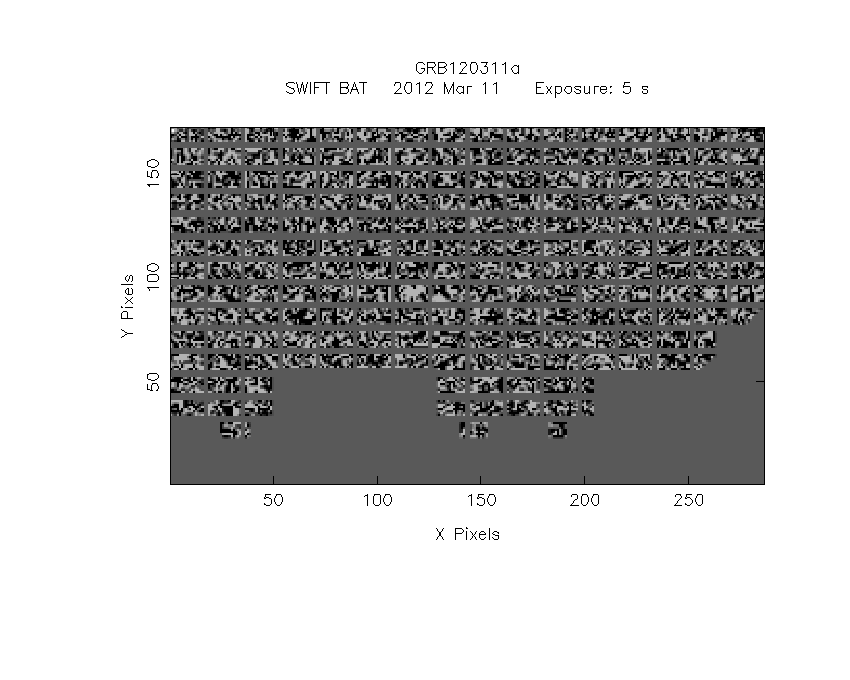
IMX = 2.256228773123946E-01, IMY = -3.133946757620175E-01
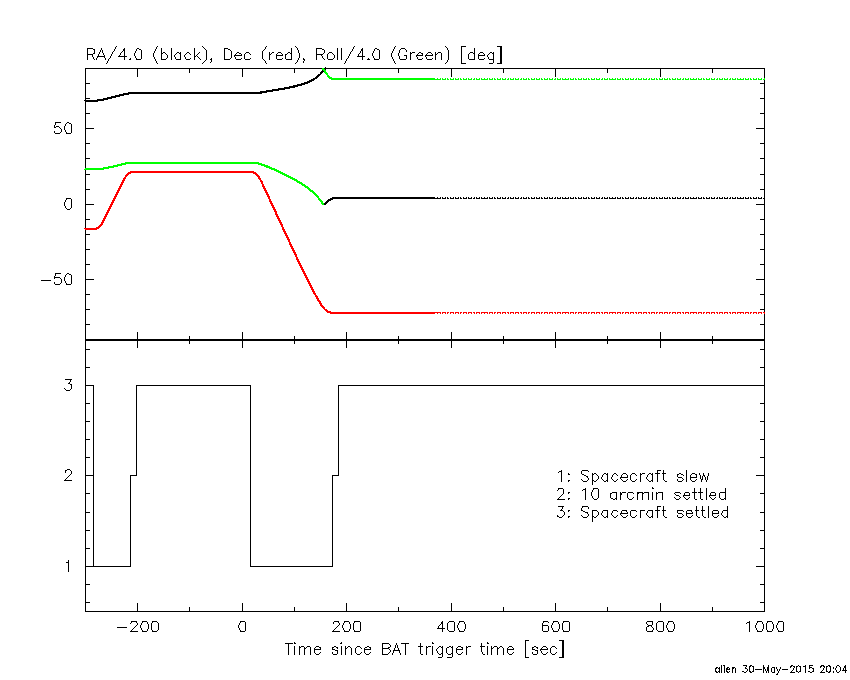
Spacecraft aspect plot
Bright source in the pre-burst/pre-slew/post-slew images
Pre-burst image of 15-350 keV band
Time interval of the image:
-213.003410 -1.376000

# RAcent  DECcent POSerr Theta    Phi  PeakCts   SNR AngSep     Name
#  [deg]    [deg]    ['] [deg]  [deg]                   [']
254.2679  35.2157    0.0  37.4  100.7  -0.9559  -2.1   12.0	Her X-1
263.0190 -24.7624    7.5  55.0   14.9  -1.4704  -1.5    1.1	GX 1+4
268.4445  -1.6141    3.4  33.9   30.8   0.7566   3.4   10.7	SW J1753.5-0127
270.2936 -25.0673    7.6  51.8    7.7   0.7490   1.5    0.9	GX 5-1
270.2057 -25.7514    3.6  52.4    7.4  -1.5985  -3.1    5.3	GRS 1758-258
273.9347 -13.8500    0.0  40.3   11.1  -0.2765  -1.0   11.9	GX 17+2
275.9884 -30.4635    5.4  54.6   -0.8   1.1803   2.1    6.7	H1820-303
284.8979 -24.9464    8.2  47.1   -8.6   0.4412   1.4    7.7	HT1900.1-2455
288.7939  10.9539    0.6  11.5    6.8   3.0394  19.0    0.6	GRS 1915+105
299.5945  35.1993    0.5  14.8  178.2   3.5428  22.6    0.2	Cyg X-1
308.0536  40.9868    1.0  23.0 -172.1   1.9899  11.4    3.3	Cyg X-3
326.0108  38.3713    8.2  32.3 -149.0   0.2851   1.4    8.1	Cyg X-2
257.6417   1.8935    2.2  40.4   46.3   2.0177   5.2 ------	UNKNOWN
335.8714  69.2453    2.9  54.2  177.0   2.3759   4.0 ------	UNKNOWN
301.1382 -35.9161    2.6  57.6  -26.8   4.5134   4.5 ------	UNKNOWN
Pre-slew background subtracted image of 15-350 keV band
Time interval of the image:
-1.376000 3.228000

# RAcent  DECcent POSerr Theta    Phi  PeakCts   SNR AngSep     Name
#  [deg]    [deg]    ['] [deg]  [deg]                   [']
254.5222  35.4194    5.3  37.2  101.1   0.1456   2.2    5.6	Her X-1
262.9398 -24.7226    7.1  55.0   15.0   0.2222   1.6    4.0	GX 1+4
268.3288  -1.4560   15.7  33.9   31.1   0.0274   0.7    2.4	SW J1753.5-0127
270.3614 -25.1565    4.3  51.8    7.6   0.1882   2.7    6.3	GX 5-1
270.4018 -25.6309    7.1  52.2    7.3   0.1193   1.6    8.6	GRS 1758-258
274.0671 -13.8998    7.9  40.3   10.9  -0.0512  -1.5    8.9	GX 17+2
276.0262 -30.3837    7.5  54.5   -0.8   0.1295   1.5    5.3	H1820-303
284.8714 -25.0297    5.1  47.1   -8.6   0.1018   2.3   11.1	HT1900.1-2455
288.6139  10.8664    4.4  11.6    7.5  -0.0540  -2.6   11.9	GRS 1915+105
299.4882  35.3784    4.5  14.9  177.6   0.0550   2.5   11.7	Cyg X-1
308.2946  41.0482   54.2  23.2 -171.8   0.0051   0.2   10.1	Cyg X-3
326.1654  38.1989    7.8  32.4 -148.7   0.0421   1.5    7.4	Cyg X-2
267.6455  12.0441    3.1  26.9   54.2   0.1185   3.8 ------	UNKNOWN
273.0751  14.2966    0.5  21.1   54.2   0.6593  25.7 ------	UNKNOWN
Post-slew image of 15-350 keV band
Time interval of the image:
172.796610 962.737000

# RAcent  DECcent POSerr Theta    Phi  PeakCts   SNR AngSep     Name
#  [deg]    [deg]    ['] [deg]  [deg]                   [']
264.7465 -44.4502   20.3  54.1  174.1   0.8894   0.6    0.2	4U 1735-44
340.7290 -71.9245    3.0  10.8 -167.5   1.5225   3.8 ------	UNKNOWN
 57.8012 -41.8056    2.9  36.3   -4.2   2.0560   3.9 ------	UNKNOWN
 47.4408 -28.8214    2.2  46.4  -22.0   4.0813   5.2 ------	UNKNOWN
  9.9157 -29.7487    3.9  42.4  -69.0   6.7583   3.0 ------	UNKNOWN
320.5897 -33.3836    3.0  48.0 -128.9   7.0303   3.8 ------	UNKNOWN