Analysis Summary
Notes:
- 1) No attempt has been made to eliminate the non-significant decimal places.
- 2) This batgrbproduct analysis is done using the HEASARC data.
- 3) This batgrbproduct analysis is using the flight position for the mask-weighting calculation.
======================================================================
                  BAT GRB EVENT DATA PROCESSING REPORT
    Process Script Ver: batgrbproduct v2.46
    Process Start Time: Mon Jan 13 05:39:08 EST 2014
             Host Name: batevent1
   Current Working Dir: /local/data/batevent/batevent_reproc/trigger517489
======================================================================

  Trigger: 00517489      Segment: 000

  BAT Trigger Time: 353171298.816   [s; MET]
      Trigger Stop: 353171299.84   [s; MET]
               UTC: 2012-03-11T15:08:10.834740    [includes UTCF correction]
       Where From?: TDRSS position message

  BAT
    RA: 258.501429204094   Dec: -13.0597932121755  [deg; J2000]

     Catalogged Source?: NO
     Point Source?:      YES
     GRB Indicated?:     YES    [ by BAT flight software ]
     Image S/N Ratio:    7.22
     Image Trigger?:     NO
     Rate S/N Ratio:     16.1864140562386  [ if not an image trigger ]
     Image S/N Ratio:    7.22

  Analysis Position:   [ source = BAT ]
    RA: 258.501429204094   Dec: -13.0597932121755  [deg; J2000]

  Refined Position:   [ source = BAT pre-slew burst ]
    RA: 258.551351570023   Dec: -13.0627598169576  [deg; J2000]
        { 17h 14m 12.3s , -13d 03' 45.9" }
         +/- 1.27920857204349 [arcmin] (estimated 90% radius based on SNR)
         +/- 0.621428473204472 [arcmin] (formal 1-sigma fit error)
    SNR: 21.3966117922561

  Angular difference between the analysis and refined position is 2.923273 arcmin

  Partial Coding Fraction: 0.625    [ including projection effects ]

  Duration
     T90: 29.6879999637604 +/- 6.02357236760383
        Measured from: -9.87199997901917
                   to: 19.8159999847412     [s; relative to TRIGTIME]
     T50: 12.5079999566078 +/- 1.37930995620285
        Measured from: -1.72799998521805
                   to: 10.7799999713898     [s; relative to TRIGTIME]


  Fluence
     Peak Flux  (peak 1 second)
        Measured from: 9.0440000295639
                   to: 10.0440000295639     [s; relative to TRIGTIME]
     Total Fluence
        Measured from: -15.0439999699593
                   to: 22.6520000100136     [s; relative to TRIGTIME]

             Band 1     Band 2     Band 3     Band 4
              15-25      25-50     50-100    100-350     keV
 Total     0.676005   0.755398   0.365582   0.073663
           0.046794   0.045988   0.038850   0.036621 [error]
 Peak      0.061129   0.078966   0.023972   0.001721
           0.008220   0.008458   0.006757   0.006100 [error]

     [ fluence units of on-axis counts / fully illuminated detector ]

======================================================================


====== Table of the duration information =============================

        Value   tstart    tstop
T100   37.696  -15.044   22.652
T90    29.688   -9.872   19.816
T50    12.508   -1.728   10.780
Peak    1.000    9.044   10.044


====== Spectral Analysis Summary =====================================

Model      : spectral model: simple power-law (PL) and cutoff power-law (CPL)
Ph_index   : photon index: E^{Ph_index}
Ph_90err   : 90% error of the photon index
Epeak      : Epeak in keV
Epeak_90err: 90% error of Epeak
Norm       : normalization at 50 keV in both the PL model and CPL model
Nomr_90err : 90% error of the normalization
chi2       : Chi-Squared
dof        : degree of freedo

=== Time-averaged spectral analysis ===
(Best model with acceptable fit: PL)

Model Ph_index Ph_90err_low Ph_90err_hi  Epeak  Epeak_90err_low  Epeak_90err_hi  Norm       Nomr_90err_low    Norm_90err_hi    chi2    dof
PL      -1.943    -0.136      0.133       -           -               -         3.00e-03     -2.61e-04          2.58e-04      60.720   57
CPL     -1.243    -0.594      0.712       44.923     -10.239        27.259      7.61e-03     -4.10e-03          1.21e-02      56.600   56


=== 1-s peak spectral analysis ===
(Best model with acceptable fit: N/A)

Model Ph_index Ph_90err_low Ph_90err_hi  Epeak  Epeak_90err_low  Epeak_90err_hi  Norm       Nomr_90err_low    Norm_90err_hi    chi2    dof
PL      -2.120     -0.250     0.231       -           -               -         9.15e-03     -1.69e-03          1.66e-03      81.100   57
CPL      1.020     -1.554     2.107       37.016      -4.995         5.369      7.13e-01     -7.13e-01          1.24e+01      66.170   56


=== Fluence/Peak Flux Summary ===

              Model    Band1     Band2     Band3     Band4     Band5     Total
                       15-25     25-50    50-100    100-350    15-150    15-350    keV
Fluence         PL   2.19e-07  3.08e-07  3.20e-07  6.12e-07  1.04e-06  1.46e-06   erg/cm2
      90%_error_low -2.35e-08 -2.24e-08 -3.77e-08 -1.33e-07 -8.73e-08 -1.75e-07   erg/cm2
      90%_error_hi   2.41e-08  2.24e-08  3.81e-08  1.57e-07  8.85e-08  1.93e-07   erg/cm2
Peak flux       PL   6.85e-01  4.79e-01  2.20e-01  1.42e-01  1.45e+00  1.53e+00   ph/cm2/s
      90%_error_low -1.23e-01 -6.88e-02 -5.09e-02 -5.22e-02 -2.06e-01 -2.18e-01   ph/cm2/s
      90%_error_hi   1.27e-01  6.87e-02  5.26e-02  6.77e-02  2.06e-01  2.18e-01   ph/cm2/s

Fluence        CPL   2.27e-07  3.10e-07  3.18e-07  7.46e-07  1.05e-06  1.50e-06   erg/cm2
      90%_error_low -2.49e-08 -7.50e-09 -5.67e-08 -6.70e-07 -1.87e-07 -6.15e-07   erg/cm2
      90%_error_hi   2.40e-08  5.58e-08  3.42e-08  -2.49e-07  2.48e-08  -1.38e-07   erg/cm2
Peak flux      CPL   5.43e-01  6.60e-01  1.79e-01  5.60e-03  1.39e+00  1.39e+00   ph/cm2/s
      90%_error_low -1.51e-01 -1.07e-01 -6.57e-02 -5.60e-03 -2.04e-01 -2.04e-01   ph/cm2/s
      90%_error_hi   1.52e-01  1.10e-01  6.97e-02  2.05e-02  2.05e-01  2.05e-01   ph/cm2/s

======================================================================
Image
Pre-slew 15.0-350.0 keV image (Event data)
#   RAcent    DECcent   POSerr    Theta     Phi              Peak Cts       SNR   Name
  258.5514   -13.0628   0.0090    30.8863    22.3375         2.2051270     21.397 TRIG_00517489

Foreground time interval of the image:
-15.044  22.652 (delta_t =  37.696 [sec])
Background time interval of the image:
-239.816 -15.044 (delta_t = 224.772 [sec])
Light Curves
Note: The mask-weighted lightcurves have units of either count/det or counts/sec/det, where a det is 0.4 x 0.4 = 0.16 sq cm.
Full-time range; 1 s binning
Other quick-look light curves:
- 64 ms binning (zoomed)
- 16 ms binning (zoomed)
- 8 ms binning (zoomed)
- 2 ms binning (zoomed)
- SN=5 or 10 s binning (full-time range)
- Raw light curve
Spectra
- 64 ms binning (zoomed)
- 16 ms binning (zoomed)
- 8 ms binning (zoomed)
- 2 ms binning (zoomed)
- SN=5 or 10 s binning (full-time range)
- Raw light curve
Spectra
Notes:
- 1) The fitting includes the systematic errors.
- 2) When the burst includes telescope slew time periods, the fitting uses an average response file made from multiple 5-s response files through out the slew time plus single time preiod for the non-slew times, and weighted by the total counts in the corresponding time period using addrmf. An average response file is needed becuase a spectral fit using the pre-slew DRM will introduce some errors in both a spectral shape and a normalization if the PHA file contains a lot of the slew/post-slew time interval.
- 3) For fits to more complicated models (e.g. a power-law over a cutoff power-law), the BAT team has decided to require a chi-square improvement of more than 6 for each extra dof.
Time averaged spectrum fit using the average DRM
Power-law model
Time interval is from  -15.044 sec. to   22.652 sec.

Spectral model in power-law:
------------------------------------------------------------
Parameters  : value       lower 90%   higher 90%
Photon index: -1.94277     ( -0.136329   0.132806 )
Norm@50keV  : 3.00077E-03    ( -0.000261146   0.000257783 )
------------------------------------------------------------
#Fit statistic : Chi-Squared =          60.72 using 59 PHA bins.
# Reduced chi-squared =          1.065 for     57 degrees of freedom
# Null hypothesis probability =   3.432357e-01

Photon flux (15-150 keV)    in 37.7 sec: 0.438706 ( -0.032441  0.032467 ) ph/cm2/s
Energy fluence (15-150 keV)             : 1.04105e-06 ( -8.73268e-08  8.84657e-08 ) ergs/cm2
Cutoff power-law model
Time interval is from  -15.044 sec. to   22.652 sec.
Spectral model in the cutoff power-law:
------------------------------------------------------------
Parameters  : value       lower 90%   higher 90%
Photon index: -1.24279     ( -0.594505   0.712118 )
Epeak [keV] : 44.9231      ( -10.2382 27.2602 )
Norm@50keV  : 7.60974E-03    ( -0.00410222   0.0121207 )
------------------------------------------------------------
#Fit statistic : Chi-Squared =          56.60 using 59 PHA bins.
# Reduced chi-squared =          1.011 for     56 degrees of freedom
# Null hypothesis probability =   4.525474e-01

Photon flux (15-150 keV)    in 37.7 sec: 0.425958 ( -0.034159  0.03415 ) ph/cm2/s
Energy fluence (15-150 keV)             : 1.04747e-06 ( -1.86987e-07  2.4795e-08 ) ergs/cm2
1-s peak spectrum fit
Power-law model
Time interval is from    9.044 sec. to   10.044 sec.

Spectral model in power-law:
------------------------------------------------------------
Parameters  : value       lower 90%   higher 90%
Photon index: -2.11979     ( -0.249563   0.231661 )
Norm@50keV  : 9.14607E-03    ( -0.00168764   0.00166096 )
------------------------------------------------------------
#Fit statistic : Chi-Squared =          81.10 using 59 PHA bins.
# Reduced chi-squared =          1.423 for     57 degrees of freedom
# Null hypothesis probability =   1.966278e-02

Photon flux (15-150 keV)    in 1 sec: 1.45327 ( -0.2059  0.2059 ) ph/cm2/s
Energy fluence (15-150 keV)             : 8.51452e-08 ( -1.41269e-08  1.44871e-08 ) ergs/cm2
Cutoff power-law model
Time interval is from    9.044 sec. to   10.044 sec.
Spectral model in the cutoff power-law:
------------------------------------------------------------
Parameters  : value       lower 90%   higher 90%
Photon index: 1.0198     ( -1.57053   2.09099 )
Epeak [keV] : 37.0162      ( -5.00493 5.35989 )
Norm@50keV  : 0.712559    ( -0.737601   12.4089 )
------------------------------------------------------------
#Fit statistic : Chi-Squared =          66.17 using 59 PHA bins.
# Reduced chi-squared =          1.182 for     56 degrees of freedom
# Null hypothesis probability =   1.658287e-01

Photon flux (15-150 keV)    in 1 sec: 1.38705 ( -0.20363  0.20486 ) ph/cm2/s
Energy fluence (15-150 keV)             : 7.30887e-08 ( -1.1503e-08  1.25658e-08 ) ergs/cm2
Time-resolved spectra

Distribution
T90 vs. Hardness ratio plot
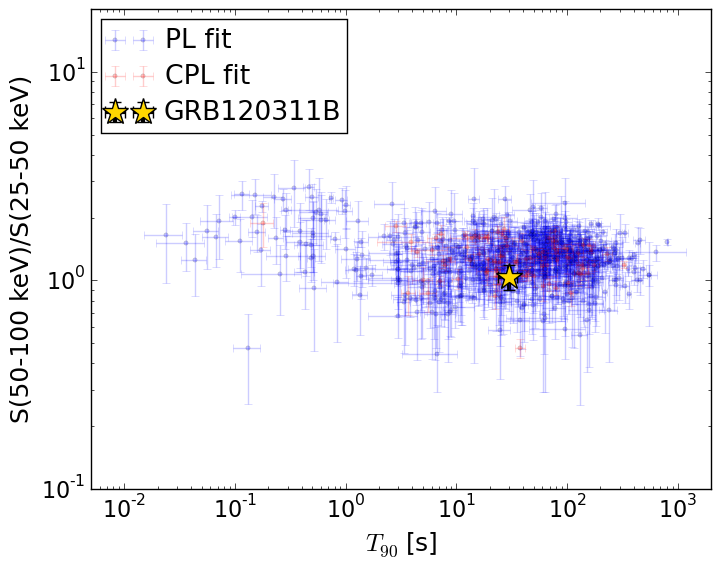
T90                                   = 29.688 sec.
Hardness ratio (energy fluence ratio) = 1.04049510506
S(15-50 keV) vs. S(50-150 keV) plot
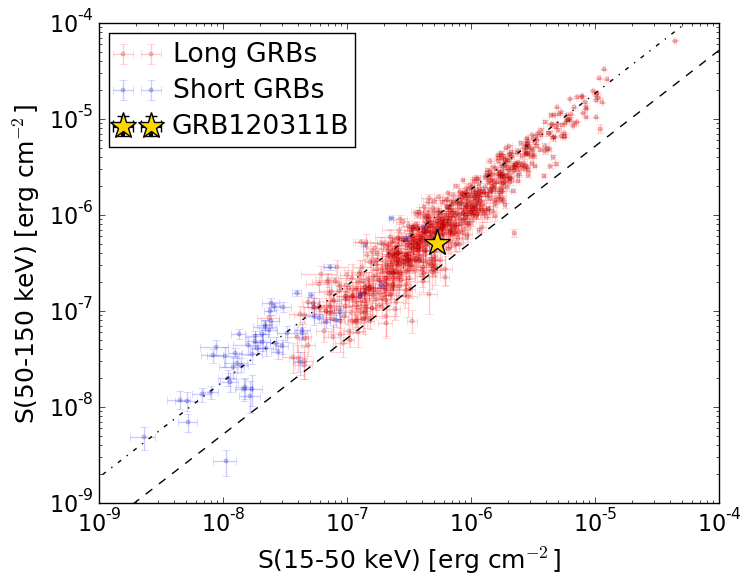
S(15-50 keV)  = 5.272269e-07
S(50-150 keV) = 5.138324e-07
The dash-dotted line and the dashed line traces the fluences calculated from the Band function with Epeak = 15 and 150 keV, respectively. Both lines assume a canonical values of alpha = -1 and beta = -2.5.
Mask shadow pattern
IMX = 5.532775281390634E-01, IMY = -2.273382655302791E-01
Spacecraft aspect plot
Bright source in the pre-burst/pre-slew/post-slew images
Pre-burst image of 15-350 keV band
Time interval of the image:
-239.816000 -15.044000

# RAcent  DECcent POSerr Theta    Phi  PeakCts   SNR AngSep     Name
#  [deg]    [deg]    ['] [deg]  [deg]                   [']
244.9693 -15.6322    0.7  40.8   37.9   6.1554  15.7    0.8	Sco X-1
254.6096  35.3674    5.9  26.8  139.1  -0.4796  -2.0    7.6	Her X-1
255.8701 -37.8858    4.9  54.6   10.6   1.9943   2.3    6.1	4U 1700-377
256.4067 -36.3787    5.7  53.0   10.7  -1.2861  -2.0    3.0	GX 349+2
262.9767 -24.5905   85.8  40.1    8.3   0.0385   0.1    9.5	GX 1+4
268.3781  -1.4277    2.9  16.4   10.8   0.7008   4.0    1.6	SW J1753.5-0127
270.2842 -25.0792    3.6  39.4   -2.1   0.9395   3.2    0.0	GX 5-1
270.3025 -25.7431  171.9  40.1   -2.2   0.0195   0.1    0.0	GRS 1758-258
274.1493 -13.9909    6.8  28.3   -8.3   0.3481   1.7    8.8	GX 17+2
276.0460 -30.3427    3.6  44.7   -9.7   1.0010   3.2    6.4	H1820-303
284.9327 -25.0661    4.0  41.0  -22.6   0.8302   2.9   10.4	HT1900.1-2455
288.7855  10.9316    0.9  15.7  -85.6   2.5425  12.7    1.1	GRS 1915+105
299.5782  35.2047    1.0  31.7 -142.1   2.8274  11.6    0.6	Cyg X-1
308.0980  40.9649    2.1  40.5 -144.1   1.7967   5.5    0.9	Cyg X-3
262.8928 -33.8513   28.9  49.1    5.1   0.1572   0.4    4.9	GX 354-0
236.5008 -15.4829    2.9  46.8   45.9   2.8829   3.9 ------	UNKNOWN
256.4465  55.8281    2.8  43.5  160.4   1.6538   4.1 ------	UNKNOWN
Pre-slew background subtracted image of 15-350 keV band
Time interval of the image:
-15.044000 22.652000

# RAcent  DECcent POSerr Theta    Phi  PeakCts   SNR AngSep     Name
#  [deg]    [deg]    ['] [deg]  [deg]                   [']
245.0084 -15.6814   11.5  40.8   37.8  -0.1783  -1.0    3.0	Sco X-1
254.6352  35.4993    0.0  26.9  139.3  -0.0587  -0.5   12.8	Her X-1
255.9492 -37.7281   24.3  54.4   10.6   0.1892   0.5    7.2	4U 1700-377
256.4711 -36.4561   10.3  53.1   10.6   0.3687   1.1    2.6	GX 349+2
262.9379 -24.6112   14.0  40.1    8.3   0.0997   0.8    8.9	GX 1+4
268.4980  -1.6168    0.0  16.5   10.2   0.0982   1.2   12.6	SW J1753.5-0127
270.4262 -24.9822   15.5  39.3   -2.3  -0.0861  -0.7    9.7	GX 5-1
270.2647 -25.5888    4.2  40.0   -2.1  -0.3132  -2.7    9.5	GRS 1758-258
274.0431 -13.9864    7.8  28.3   -8.1   0.1273   1.5    3.7	GX 17+2
276.0344 -30.4574   10.9  44.8   -9.7  -0.1410  -1.1    7.8	H1820-303
285.1272 -25.0463    3.9  41.0  -22.8   0.3594   2.9    9.0	HT1900.1-2455
288.8144  11.0639    8.4  15.7  -86.1   0.1182   1.4    7.2	GRS 1915+105
299.5112  35.1829    4.8  31.7 -142.1   0.2434   2.4    4.0	Cyg X-1
307.9600  41.0211   41.6  40.4 -144.3   0.0387   0.3    7.9	Cyg X-3
263.0393 -33.7703   17.6  49.0    5.0   0.1183   0.7    4.6	GX 354-0
231.4212  41.9588    1.9  45.3  129.9   2.1840   6.0 ------	UNKNOWN
258.5514 -13.0628    0.5  30.9   22.3   2.2048  21.4 ------	UNKNOWN
Post-slew image of 15-350 keV band
Time interval of the image:
327.084600 482.219300

# RAcent  DECcent POSerr Theta    Phi  PeakCts   SNR AngSep     Name
#  [deg]    [deg]    ['] [deg]  [deg]                   [']
 64.1892 -12.8792    2.3  25.0  110.7   3.0518   5.1 ------	UNKNOWN
 58.9263  23.3520    2.6  33.7   32.7   3.0313   4.4 ------	UNKNOWN
 48.3766   6.0367    2.5  13.7   37.4   2.1459   4.7 ------	UNKNOWN
  3.5471  39.6226    2.5  55.9  -33.1  12.2697   4.6 ------	UNKNOWN