Analysis Summary
Notes:
- 1) No attempt has been made to eliminate the non-significant decimal places.
- 2) This batgrbproduct analysis is done using the HEASARC data.
- 3) This batgrbproduct analysis is using the flight position for the mask-weighting calculation.
======================================================================
                  BAT GRB EVENT DATA PROCESSING REPORT
    Process Script Ver: batgrbproduct v2.46
    Process Start Time: Mon Jan 13 05:22:42 EST 2014
             Host Name: batevent1
   Current Working Dir: /local/data/batevent/batevent_reproc/trigger518507
======================================================================

  Trigger: 00518507      Segment: 000

  BAT Trigger Time: 354261559.36   [s; MET]
      Trigger Stop: 354261560.384   [s; MET]
               UTC: 2012-03-24T05:59:11.334480    [includes UTCF correction]
       Where From?: TDRSS position message

  BAT
    RA: 291.084059291849   Dec: 24.1452774141341  [deg; J2000]

     Catalogged Source?: NO
     Point Source?:      YES
     GRB Indicated?:     YES    [ by BAT flight software ]
     Image S/N Ratio:    19.05
     Image Trigger?:     NO
     Rate S/N Ratio:     89.9388681271896  [ if not an image trigger ]
     Image S/N Ratio:    19.05

  Analysis Position:   [ source = BAT ]
    RA: 291.084059291849   Dec: 24.1452774141341  [deg; J2000]

  Refined Position:   [ source = BAT pre-slew burst ]
    RA: 291.080478623267   Dec: 24.1397177760819  [deg; J2000]
        { 19h 24m 19.3s , +24d 08' 23.0" }
         +/- 1.09968692335447 [arcmin] (estimated 90% radius based on SNR)
         +/- 0.445113850140597 [arcmin] (formal 1-sigma fit error)
    SNR: 26.5559950405019

  Angular difference between the analysis and refined position is 0.386923 arcmin

  Partial Coding Fraction: 0.8203125    [ including projection effects ]

  Duration
     T90: 118.423999965191 +/- 10.0100150231936
        Measured from: -42.1680000424385
                   to: 76.2559999227524     [s; relative to TRIGTIME]
     T50: 30.8319999575615 +/- 0.719510923285473
        Measured from: 3.91200000047684
                   to: 34.7439999580383     [s; relative to TRIGTIME]


  Fluence
     Peak Flux  (peak 1 second)
        Measured from: 33.6759999990463
                   to: 34.6759999990463     [s; relative to TRIGTIME]
     Total Fluence
        Measured from: -150.512000024319
                   to: 142.455999970436     [s; relative to TRIGTIME]

             Band 1     Band 2     Band 3     Band 4
              15-25      25-50     50-100    100-350     keV
 Total     3.707915   5.340255   4.723777   1.480314
           0.105615   0.102871   0.088676   0.073665 [error]
 Peak      0.144101   0.248482   0.258281   0.076070
           0.007649   0.008728   0.008697   0.006033 [error]

     [ fluence units of on-axis counts / fully illuminated detector ]

======================================================================


====== Table of the duration information =============================

        Value   tstart    tstop
T100  292.968 -150.512  142.456
T90   118.424  -42.168   76.256
T50    30.832    3.912   34.744
Peak    1.000   33.676   34.676


====== Spectral Analysis Summary =====================================

Model      : spectral model: simple power-law (PL) and cutoff power-law (CPL)
Ph_index   : photon index: E^{Ph_index}
Ph_90err   : 90% error of the photon index
Epeak      : Epeak in keV
Epeak_90err: 90% error of Epeak
Norm       : normalization at 50 keV in both the PL model and CPL model
Nomr_90err : 90% error of the normalization
chi2       : Chi-Squared
dof        : degree of freedo

=== Time-averaged spectral analysis ===
(Best model with acceptable fit: PL)

Model Ph_index Ph_90err_low Ph_90err_hi  Epeak  Epeak_90err_low  Epeak_90err_hi  Norm       Nomr_90err_low    Norm_90err_hi    chi2    dof
PL      -1.312    -0.045      0.045       -           -               -         3.48e-03     -8.06e-05          8.05e-05      43.020   57
CPL     -1.308    -0.045      0.086     9998.450    -9998.450      -9998.450      3.49e-03     -7.82e-05          4.13e-04      43.080   56


=== 1-s peak spectral analysis ===
(Best model with acceptable fit: PL)

Model Ph_index Ph_90err_low Ph_90err_hi  Epeak  Epeak_90err_low  Epeak_90err_hi  Norm       Nomr_90err_low    Norm_90err_hi    chi2    dof
PL      -1.126     -0.067     0.067       -           -               -         4.94e-02     -1.85e-03          1.85e-03      56.780   57
CPL     -1.000     -0.156     0.263      457.640    -457.640      -457.640      5.62e-02     -8.12e-03          1.67e-02      56.040   56


=== Fluence/Peak Flux Summary ===

              Model    Band1     Band2     Band3     Band4     Band5     Total
                       15-25     25-50    50-100    100-350    15-150    15-350    keV
Fluence         PL   1.09e-06  2.25e-06  3.62e-06  1.31e-05  1.00e-05  2.00e-05   erg/cm2
      90%_error_low -5.58e-08 -6.66e-08 -9.33e-08 -8.00e-07 -2.35e-07 -8.31e-07   erg/cm2
      90%_error_hi   5.70e-08  6.64e-08  9.30e-08  8.38e-07  2.36e-07  8.62e-07   erg/cm2
Peak flux       PL   1.42e+00  1.79e+00  1.64e+00  2.62e+00  5.75e+00  7.48e+00   ph/cm2/s
      90%_error_low -1.08e-01 -8.28e-02 -6.93e-02 -2.35e-01 -2.23e-01 -2.98e-01   ph/cm2/s
      90%_error_hi   1.11e-01  8.24e-02  6.90e-02  2.49e-01  2.23e-01  3.01e-01   ph/cm2/s

Fluence        CPL   1.10e-06  2.24e-06  3.60e-06  1.30e-05  1.01e-05  2.08e-05   erg/cm2
      90%_error_low    N/A    -6.26e-08    N/A       N/A       N/A    -2.81e-06   erg/cm2
      90%_error_hi     N/A     7.04e-08    N/A       N/A       N/A     -4.62e-07   erg/cm2
Peak flux      CPL   9.53e-01  7.16e-01  3.76e-01  3.42e-01  2.18e+00  2.39e+00   ph/cm2/s
      90%_error_low -1.11e-01 -1.04e-01 -3.09e-02 -5.09e-02 -2.93e-01 -2.45e-01   ph/cm2/s
      90%_error_hi   1.27e-01  6.59e-02  1.92e-02  4.41e-02  1.83e-01  1.50e-01   ph/cm2/s

======================================================================
Image
Pre-slew 15.0-350.0 keV image (Event data)
#   RAcent    DECcent   POSerr    Theta     Phi              Peak Cts       SNR   Name
  291.0805    24.1397   0.0072    30.9195  -160.9503         6.3875123     26.556 TRIG_00518507

Foreground time interval of the image:
-150.512  12.941 (delta_t = 163.453 [sec])
Background time interval of the image:
-239.360 -150.512 (delta_t =  88.848 [sec])
Light Curves
Note: The mask-weighted lightcurves have units of either count/det or counts/sec/det, where a det is 0.4 x 0.4 = 0.16 sq cm.
Full-time range; 1 s binning
Other quick-look light curves:
- 64 ms binning (zoomed)
- 16 ms binning (zoomed)
- 8 ms binning (zoomed)
- 2 ms binning (zoomed)
- SN=5 or 10 s binning (full-time range)
- Raw light curve
Spectra
- 64 ms binning (zoomed)
- 16 ms binning (zoomed)
- 8 ms binning (zoomed)
- 2 ms binning (zoomed)
- SN=5 or 10 s binning (full-time range)
- Raw light curve
Spectra
Notes:
- 1) The fitting includes the systematic errors.
- 2) When the burst includes telescope slew time periods, the fitting uses an average response file made from multiple 5-s response files through out the slew time plus single time preiod for the non-slew times, and weighted by the total counts in the corresponding time period using addrmf. An average response file is needed becuase a spectral fit using the pre-slew DRM will introduce some errors in both a spectral shape and a normalization if the PHA file contains a lot of the slew/post-slew time interval.
- 3) For fits to more complicated models (e.g. a power-law over a cutoff power-law), the BAT team has decided to require a chi-square improvement of more than 6 for each extra dof.
Time averaged spectrum fit using the average DRM
Power-law model

Time interval is from -150.512 sec. to  142.456 sec.

Spectral model in power-law:
------------------------------------------------------------
Parameters  : value       lower 90%   higher 90%
Photon index: -1.31194     ( -0.0447148   0.0448914 )
Norm@50keV  : 3.47520E-03    ( -8.06226e-05   8.04914e-05 )
------------------------------------------------------------
#Fit statistic : Chi-Squared =          43.02 using 59 PHA bins.
# Reduced chi-squared =         0.7548 for     57 degrees of freedom
# Null hypothesis probability =   9.147888e-01

Photon flux (15-150 keV)    in 293 sec: 0.415531 ( -0.010879  0.01094 ) ph/cm2/s
Energy fluence (15-150 keV)             : 1.00341e-05 ( -2.35397e-07  2.35855e-07 ) ergs/cm2
Cutoff power-law model
Time interval is from -150.512 sec. to  142.456 sec.
Spectral model in the cutoff power-law:
------------------------------------------------------------
Parameters  : value       lower 90%   higher 90%
Photon index: -1.30831     ( -0.0446366   0.0860053 )
Epeak [keV] : 9998.45      ( -9998.73 -9998.73 )
Norm@50keV  : 3.48777E-03    ( -7.98153e-05   0.000411127 )
------------------------------------------------------------
#Fit statistic : Chi-Squared =          43.08 using 59 PHA bins.
# Reduced chi-squared =         0.7692 for     56 degrees of freedom
# Null hypothesis probability =   8.972202e-01

Photon flux (15-150 keV)    in 293 sec: 0.417582 ( -0.012861  0.00851 ) ph/cm2/s
Energy fluence (15-150 keV)             : 1.00683e-05 ( 0  0 ) ergs/cm2
1-s peak spectrum fit
Power-law model
Time interval is from   33.676 sec. to   34.676 sec.

Spectral model in power-law:
------------------------------------------------------------
Parameters  : value       lower 90%   higher 90%
Photon index: -1.12602     ( -0.0672086   0.0674519 )
Norm@50keV  : 4.94254E-02    ( -0.00185366   0.00185263 )
------------------------------------------------------------
#Fit statistic : Chi-Squared =          56.78 using 59 PHA bins.
# Reduced chi-squared =         0.9961 for     57 degrees of freedom
# Null hypothesis probability =   4.834575e-01

Photon flux (15-150 keV)    in 1 sec: 5.74834 ( -0.22313  0.22337 ) ph/cm2/s
Energy fluence (15-150 keV)             : 5.12602e-07 ( -2.10834e-08  2.11383e-08 ) ergs/cm2
Cutoff power-law model
Time interval is from   33.676 sec. to   34.676 sec.
Spectral model in the cutoff power-law:
------------------------------------------------------------
Parameters  : value       lower 90%   higher 90%
Photon index: -0.999772     ( -0.15649   0.262716 )
Epeak [keV] : 457.640      ( -457.64 -457.64 )
Norm@50keV  : 5.62436E-02    ( -0.00812457   0.0167264 )
------------------------------------------------------------
#Fit statistic : Chi-Squared =          56.04 using 59 PHA bins.
# Reduced chi-squared =          1.001 for     56 degrees of freedom
# Null hypothesis probability =   4.733915e-01

Photon flux (15-150 keV)    in 1 sec: 2.18282 ( -0.29288  0.18276 ) ph/cm2/s
Energy fluence (15-150 keV)             : 5.09753e-07 ( -2.19775e-08  2.19021e-08 ) ergs/cm2
Time-resolved spectra
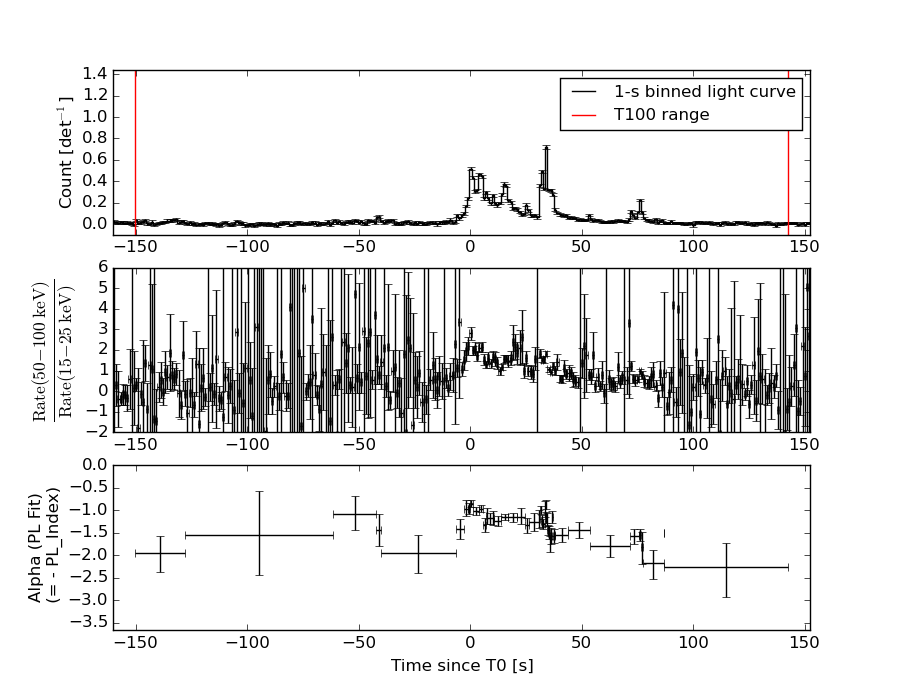
Distribution
T90 vs. Hardness ratio plot
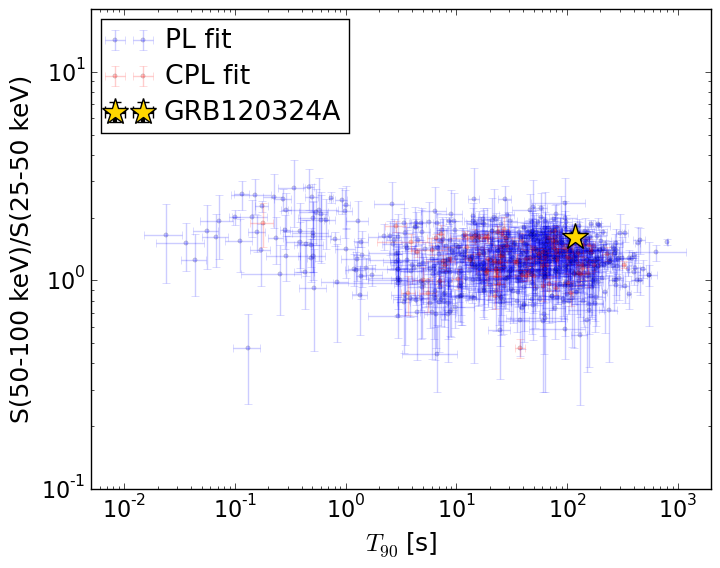
T90                                   = 118.424 sec.
Hardness ratio (energy fluence ratio) = 1.61116524912
S(15-50 keV) vs. S(50-150 keV) plot
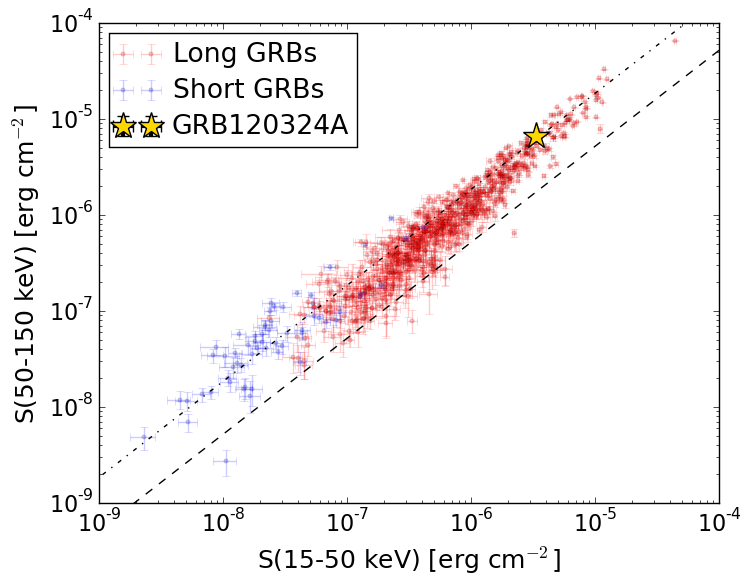
S(15-50 keV)  = 3.338748e-06
S(50-150 keV) = 6.69546e-06
The dash-dotted line and the dashed line traces the fluences calculated from the Band function with Epeak = 15 and 150 keV, respectively. Both lines assume a canonical values of alpha = -1 and beta = -2.5.
Mask shadow pattern
IMX = -5.661482109179601E-01, IMY = 1.954902831321166E-01
Spacecraft aspect plot
Bright source in the pre-burst/pre-slew/post-slew images
Pre-burst image of 15-350 keV band
Time interval of the image:
-239.360000 -150.512000

# RAcent  DECcent POSerr Theta    Phi  PeakCts   SNR AngSep     Name
#  [deg]    [deg]    ['] [deg]  [deg]                   [']
244.9733 -15.6184    0.9  36.3   70.0   3.4218  12.4    1.4	Sco X-1
254.3234  35.4573    0.0  47.2  150.6   0.5794   1.6    9.5	Her X-1
256.1182 -38.0210   23.8  39.7   30.1   0.0945   0.5   12.3	4U 1700-377
256.2779 -36.4100    5.7  38.4   31.6   0.3799   2.0    7.6	GX 349+2
263.1635 -24.7624    8.8  25.8   37.8   0.1597   1.3    8.5	GX 1+4
264.9033 -44.4757    5.9  41.8   16.3   0.3617   2.0    7.0	4U 1735-44
268.4627  -1.4531    4.5  12.4  105.8   0.2727   2.6    5.7	SW J1753.5-0127
270.2334 -25.0068    3.8  22.3   24.5   0.3346   3.0    5.1	GX 5-1
270.1618 -25.6756    3.4  22.9   23.9   0.3928   3.4    8.6	GRS 1758-258
274.0426 -14.0174    3.5  11.0   33.7   0.3182   3.4    2.4	GX 17+2
275.9253 -30.3702   90.0  25.8    8.5   0.0145   0.1    0.2	H1820-303
284.8809 -25.0743    0.0  20.6  -12.0  -0.1887  -1.7   12.5	HT1900.1-2455
288.7706  10.9576    1.0  18.0 -152.5   1.1705  11.6    1.8	GRS 1915+105
299.5331  35.2441    2.6  44.1 -157.6   0.8478   4.5    3.8	Cyg X-1
308.1080  40.8990    7.9  52.4 -153.9   0.4761   1.5    3.2	Cyg X-3
263.1397 -34.0047    0.0  33.1   26.4   0.0029   0.0   12.7	GX 354-0
240.8236   2.2938    2.3  40.1   99.2   2.1314   4.9 ------	UNKNOWN
248.2148  23.6080    2.5  42.4  133.4   1.5431   4.7 ------	UNKNOWN
295.9528 -57.8077    3.0  54.2  -10.4   1.1886   3.9 ------	UNKNOWN
321.7934 -17.9108    3.1  42.5  -69.0   1.7788   3.7 ------	UNKNOWN
Pre-slew background subtracted image of 15-350 keV band
Time interval of the image:
-150.512000 12.940600

# RAcent  DECcent POSerr Theta    Phi  PeakCts   SNR AngSep     Name
#  [deg]    [deg]    ['] [deg]  [deg]                   [']
245.0206 -15.6965   14.9  36.3   69.8  -0.4624  -0.8    4.1	Sco X-1
254.4777  35.3453   40.1  47.1  150.6   0.2060   0.3    1.0	Her X-1
256.1394 -37.9401   29.4  39.7   30.2  -0.1664  -0.4    9.2	4U 1700-377
256.2826 -36.3302   28.7  38.4   31.7  -0.1664  -0.4    9.2	GX 349+2
262.9707 -24.7986   15.5  25.9   38.0  -0.1925  -0.7    3.8	GX 1+4
264.8994 -44.5510    5.2  41.8   16.3  -0.9090  -2.2    9.0	4U 1735-44
268.2725  -1.5874    7.0  12.5  104.9  -0.4070  -1.7    9.9	SW J1753.5-0127
270.2103 -25.2069    5.0  22.5   24.3   0.5450   2.3    8.7	GX 5-1
270.4553 -25.8328   11.6  22.9   23.1   0.2393   1.0    9.9	GRS 1758-258
274.0738 -14.0665    5.0  11.0   33.4  -0.4660  -2.3    4.4	GX 17+2
275.8618 -30.3752    6.3  25.8    8.6   0.4313   1.8    3.3	H1820-303
284.8807 -25.0088   13.1  20.5  -12.1   0.1908   0.9   10.0	HT1900.1-2455
288.9454  10.9301    4.6  18.0 -152.0   0.5219   2.5    8.7	GRS 1915+105
299.4676  35.3569   21.0  44.1 -157.7  -0.2046  -0.5   11.1	Cyg X-1
308.2552  40.8744   10.9  52.5 -153.8   0.6997   1.1    8.1	Cyg X-3
262.9261 -33.8948    6.2  33.2   26.7   0.5879   1.9    4.8	GX 354-0
268.6866  10.5636    2.7  19.4  143.0   0.9835   4.3 ------	UNKNOWN
291.0805  24.1397    0.4  30.9 -161.0   6.3873  26.6 ------	UNKNOWN
294.7805  22.0183    2.9  30.5 -153.1   1.0227   4.1 ------	UNKNOWN
Post-slew image of 15-350 keV band
Time interval of the image:
64.140600 962.708300

# RAcent  DECcent POSerr Theta    Phi  PeakCts   SNR AngSep     Name
#  [deg]    [deg]    ['] [deg]  [deg]                   [']
254.2574  35.4271    0.0  33.7  112.6   2.7306   2.5   11.0	Her X-1
268.4002  -1.5016    2.3  33.8   38.3   3.7103   5.0    3.5	SW J1753.5-0127
270.3718 -25.0095   11.9  53.1   18.0  -2.2767  -1.0    6.3	GX 5-1
270.3762 -25.8753    7.8  53.9   17.6  -3.7970  -1.5    8.9	GRS 1758-258
274.1268 -14.0453    9.2  41.6   19.6   1.0660   1.3    7.1	GX 17+2
284.9972 -24.9469    6.3  49.4    1.7   2.0887   1.8    2.6	HT1900.1-2455
288.7989  10.9507    0.4  13.4    4.1  13.1608  27.6    0.3	GRS 1915+105
299.5883  35.1856    0.8  13.3 -153.8   7.6623  15.0    1.0	Cyg X-1
308.0594  40.9752    0.9  22.0 -149.5   6.8604  12.6    2.7	Cyg X-3
326.2855  38.2882    4.4  33.0 -129.4   2.1225   2.6    5.7	Cyg X-2
294.0893  67.2733    3.9  43.2  176.1   2.4329   3.0 ------	UNKNOWN
339.6305  35.5755    3.2  43.2 -122.6   6.8748   3.7 ------	UNKNOWN
350.2008  47.9459    4.3  51.9 -138.6   8.7541   2.7 ------	UNKNOWN
321.5707 -16.9112    3.8  50.7  -44.5   9.1874   3.1 ------	UNKNOWN
345.4847  40.2226    2.6  48.0 -128.9  10.8574   4.4 ------	UNKNOWN