Analysis Summary
Notes:
- 1) No attempt has been made to eliminate the non-significant decimal places.
- 2) This batgrbproduct analysis is done using the HEASARC data.
- 3) This batgrbproduct analysis is using the flight position for the mask-weighting calculation.
======================================================================
BAT GRB EVENT DATA PROCESSING REPORT
Process Script Ver: batgrbproduct v2.46
Process Start Time: Mon Jan 13 05:12:45 EST 2014
Host Name: batevent1
Current Working Dir: /local/data/batevent/batevent_reproc/trigger518626
======================================================================
Trigger: 00518626 Segment: 000
BAT Trigger Time: 354417637.312 [s; MET]
Trigger Stop: 354417637.824 [s; MET]
UTC: 2012-03-26T01:20:29.280140 [includes UTCF correction]
Where From?: TDRSS position message
BAT
RA: 273.92454494837 Dec: 69.2780331370331 [deg; J2000]
Catalogged Source?: NO
Point Source?: YES
GRB Indicated?: YES [ by BAT flight software ]
Image S/N Ratio: 7.23
Image Trigger?: NO
Rate S/N Ratio: 10.1488915650922 [ if not an image trigger ]
Image S/N Ratio: 7.23
Analysis Position: [ source = BAT ]
RA: 273.92454494837 Dec: 69.2780331370331 [deg; J2000]
Refined Position: [ source = BAT pre-slew burst ]
RA: 273.902617003907 Dec: 69.2480690336554 [deg; J2000]
{ 18h 15m 36.6s , +69d 14' 53.0" }
+/- 0.834675899999407 [arcmin] (estimated 90% radius based on SNR)
+/- 0.234094523747161 [arcmin] (formal 1-sigma fit error)
SNR: 39.3763723113846
Angular difference between the analysis and refined position is 1.857221 arcmin
Partial Coding Fraction: 0.9140625 [ including projection effects ]
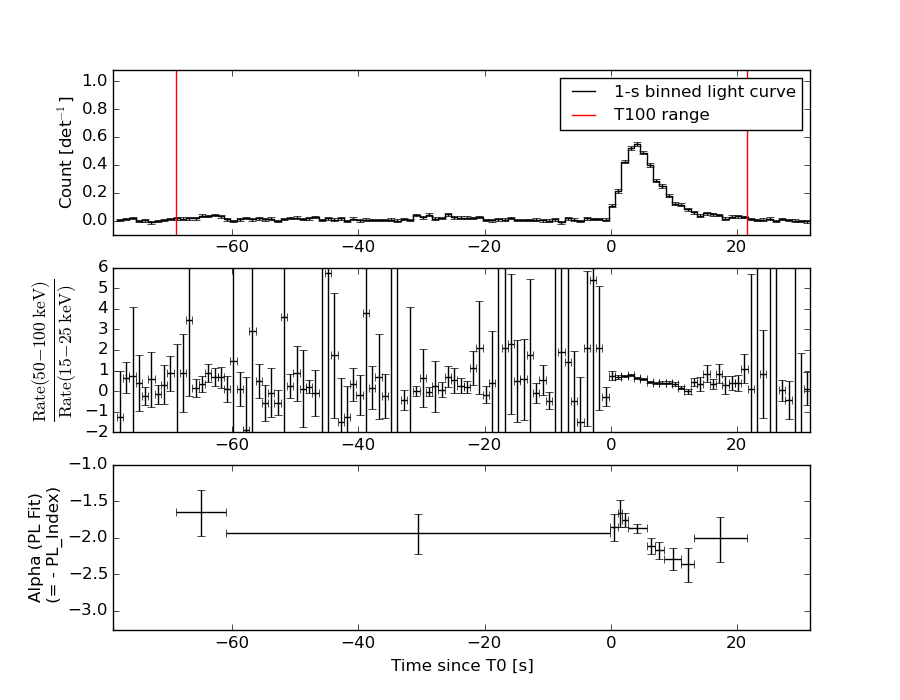
Duration
T90: 69.4799999594688 +/- 8.17964784555291
Measured from: -55.2319999933243
to: 14.2479999661446 [s; relative to TRIGTIME]
T50: 5.21999990940094 +/- 0.43430867911566
Measured from: 1.84800004959106
to: 7.067999958992 [s; relative to TRIGTIME]
Fluence
Peak Flux (peak 1 second)
Measured from: 3.58799999952316
to: 4.58799999952316 [s; relative to TRIGTIME]
Total Fluence
Measured from: -68.9839999675751
to: 21.5920000076294 [s; relative to TRIGTIME]
Band 1 Band 2 Band 3 Band 4
15-25 25-50 50-100 100-350 keV
Total 1.849994 2.015343 1.037740 0.137300
0.050394 0.051525 0.044329 0.037140 [error]
Peak 0.189403 0.232733 0.121355 0.020770
0.007681 0.008159 0.006724 0.004514 [error]
[ fluence units of on-axis counts / fully illuminated detector ]
======================================================================
====== Table of the duration information =============================
Value tstart tstop
T100 90.576 -68.984 21.592
T90 69.480 -55.232 14.248
T50 5.220 1.848 7.068
Peak 1.000 3.588 4.588
====== Spectral Analysis Summary =====================================
Model : spectral model: simple power-law (PL) and cutoff power-law (CPL)
Ph_index : photon index: E^{Ph_index}
Ph_90err : 90% error of the photon index
Epeak : Epeak in keV
Epeak_90err: 90% error of Epeak
Norm : normalization at 50 keV in both the PL model and CPL model
Nomr_90err : 90% error of the normalization
chi2 : Chi-Squared
dof : degree of freedo
=== Time-averaged spectral analysis ===
(Best model with acceptable fit: CPL)
Model Ph_index Ph_90err_low Ph_90err_hi Epeak Epeak_90err_low Epeak_90err_hi Norm Nomr_90err_low Norm_90err_hi chi2 dof
PL -1.986 -0.071 0.070 - - - 3.20e-03 -1.26e-04 1.25e-04 62.180 57
CPL -1.400 -0.302 0.327 46.838 -6.559 7.895 6.53e-03 -1.97e-03 3.15e-03 50.460 56
=== 1-s peak spectral analysis ===
(Best model with acceptable fit: PL)
Model Ph_index Ph_90err_low Ph_90err_hi Epeak Epeak_90err_low Epeak_90err_hi Norm Nomr_90err_low Norm_90err_hi chi2 dof
PL -1.854 -0.082 0.081 - - - 3.37e-02 -1.64e-03 1.63e-03 62.260 57
CPL -1.234 -0.359 0.396 56.476 -7.860 18.203 7.25e-02 -2.56e-02 4.55e-02 53.040 56
=== Fluence/Peak Flux Summary ===
Model Band1 Band2 Band3 Band4 Band5 Total
15-25 25-50 50-100 100-350 15-150 15-350 keV
Fluence PL 5.85e-07 8.01e-07 8.09e-07 1.48e-06 2.67e-06 3.68e-06 erg/cm2
90%_error_low -3.45e-08 -2.82e-08 -4.42e-08 -1.65e-07 -1.00e-07 -2.04e-07 erg/cm2
90%_error_hi 3.52e-08 2.82e-08 4.44e-08 1.79e-07 1.01e-07 2.14e-07 erg/cm2
Peak flux PL 1.95e+00 1.59e+00 8.81e-01 7.16e-01 4.74e+00 5.14e+00 ph/cm2/s
90%_error_low -1.41e-01 -7.24e-02 -5.61e-02 -8.72e-02 -2.18e-01 -2.27e-01 ph/cm2/s
90%_error_hi 1.44e-01 7.23e-02 5.60e-02 9.44e-02 2.18e-01 2.27e-01 ph/cm2/s
Fluence CPL 5.33e-07 8.40e-07 8.03e-07 6.25e-07 2.52e-06 2.80e-06 erg/cm2
90%_error_low -4.23e-08 -3.45e-08 -4.87e-08 -2.05e-07 -1.24e-07 -2.46e-07 erg/cm2
90%_error_hi 4.30e-08 3.50e-08 4.83e-08 3.21e-07 1.25e-07 3.47e-07 erg/cm2
Peak flux CPL N/A N/A N/A N/A N/A N/A ph/cm2/s
90%_error_low -1.41e-01 -7.24e-02 -5.61e-02 -8.72e-02 -2.18e-01 -2.27e-01 ph/cm2/s
90%_error_hi 1.44e-01 7.23e-02 5.60e-02 9.44e-02 2.18e-01 2.27e-01 ph/cm2/s
======================================================================
Image
Pre-slew 15.0-350.0 keV image (Event data)
#   RAcent    DECcent   POSerr    Theta     Phi              Peak Cts       SNR   Name
  273.9026    69.2481   0.0049    15.3125  -119.7098         4.4756009     39.376 TRIG_00518626

Foreground time interval of the image:
-68.984  10.989 (delta_t =  79.973 [sec])
Background time interval of the image:
-239.312 -68.984 (delta_t = 170.328 [sec])
Light Curves
Note: The mask-weighted lightcurves have units of either count/det or counts/sec/det, where a det is 0.4 x 0.4 = 0.16 sq cm.
Full-time range; 1 s binning
Other quick-look light curves:
- 64 ms binning (zoomed)
- 16 ms binning (zoomed)
- 8 ms binning (zoomed)
- 2 ms binning (zoomed)
- SN=5 or 10 s binning (full-time range)
- Raw light curve
Spectra
- 64 ms binning (zoomed)
- 16 ms binning (zoomed)
- 8 ms binning (zoomed)
- 2 ms binning (zoomed)
- SN=5 or 10 s binning (full-time range)
- Raw light curve
Spectra
Notes:
- 1) The fitting includes the systematic errors.
- 2) When the burst includes telescope slew time periods, the fitting uses an average response file made from multiple 5-s response files through out the slew time plus single time preiod for the non-slew times, and weighted by the total counts in the corresponding time period using addrmf. An average response file is needed becuase a spectral fit using the pre-slew DRM will introduce some errors in both a spectral shape and a normalization if the PHA file contains a lot of the slew/post-slew time interval.
- 3) For fits to more complicated models (e.g. a power-law over a cutoff power-law), the BAT team has decided to require a chi-square improvement of more than 6 for each extra dof.
Time averaged spectrum fit using the average DRM
Power-law model
Time interval is from  -68.984 sec. to   21.592 sec.

Spectral model in power-law:
------------------------------------------------------------
Parameters  : value       lower 90%   higher 90%
Photon index: -1.98561     ( -0.070626   0.0697645 )
Norm@50keV  : 3.19970E-03    ( -0.000125535   0.000124808 )
------------------------------------------------------------
#Fit statistic : Chi-Squared =          62.18 using 59 PHA bins.
# Reduced chi-squared =          1.091 for     57 degrees of freedom
# Null hypothesis probability =   2.970657e-01

Photon flux (15-150 keV)    in 90.58 sec: 0.476841 ( -0.017751  0.01781 ) ph/cm2/s
Energy fluence (15-150 keV)             : 2.67129e-06 ( -1.00471e-07  1.01018e-07 ) ergs/cm2
Cutoff power-law model
Time interval is from  -68.984 sec. to   21.592 sec.
Spectral model in the cutoff power-law:
------------------------------------------------------------
Parameters  : value       lower 90%   higher 90%
Photon index: -1.39955     ( -0.302257   0.326623 )
Epeak [keV] : 46.8379      ( -6.55892 7.8951 )
Norm@50keV  : 6.52736E-03    ( -0.00197346   0.00314676 )
------------------------------------------------------------
#Fit statistic : Chi-Squared =          50.46 using 59 PHA bins.
# Reduced chi-squared =         0.9011 for     56 degrees of freedom
# Null hypothesis probability =   6.837655e-01

Photon flux (15-150 keV)    in 90.58 sec: 0.456771 ( -0.020172  0.020272 ) ph/cm2/s
Energy fluence (15-150 keV)             : 2.51711e-06 ( -1.24221e-07  1.25252e-07 ) ergs/cm2
1-s peak spectrum fit
Power-law model
Time interval is from    3.588 sec. to    4.588 sec.

Spectral model in power-law:
------------------------------------------------------------
Parameters  : value       lower 90%   higher 90%
Photon index: -1.85429     ( -0.0818493   0.080727 )
Norm@50keV  : 3.36734E-02    ( -0.00164454   0.00163443 )
------------------------------------------------------------
#Fit statistic : Chi-Squared =          62.26 using 59 PHA bins.
# Reduced chi-squared =          1.092 for     57 degrees of freedom
# Null hypothesis probability =   2.944009e-01

Photon flux (15-150 keV)    in 1 sec: 4.74170 ( -0.21783  0.21816 ) ph/cm2/s
Energy fluence (15-150 keV)             : 3.09656e-07 ( -1.51528e-08  1.52293e-08 ) ergs/cm2
Cutoff power-law model
Time interval is from    3.588 sec. to    4.588 sec.
Spectral model in the cutoff power-law:
------------------------------------------------------------
Parameters  : value       lower 90%   higher 90%
Photon index: -1.23378     ( -0.359485   0.39614 )
Epeak [keV] : 56.4759      ( -7.85927 18.2031 )
Norm@50keV  : 7.25104E-02    ( -0.0256064   0.0454769 )
------------------------------------------------------------
#Fit statistic : Chi-Squared =          53.04 using 59 PHA bins.
# Reduced chi-squared =         0.9471 for     56 degrees of freedom
# Null hypothesis probability =   5.877485e-01

Photon flux (15-150 keV)    in 1 sec:  (    ) ph/cm2/s
Energy fluence (15-150 keV)             : 2.92833e-07 ( -1.78284e-08  1.78947e-08 ) ergs/cm2
Time-resolved spectra
Distribution
T90 vs. Hardness ratio plot
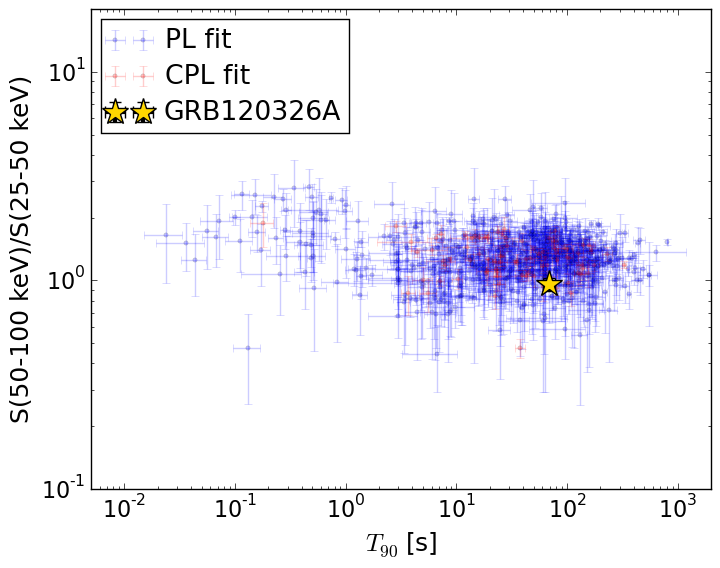
T90                                   = 69.48 sec.
Hardness ratio (energy fluence ratio) = 0.956511080382
S(15-50 keV) vs. S(50-150 keV) plot
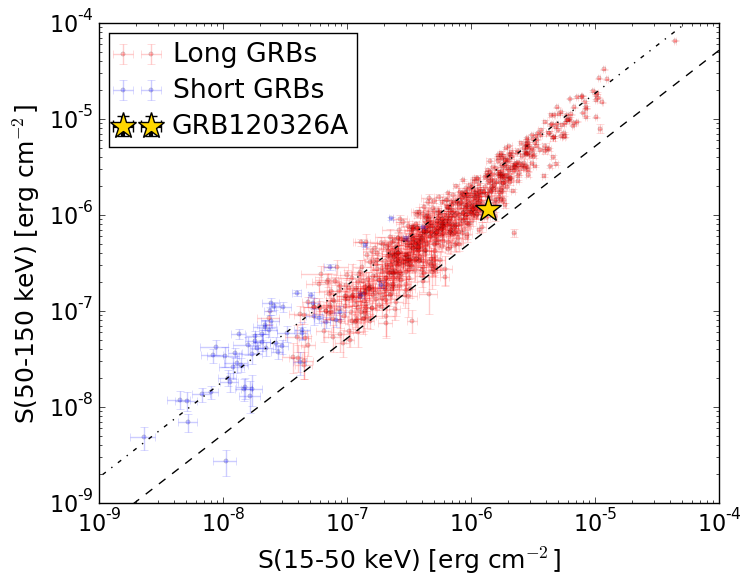
S(15-50 keV)  = 1.3731416e-06
S(50-150 keV) = 1.1439542e-06
The dash-dotted line and the dashed line traces the fluences calculated from the Band function with Epeak = 15 and 150 keV, respectively. Both lines assume a canonical values of alpha = -1 and beta = -2.5.
Mask shadow pattern
IMX = -1.356994435304406E-01, IMY = 2.378115082158468E-01
Spacecraft aspect plot
Bright source in the pre-burst/pre-slew/post-slew images
Pre-burst image of 15-350 keV band
Time interval of the image:
-239.312000 -68.984000

# RAcent  DECcent POSerr Theta    Phi  PeakCts   SNR AngSep     Name
#  [deg]    [deg]    ['] [deg]  [deg]                   [']
254.4553  35.3400  382.6  22.3   21.9   0.0040   0.0    0.2	Her X-1
288.8122  10.9436    2.8  54.8  -18.2   1.8672   4.1    0.8	GRS 1915+105
299.6056  35.2256    2.2  39.0  -47.4   1.2705   5.3    1.6	Cyg X-1
308.0811  41.0057    2.4  39.2  -61.4   1.4859   4.8    3.4	Cyg X-3
246.2489   9.9980    2.5  47.7   35.6   2.1826   4.7 ------	UNKNOWN
148.5366  52.0614    3.4  53.6  160.8   2.4999   3.4 ------	UNKNOWN
193.0777  59.1035    2.6  29.6  147.0   0.7651   4.4 ------	UNKNOWN
104.6735  62.2107    2.8  57.4 -168.8   2.7539   4.2 ------	UNKNOWN
291.5502  55.9962    2.3  21.9  -74.2   0.7666   5.0 ------	UNKNOWN
319.5258  52.9212    3.1  37.6  -84.2   1.4525   3.7 ------	UNKNOWN
 19.6637  69.0950    2.3  48.0 -128.9   2.9132   5.0 ------	UNKNOWN
Pre-slew background subtracted image of 15-350 keV band
Time interval of the image:
-68.984000 10.988590

# RAcent  DECcent POSerr Theta    Phi  PeakCts   SNR AngSep     Name
#  [deg]    [deg]    ['] [deg]  [deg]                   [']
254.5056  35.4389    6.0  22.2   21.8   0.2131   1.9    6.2	Her X-1
288.6898  10.7723   14.9  54.9  -18.0   0.2678   0.8   12.2	GRS 1915+105
299.4284  35.0696   66.4  39.0  -47.0   0.0314   0.2   11.2	Cyg X-1
308.0573  40.9406    3.8  39.3  -61.3   0.7449   3.0    2.5	Cyg X-3
273.9026  69.2481    0.3  15.3 -119.7   4.4755  39.4 ------	UNKNOWN
Post-slew image of 15-350 keV band
Time interval of the image:
48.388600 332.788590

# RAcent  DECcent POSerr Theta    Phi  PeakCts   SNR AngSep     Name
#  [deg]    [deg]    ['] [deg]  [deg]                   [']
254.2715  35.3647    4.8  35.6   30.4  -0.6678  -2.4    9.2	Her X-1
288.7528  10.9315    4.2  59.1  -14.7   2.9814   2.7    2.8	GRS 1915+105
299.6108  35.1874    1.5  36.9  -33.8   2.2537   7.9    1.3	Cyg X-1
308.0602  40.9595    1.4  33.5  -47.9   2.3974   8.3    2.3	Cyg X-3
326.2774  38.3106   13.9  41.5  -67.4   0.6895   0.8    5.0	Cyg X-2
161.0203  57.5847    2.5  44.3  137.4   3.3465   4.5 ------	UNKNOWN
256.3599  27.0794    2.8  43.4   25.3   1.6972   4.2 ------	UNKNOWN
290.8042  43.4501    2.5  27.3  -25.1   0.9504   4.6 ------	UNKNOWN
 10.4969  77.8488    3.3  25.1 -148.1   0.6904   3.5 ------	UNKNOWN