Analysis Summary
Notes:
- 1) No attempt has been made to eliminate the non-significant decimal places.
- 2) This batgrbproduct analysis is done using the HEASARC data.
- 3) This batgrbproduct analysis is using the flight position for the mask-weighting calculation.
======================================================================
                  BAT GRB EVENT DATA PROCESSING REPORT
    Process Script Ver: batgrbproduct v2.46
    Process Start Time: Mon Jan 13 05:03:21 EST 2014
             Host Name: batevent1
   Current Working Dir: /local/data/batevent/batevent_reproc/trigger518792
======================================================================

  Trigger: 00518792      Segment: 000

  BAT Trigger Time: 354596787.072   [s; MET]
      Trigger Stop: 354596788.48   [s; MET]
               UTC: 2012-03-28T03:06:19.032840    [includes UTCF correction]
       Where From?: TDRSS position message

  BAT
    RA: 241.549796791991   Dec: -39.3402511024914  [deg; J2000]

     Catalogged Source?: NO
     Point Source?:      YES
     GRB Indicated?:     YES    [ by BAT flight software ]
     Image S/N Ratio:    6.57
     Image Trigger?:     NO
     Rate S/N Ratio:     13.1909059582729  [ if not an image trigger ]
     Image S/N Ratio:    6.57

  Analysis Position:   [ source = BAT ]
    RA: 241.549796791991   Dec: -39.3402511024914  [deg; J2000]

  Refined Position:   [ source = BAT pre-slew burst ]
    RA: 241.606988592298   Dec: -39.3221541575653  [deg; J2000]
        { 16h 06m 25.7s , -39d 19' 19.8" }
         +/- 1.7695533704008 [arcmin] (estimated 90% radius based on SNR)
         +/- 0.724701411119114 [arcmin] (formal 1-sigma fit error)
    SNR: 13.4594535820635

  Angular difference between the analysis and refined position is 2.867763 arcmin

  Partial Coding Fraction: 1.015625    [ including projection effects ]

  Duration
     T90: 29.9279999732971 +/- 6.66506352223562
        Measured from: -15.9000000357628
                   to: 14.0279999375343     [s; relative to TRIGTIME]
     T50: 12.3359999656677 +/- 2.93431559074022
        Measured from: -10.8440000414848
                   to: 1.49199992418289     [s; relative to TRIGTIME]


  Fluence
     Peak Flux  (peak 1 second)
        Measured from: 0.107999980449677
                   to: 1.10799998044968     [s; relative to TRIGTIME]
     Total Fluence
        Measured from: -17.2600000500679
                   to: 20.5479999780655     [s; relative to TRIGTIME]

             Band 1     Band 2     Band 3     Band 4
              15-25      25-50     50-100    100-350     keV
 Total     0.302021   0.385292   0.187890   0.065593
           0.038000   0.033065   0.027693   0.023895 [error]
 Peak      0.028965   0.031687   0.031992   0.006983
           0.006374   0.005850   0.004904   0.004075 [error]

     [ fluence units of on-axis counts / fully illuminated detector ]

======================================================================


====== Table of the duration information =============================

        Value   tstart    tstop
T100   37.808  -17.260   20.548
T90    29.928  -15.900   14.028
T50    12.336  -10.844    1.492
Peak    1.000    0.108    1.108


====== Spectral Analysis Summary =====================================

Model      : spectral model: simple power-law (PL) and cutoff power-law (CPL)
Ph_index   : photon index: E^{Ph_index}
Ph_90err   : 90% error of the photon index
Epeak      : Epeak in keV
Epeak_90err: 90% error of Epeak
Norm       : normalization at 50 keV in both the PL model and CPL model
Nomr_90err : 90% error of the normalization
chi2       : Chi-Squared
dof        : degree of freedo

=== Time-averaged spectral analysis ===
(Best model with acceptable fit: N/A)

Model Ph_index Ph_90err_low Ph_90err_hi  Epeak  Epeak_90err_low  Epeak_90err_hi  Norm       Nomr_90err_low    Norm_90err_hi    chi2    dof
PL      -1.867    -0.200      0.194       -           -               -         1.37e-03     -1.74e-04          1.71e-04      77.140   57
CPL     -0.882    -0.908      1.166       46.583     -10.330        60.684      5.10e-03     -5.10e-03          1.97e-02      73.700   56


=== 1-s peak spectral analysis ===
(Best model with acceptable fit: PL)

Model Ph_index Ph_90err_low Ph_90err_hi  Epeak  Epeak_90err_low  Epeak_90err_hi  Norm       Nomr_90err_low    Norm_90err_hi    chi2    dof
PL      -1.402     -0.326     0.326       -           -               -         6.06e-03     -1.08e-03          1.07e-03      63.130   57
CPL     -1.190     -1.639     1.210      204.312    -204.312      -204.312      7.64e-03     -2.63e-03          1.84e-02      63.130   56


=== Fluence/Peak Flux Summary ===

              Model    Band1     Band2     Band3     Band4     Band5     Total
                       15-25     25-50    50-100    100-350    15-150    15-350    keV
Fluence         PL   9.34e-08  1.37e-07  1.50e-07  3.10e-07  4.76e-07  6.91e-07   erg/cm2
      90%_error_low -1.49e-08 -1.49e-08 -2.55e-08 -9.44e-08 -5.96e-08 -1.23e-07   erg/cm2
      90%_error_hi   1.54e-08  1.49e-08  2.60e-08  1.20e-07  6.07e-08  1.43e-07   erg/cm2
Peak flux       PL   2.27e-01  2.42e-01  1.83e-01  2.25e-01  7.38e-01  8.78e-01   ph/cm2/s
      90%_error_low -7.14e-02 -4.87e-02 -4.04e-02 -9.00e-02 -1.34e-01 -1.57e-01   ph/cm2/s
      90%_error_hi   7.93e-02  4.75e-02  3.96e-02  1.22e-01  1.35e-01  1.59e-01   ph/cm2/s

Fluence        CPL   8.58e-08  1.53e-07  1.41e-07  6.56e-08  4.25e-07  4.45e-07   erg/cm2
      90%_error_low -1.69e-08 -2.08e-08 -3.52e-08 -4.96e-08 -6.81e-08 -8.56e-08   erg/cm2
      90%_error_hi   1.71e-08  2.16e-08  3.13e-08  1.98e-07  7.49e-08  2.08e-07   erg/cm2
Peak flux      CPL   2.22e-01  2.44e-01  1.85e-01  2.01e-01  7.34e-01  8.52e-01   ph/cm2/s
      90%_error_low -9.02e-02 -5.01e-02 -4.21e-02 -2.01e-01 -1.42e-01 -2.19e-01   ph/cm2/s
      90%_error_hi   4.53e-02  5.28e-02  4.62e-02  9.39e-02  1.38e-01  1.82e-01   ph/cm2/s

======================================================================
Image
Pre-slew 15.0-350.0 keV image (Event data)
#   RAcent    DECcent   POSerr    Theta     Phi              Peak Cts       SNR   Name
  241.6070   -39.3222   0.0143    10.8068     2.0572         0.9263590     13.459 TRIG_00518792

Foreground time interval of the image:
-17.260  20.548 (delta_t =  37.808 [sec])
Background time interval of the image:
-239.072 -17.260 (delta_t = 221.812 [sec])
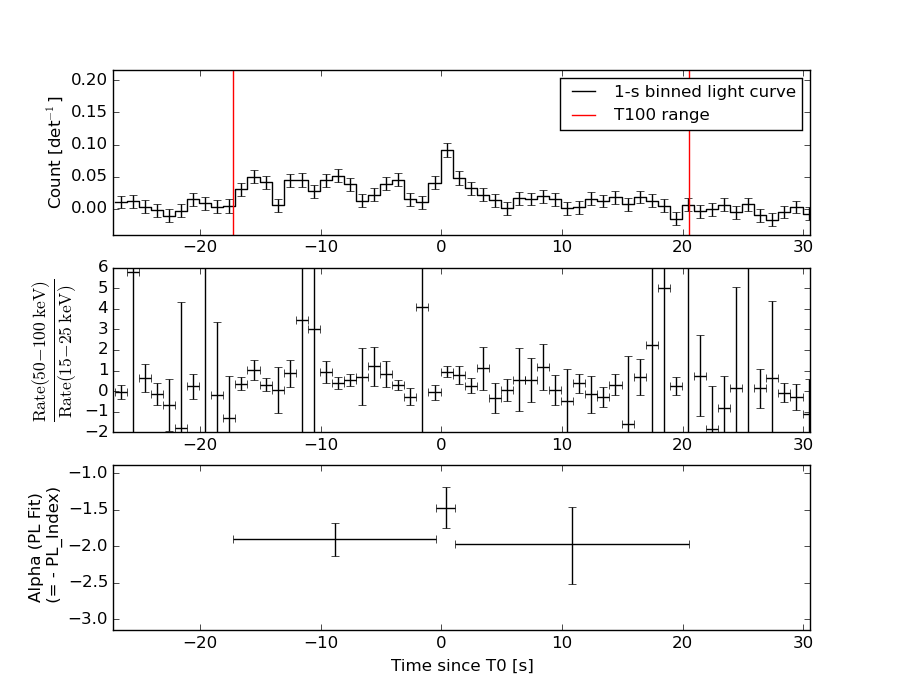
Light Curves
Note: The mask-weighted lightcurves have units of either count/det or counts/sec/det, where a det is 0.4 x 0.4 = 0.16 sq cm.
Full-time range; 1 s binning
Other quick-look light curves:
- 64 ms binning (zoomed)
- 16 ms binning (zoomed)
- 8 ms binning (zoomed)
- 2 ms binning (zoomed)
- SN=5 or 10 s binning (full-time range)
- Raw light curve
Spectra
- 64 ms binning (zoomed)
- 16 ms binning (zoomed)
- 8 ms binning (zoomed)
- 2 ms binning (zoomed)
- SN=5 or 10 s binning (full-time range)
- Raw light curve
Spectra
Notes:
- 1) The fitting includes the systematic errors.
- 2) When the burst includes telescope slew time periods, the fitting uses an average response file made from multiple 5-s response files through out the slew time plus single time preiod for the non-slew times, and weighted by the total counts in the corresponding time period using addrmf. An average response file is needed becuase a spectral fit using the pre-slew DRM will introduce some errors in both a spectral shape and a normalization if the PHA file contains a lot of the slew/post-slew time interval.
- 3) For fits to more complicated models (e.g. a power-law over a cutoff power-law), the BAT team has decided to require a chi-square improvement of more than 6 for each extra dof.
Time averaged spectrum fit using the average DRM
Power-law model
Time interval is from  -17.260 sec. to   20.548 sec.

Spectral model in power-law:
------------------------------------------------------------
Parameters  : value       lower 90%   higher 90%
Photon index: -1.86726     ( -0.200155   0.193913 )
Norm@50keV  : 1.36853E-03    ( -0.000173906   0.000171089 )
------------------------------------------------------------
#Fit statistic : Chi-Squared =          77.14 using 59 PHA bins.
# Reduced chi-squared =          1.353 for     57 degrees of freedom
# Null hypothesis probability =   3.902349e-02

Photon flux (15-150 keV)    in 37.81 sec: 0.193736 ( -0.021222  0.021245 ) ph/cm2/s
Energy fluence (15-150 keV)             : 4.75782e-07 ( -5.95969e-08  6.07387e-08 ) ergs/cm2
Cutoff power-law model
Time interval is from  -17.260 sec. to   20.548 sec.
Spectral model in the cutoff power-law:
------------------------------------------------------------
Parameters  : value       lower 90%   higher 90%
Photon index: -0.881969     ( -0.908515   1.16592 )
Epeak [keV] : 46.5829      ( -10.3289 60.6852 )
Norm@50keV  : 5.09928E-03    ( -0.00509995   0.0197131 )
------------------------------------------------------------
#Fit statistic : Chi-Squared =          73.70 using 59 PHA bins.
# Reduced chi-squared =          1.316 for     56 degrees of freedom
# Null hypothesis probability =   5.657957e-02

Photon flux (15-150 keV)    in 37.81 sec: 0.185594 ( -0.022368  0.022465 ) ph/cm2/s
Energy fluence (15-150 keV)             : 4.24754e-07 ( -6.80837e-08  7.49088e-08 ) ergs/cm2
1-s peak spectrum fit
Power-law model
Time interval is from    0.108 sec. to    1.108 sec.

Spectral model in power-law:
------------------------------------------------------------
Parameters  : value       lower 90%   higher 90%
Photon index: -1.40239     ( -0.325935   0.326036 )
Norm@50keV  : 6.05572E-03    ( -0.00107514   0.001071 )
------------------------------------------------------------
#Fit statistic : Chi-Squared =          63.13 using 59 PHA bins.
# Reduced chi-squared =          1.107 for     57 degrees of freedom
# Null hypothesis probability =   2.688608e-01

Photon flux (15-150 keV)    in 1 sec: 0.737889 ( -0.134178  0.135004 ) ph/cm2/s
Energy fluence (15-150 keV)             : 5.84925e-08 ( -1.14121e-08  1.15804e-08 ) ergs/cm2
Cutoff power-law model
Time interval is from    0.108 sec. to    1.108 sec.
Spectral model in the cutoff power-law:
------------------------------------------------------------
Parameters  : value       lower 90%   higher 90%
Photon index: -1.28751     ( -1.62693   1.22136 )
Epeak [keV] : 330.765      ( -260.938 -260.938 )
Norm@50keV  : 6.86057E-03    ( -0.00175043   0.0193139 )
------------------------------------------------------------
#Fit statistic : Chi-Squared =          63.10 using 59 PHA bins.
# Reduced chi-squared =          1.127 for     56 degrees of freedom
# Null hypothesis probability =   2.398027e-01

Photon flux (15-150 keV)    in 1 sec: 0.733796 ( -0.141799  0.138106 ) ph/cm2/s
Energy fluence (15-150 keV)             : 3.11882e-08 ( -1.4392e-08  1.01318e-08 ) ergs/cm2
Time-resolved spectra
Distribution
T90 vs. Hardness ratio plot
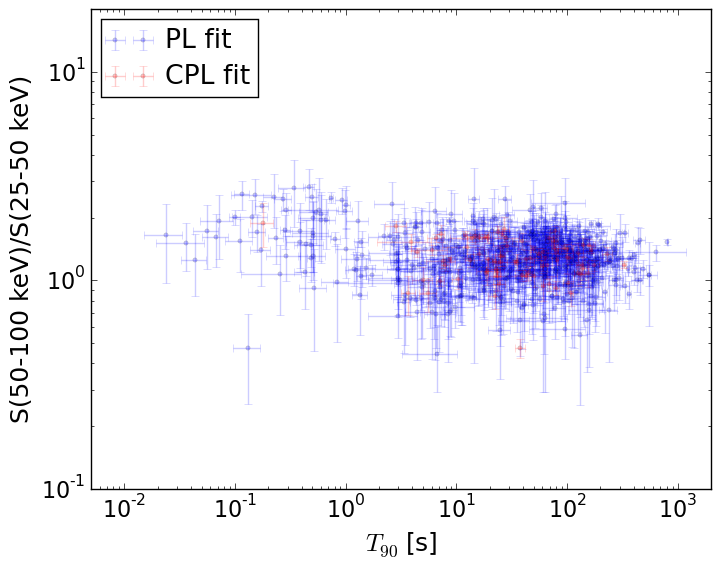
T90                                   = N/A sec.
Hardness ratio (energy fluence ratio) = N/A
S(15-50 keV) vs. S(50-150 keV) plot
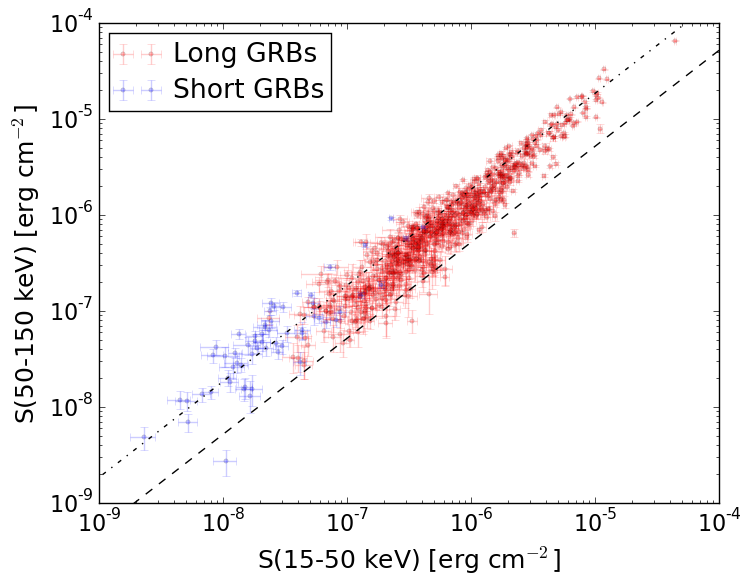
S(15-50 keV)  = N/A
S(50-150 keV) = N/A
The dash-dotted line and the dashed line traces the fluences calculated from the Band function with Epeak = 15 and 150 keV, respectively. Both lines assume a canonical values of alpha = -1 and beta = -2.5.
Mask shadow pattern
IMX = 1.907596990060531E-01, IMY = -6.852290622875360E-03
Spacecraft aspect plot
Bright source in the pre-burst/pre-slew/post-slew images
Pre-burst image of 15-350 keV band
Time interval of the image:
-239.072000 -17.260000

# RAcent  DECcent POSerr Theta    Phi  PeakCts   SNR AngSep     Name
#  [deg]    [deg]    ['] [deg]  [deg]                   [']
186.6123 -62.8088    3.1  50.6   10.6   2.4332   3.7    2.6	GX 301-2
244.9791 -15.6426    0.2  13.9  152.0  13.4082  65.0    0.1	Sco X-1
255.8547 -37.6637    0.0  11.1  -60.1   0.2268   1.0   12.5	4U 1700-377
256.4814 -36.4595    5.3  10.7  -66.6   0.4684   2.2    3.1	GX 349+2
263.0177 -24.7609  340.5  15.1 -124.5  -0.0069  -0.0    1.0	GX 1+4
264.6434 -44.5041    3.0  20.6  -58.4   0.8754   3.8    5.4	4U 1735-44
268.3856  -1.4906    2.4  34.6 -160.1   1.1704   4.8    2.5	SW J1753.5-0127
270.1019 -25.1906    8.2  21.0 -116.3   0.3255   1.4   11.9	GX 5-1
270.1187 -25.8558    0.0  20.8 -114.5   0.0693   0.3   12.0	GRS 1758-258
273.9530 -14.0540    2.9  29.3 -136.0   1.0422   4.0    3.3	GX 17+2
275.8410 -30.4037    5.4  25.0 -100.8   0.5791   2.2    4.9	H1820-303
285.0306 -24.9214    9.8  34.1 -108.6   0.4828   1.2    0.3	HT1900.1-2455
262.8322 -33.7262  102.1  14.2  -88.6   0.0255   0.1   10.2	GX 354-0
195.2890 -32.9440    3.7  43.8   51.4   2.6047   3.1 ------	UNKNOWN
258.1284  22.6319    2.3  53.2  172.7   3.9677   4.9 ------	UNKNOWN
262.6453  25.7272    2.9  57.2  176.6   5.5396   4.0 ------	UNKNOWN
228.1285 -61.9010    2.8  34.7   -4.9   1.0474   4.1 ------	UNKNOWN
293.6411 -23.4427    3.1  42.0 -107.1   3.6061   3.8 ------	UNKNOWN
Pre-slew background subtracted image of 15-350 keV band
Time interval of the image:
-17.260000 20.548000

# RAcent  DECcent POSerr Theta    Phi  PeakCts   SNR AngSep     Name
#  [deg]    [deg]    ['] [deg]  [deg]                   [']
186.7284 -62.7622    4.3  50.6   10.7  -0.5537  -2.7    2.0	GX 301-2
244.7792 -15.7276    0.0  13.8  151.2   0.1741   2.6   12.7	Sco X-1
256.1239 -37.9478    4.2  11.5  -59.8   0.2004   2.7    9.0	4U 1700-377
256.5666 -36.6034    0.0  10.8  -66.2  -0.1159  -1.6   12.5	GX 349+2
263.2010 -24.6376    0.0  15.3 -124.7   0.1080   1.5   12.3	GX 1+4
264.8601 -44.4827    5.6  20.7  -58.8   0.1604   2.0    5.4	4U 1735-44
268.3918  -1.6146   61.2  34.5 -160.0  -0.0164  -0.2    9.8	SW J1753.5-0127
270.3213 -25.2171   12.6  21.2 -116.1   0.0733   0.9    8.5	GX 5-1
270.4661 -25.7601    7.3  21.2 -114.6  -0.1369  -1.7    8.9	GRS 1758-258
273.9199 -13.8703   18.7  29.4 -136.4  -0.0548  -0.6   11.2	GX 17+2
276.1096 -30.2484    0.0  25.3 -101.1   0.2762   3.1   11.9	H1820-303
285.1979 -24.8589    2.8  34.2 -108.6   0.5215   4.1    9.6	HT1900.1-2455
263.1396 -33.7123    6.0  14.5  -88.9   0.1386   1.9   10.5	GX 354-0
241.6070 -39.3221    0.9  10.8    2.1   0.9263  13.5 ------	UNKNOWN
291.1137  -1.1605    2.2  50.7 -135.9   1.8831   5.4 ------	UNKNOWN
Post-slew image of 15-350 keV band
Time interval of the image:
57.428640 864.128600

# RAcent  DECcent POSerr Theta    Phi  PeakCts   SNR AngSep     Name
#  [deg]    [deg]    ['] [deg]  [deg]                   [']
170.2728 -60.5814   13.0  47.6   17.3   1.5232   0.9    2.8	Cen X-3
186.6179 -62.8101    1.6  39.9   13.9   7.4277   7.3    2.6	GX 301-2
244.9708 -15.6427    0.2  23.9  166.4  45.6315  66.8    0.5	Sco X-1
255.9722 -37.9818    8.1  11.3 -114.1   0.9262   1.4    8.3	4U 1700-377
256.2761 -36.3756    3.5  12.0 -121.5   2.0790   3.3    8.2	GX 349+2
262.8836 -24.8637    5.1  23.1 -144.3   1.4832   2.3    9.8	GX 1+4
264.6019 -44.4694    3.5  17.8  -87.6   2.2654   3.3    6.1	4U 1735-44
268.3771  -1.4245    7.3  45.1 -162.2   1.8305   1.6    1.8	SW J1753.5-0127
270.3133 -24.9405    4.3  28.1 -133.9   2.2518   2.7    8.5	GX 5-1
270.4010 -25.6148    2.7  27.8 -132.7   3.5808   4.2    9.4	GRS 1758-258
273.9967 -13.9959    2.4  38.1 -144.3   4.5723   4.7    2.5	GX 17+2
275.8937 -30.2285    9.6  29.4 -119.1   1.0702   1.2    8.5	H1820-303
285.0360 -24.9213   72.1  39.1 -120.1   0.2115   0.2    0.0	HT1900.1-2455
262.9892 -33.9819   14.3  18.0 -122.4   0.4906   0.8    8.8	GX 354-0
187.6470 -52.1394    2.9  38.7   30.7   4.0904   4.0 ------	UNKNOWN
248.3487  13.4197    3.3  53.1  166.5  10.2023   3.5 ------	UNKNOWN
238.5809 -53.0299    2.8  13.8  -14.3   2.4100   4.2 ------	UNKNOWN
283.6358 -39.6233    3.0  32.2  -97.6   3.8331   3.9 ------	UNKNOWN