Analysis Summary
Notes:
- 1) No attempt has been made to eliminate the non-significant decimal places.
- 2) This batgrbproduct analysis is done using the HEASARC data.
- 3) This batgrbproduct analysis is using the flight position for the mask-weighting calculation.
======================================================================
                  BAT GRB EVENT DATA PROCESSING REPORT
    Process Script Ver: batgrbproduct v2.46
    Process Start Time: Mon Jan 13 04:53:53 EST 2014
             Host Name: batevent1
   Current Working Dir: /local/data/batevent/batevent_reproc/trigger519211
======================================================================

  Trigger: 00519211      Segment: 000

  BAT Trigger Time: 355107931.648   [s; MET]
      Trigger Stop: 355107932.672   [s; MET]
               UTC: 2012-04-03T01:05:23.587920    [includes UTCF correction]
       Where From?: TDRSS position message

  BAT
    RA: 42.4589551294051   Dec: 40.4659032923946  [deg; J2000]

     Catalogged Source?: NO
     Point Source?:      YES
     GRB Indicated?:     YES    [ by BAT flight software ]
     Image S/N Ratio:    7.42
     Image Trigger?:     NO
     Rate S/N Ratio:     9.38083151964686  [ if not an image trigger ]
     Image S/N Ratio:    7.42

  Analysis Position:   [ source = BAT ]
    RA: 42.4589551294051   Dec: 40.4659032923946  [deg; J2000]

  Refined Position:   [ source = BAT pre-slew burst ]
    RA: 42.4666930688732   Dec: 40.4972657801416  [deg; J2000]
        { 02h 49m 52.0s , +40d 29' 50.2" }
         +/- 2.33401041426545 [arcmin] (estimated 90% radius based on SNR)
         +/- 0.821311517692422 [arcmin] (formal 1-sigma fit error)
    SNR: 9.06269265874721

  Angular difference between the analysis and refined position is 1.914598 arcmin

  Partial Coding Fraction: 0.5078125    [ including projection effects ]

  Duration
     T90: 1.39599996805191 +/- 0.225397430573168
        Measured from: 0.043999969959259
                   to: 1.43999993801117     [s; relative to TRIGTIME]
     T50: 0.783999919891357 +/- 0.284112633673917
        Measured from: 0.240000009536743
                   to: 1.0239999294281     [s; relative to TRIGTIME]


  Fluence
     Peak Flux  (peak 1 second)
        Measured from: 0.0400000214576721
                   to: 1.04000002145767     [s; relative to TRIGTIME]
     Total Fluence
        Measured from: -0.0519999861717224
                   to: 1.54000002145767     [s; relative to TRIGTIME]

             Band 1     Band 2     Band 3     Band 4
              15-25      25-50     50-100    100-350     keV
 Total     0.051526   0.061244   0.056792   0.004739
           0.010196   0.010534   0.009469   0.007867 [error]
 Peak      0.038550   0.048434   0.037684   0.003471
           0.008214   0.008435   0.007734   0.006207 [error]

     [ fluence units of on-axis counts / fully illuminated detector ]

======================================================================


====== Table of the duration information =============================

        Value   tstart    tstop
T100    1.592   -0.052    1.540
T90     1.396    0.044    1.440
T50     0.784    0.240    1.024
Peak    1.000    0.040    1.040


====== Spectral Analysis Summary =====================================

Model      : spectral model: simple power-law (PL) and cutoff power-law (CPL)
Ph_index   : photon index: E^{Ph_index}
Ph_90err   : 90% error of the photon index
Epeak      : Epeak in keV
Epeak_90err: 90% error of Epeak
Norm       : normalization at 50 keV in both the PL model and CPL model
Nomr_90err : 90% error of the normalization
chi2       : Chi-Squared
dof        : degree of freedo

=== Time-averaged spectral analysis ===
(Best model with acceptable fit: PL)

Model Ph_index Ph_90err_low Ph_90err_hi  Epeak  Epeak_90err_low  Epeak_90err_hi  Norm       Nomr_90err_low    Norm_90err_hi    chi2    dof
PL      -1.593    -0.291      0.282       -           -               -         7.19e-03     -1.35e-03          1.33e-03      49.360   57
CPL     -0.423    -1.131      1.519       64.900     -17.656       246.797      2.93e-02     -2.93e-02          1.46e-01      46.190   56


=== 1-s peak spectral analysis ===
(Best model with acceptable fit: PL)

Model Ph_index Ph_90err_low Ph_90err_hi  Epeak  Epeak_90err_low  Epeak_90err_hi  Norm       Nomr_90err_low    Norm_90err_hi    chi2    dof
PL      -1.735     -0.332     0.311       -           -               -         8.13e-03     -1.77e-03          1.73e-03      51.860   57
CPL     -0.727     -1.118     1.465       59.356     -19.639       -59.356      2.81e-02     -2.81e-02          1.42e-01      49.490   56


=== Fluence/Peak Flux Summary ===

              Model    Band1     Band2     Band3     Band4     Band5     Total
                       15-25     25-50    50-100    100-350    15-150    15-350    keV
Fluence         PL   1.59e-08  2.77e-08  3.67e-08  9.94e-08  1.07e-07  1.80e-07   erg/cm2
      90%_error_low -4.18e-09 -4.98e-09 -8.75e-09 -4.08e-08 -2.12e-08 -5.05e-08   erg/cm2
      90%_error_hi   4.44e-09  4.96e-09  8.77e-09  5.56e-08  2.16e-08  6.21e-08   erg/cm2
Peak flux       PL   4.19e-01  3.67e-01  2.21e-01  2.00e-01  1.09e+00  1.21e+00   ph/cm2/s
      90%_error_low -1.15e-01 -7.14e-02 -6.02e-02 -8.85e-02 -2.12e-01 -2.36e-01   ph/cm2/s
      90%_error_hi   1.23e-01  7.13e-02  6.05e-02  1.21e-01  2.12e-01  2.37e-01   ph/cm2/s

Fluence        CPL   1.35e-08  3.16e-08  3.89e-08  2.43e-08  9.97e-08  1.08e-07   erg/cm2
      90%_error_low -4.94e-09 -6.31e-09 -1.05e-08 -1.82e-08 -2.17e-08 -2.87e-08   erg/cm2
      90%_error_hi   5.09e-09  6.65e-09  1.04e-08  7.03e-08  2.27e-08  7.02e-08   erg/cm2
Peak flux      CPL   3.64e-01  4.11e-01  2.35e-01  7.36e-02  1.06e+00  1.08e+00   ph/cm2/s
      90%_error_low -1.33e-01 -8.69e-02 -7.16e-02 -7.36e-02 -2.13e-01 -2.23e-01   ph/cm2/s
      90%_error_hi   1.38e-01  9.15e-02  7.20e-02  1.65e-01  2.14e-01  2.45e-01   ph/cm2/s

======================================================================
Image
Pre-slew 15.0-350.0 keV image (Event data)
#   RAcent    DECcent   POSerr    Theta     Phi              Peak Cts       SNR   Name
   42.4667    40.4973   0.0212    33.2924   -48.6642         0.1754886      9.063 TRIG_00519211

Foreground time interval of the image:
 -0.052   1.540 (delta_t =   1.592 [sec])
Background time interval of the image:
-161.947  -0.052 (delta_t = 161.895 [sec])
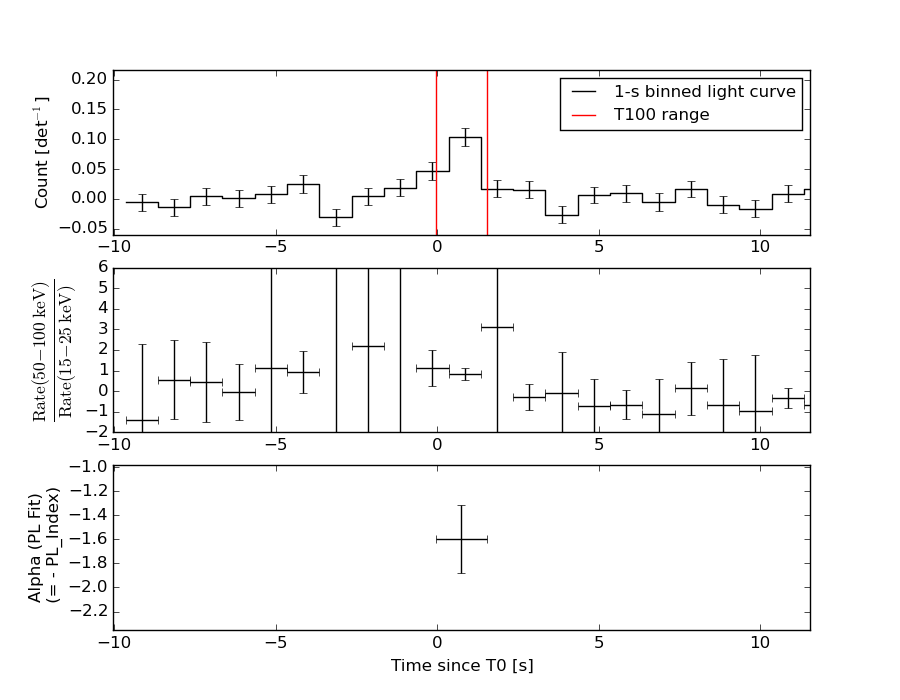
Light Curves
Note: The mask-weighted lightcurves have units of either count/det or counts/sec/det, where a det is 0.4 x 0.4 = 0.16 sq cm.
Full-time range; 1 s binning
Other quick-look light curves:
- 64 ms binning (zoomed)
- 16 ms binning (zoomed)
- 8 ms binning (zoomed)
- 2 ms binning (zoomed)
- SN=5 or 10 s binning (full-time range)
- Raw light curve
Spectra
- 64 ms binning (zoomed)
- 16 ms binning (zoomed)
- 8 ms binning (zoomed)
- 2 ms binning (zoomed)
- SN=5 or 10 s binning (full-time range)
- Raw light curve
Spectra
Notes:
- 1) The fitting includes the systematic errors.
- 2) When the burst includes telescope slew time periods, the fitting uses an average response file made from multiple 5-s response files through out the slew time plus single time preiod for the non-slew times, and weighted by the total counts in the corresponding time period using addrmf. An average response file is needed becuase a spectral fit using the pre-slew DRM will introduce some errors in both a spectral shape and a normalization if the PHA file contains a lot of the slew/post-slew time interval.
- 3) For fits to more complicated models (e.g. a power-law over a cutoff power-law), the BAT team has decided to require a chi-square improvement of more than 6 for each extra dof.
Time averaged spectrum fit using the average DRM
Power-law model
Time interval is from   -0.052 sec. to    1.540 sec.

Spectral model in power-law:
------------------------------------------------------------
Parameters  : value       lower 90%   higher 90%
Photon index: -1.59253     ( -0.290615   0.281868 )
Norm@50keV  : 7.18894E-03    ( -0.001347   0.00133021 )
------------------------------------------------------------
#Fit statistic : Chi-Squared =          49.36 using 59 PHA bins.
# Reduced chi-squared =         0.8660 for     57 degrees of freedom
# Null hypothesis probability =   7.539888e-01

Photon flux (15-150 keV)    in 1.592 sec: 0.921715 ( -0.164357  0.164605 ) ph/cm2/s
Energy fluence (15-150 keV)             : 1.07148e-07 ( -2.12003e-08  2.15684e-08 ) ergs/cm2
Cutoff power-law model
Time interval is from   -0.052 sec. to    1.540 sec.
Spectral model in the cutoff power-law:
------------------------------------------------------------
Parameters  : value       lower 90%   higher 90%
Photon index: -0.422656     ( -1.13442   1.51564 )
Epeak [keV] : 64.9004      ( -17.6063 246.846 )
Norm@50keV  : 2.93364E-02    ( -0.0294544   0.145586 )
------------------------------------------------------------
#Fit statistic : Chi-Squared =          46.19 using 59 PHA bins.
# Reduced chi-squared =         0.8249 for     56 degrees of freedom
# Null hypothesis probability =   8.220168e-01

Photon flux (15-150 keV)    in 1.592 sec: 0.889285 ( -0.167397  0.167675 ) ph/cm2/s
Energy fluence (15-150 keV)             : 9.96559e-08 ( -2.1683e-08  2.26545e-08 ) ergs/cm2
1-s peak spectrum fit
Power-law model
Time interval is from    0.040 sec. to    1.040 sec.

Spectral model in power-law:
------------------------------------------------------------
Parameters  : value       lower 90%   higher 90%
Photon index: -1.73465     ( -0.331947   0.310635 )
Norm@50keV  : 8.12913E-03    ( -0.00177255   0.00173078 )
------------------------------------------------------------
#Fit statistic : Chi-Squared =          51.86 using 59 PHA bins.
# Reduced chi-squared =         0.9099 for     57 degrees of freedom
# Null hypothesis probability =   6.676295e-01

Photon flux (15-150 keV)    in 1 sec: 1.09309 ( -0.211584  0.21172 ) ph/cm2/s
Energy fluence (15-150 keV)             : 7.50931e-08 ( -1.66235e-08  1.70303e-08 ) ergs/cm2
Cutoff power-law model
Time interval is from    0.040 sec. to    1.040 sec.
Spectral model in the cutoff power-law:
------------------------------------------------------------
Parameters  : value       lower 90%   higher 90%
Photon index: -0.726818     ( -1.11584   1.46659 )
Epeak [keV] : 59.3560      ( -19.6618 -59.3786 )
Norm@50keV  : 2.81122E-02    ( -0.028065   0.14218 )
------------------------------------------------------------
#Fit statistic : Chi-Squared =          49.49 using 59 PHA bins.
# Reduced chi-squared =         0.8837 for     56 degrees of freedom
# Null hypothesis probability =   7.181018e-01

Photon flux (15-150 keV)    in 1 sec: 1.06392 ( -0.212844  0.21363 ) ph/cm2/s
Energy fluence (15-150 keV)             : 7.08093e-08 ( -1.68421e-08  1.76473e-08 ) ergs/cm2
Time-resolved spectra
Distribution
T90 vs. Hardness ratio plot
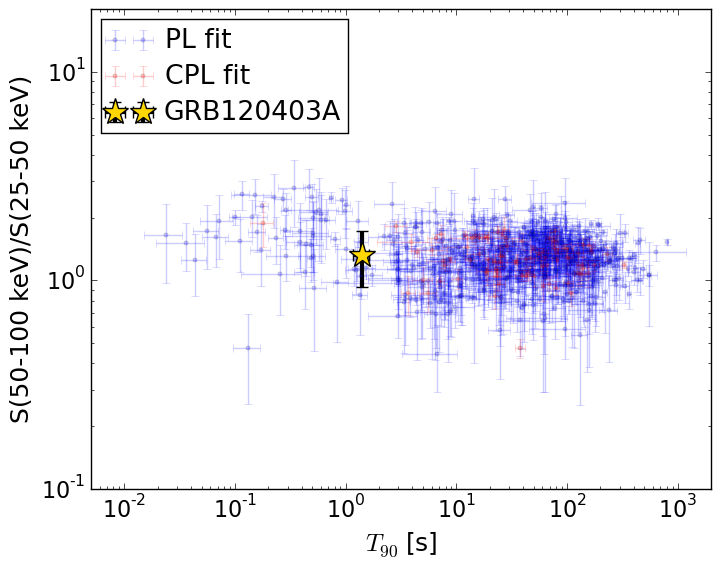
T90                                   = 1.396 sec.
Hardness ratio (energy fluence ratio) = 1.32641689509
S(15-50 keV) vs. S(50-150 keV) plot
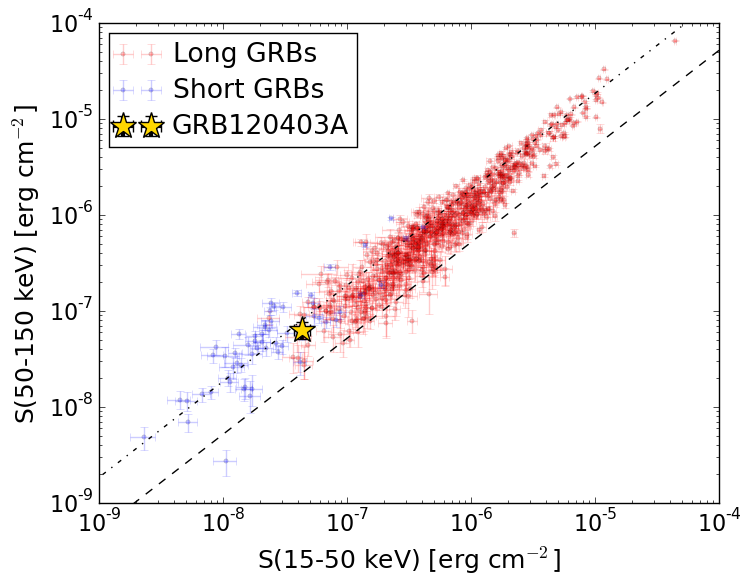
S(15-50 keV)  = 4.362216e-08
S(50-150 keV) = 6.352626e-08
The dash-dotted line and the dashed line traces the fluences calculated from the Band function with Epeak = 15 and 150 keV, respectively. Both lines assume a canonical values of alpha = -1 and beta = -2.5.
Mask shadow pattern
IMX = 4.337226059683312E-01, IMY = 4.930748108105984E-01
Spacecraft aspect plot
Bright source in the pre-burst/pre-slew/post-slew images
Pre-burst image of 15-350 keV band
Time interval of the image:
-161.947400 -0.052000

# RAcent  DECcent POSerr Theta    Phi  PeakCts   SNR AngSep     Name
#  [deg]    [deg]    ['] [deg]  [deg]                   [']
 83.6380  22.0134    0.3   6.1  144.4   6.7593  45.4    0.3	Crab
 91.3334   5.8555    2.7  23.8  155.8   0.7798   4.4 ------	UNKNOWN
 69.4163  55.0442    2.9  29.3   -4.2   0.6994   4.0 ------	UNKNOWN
 54.6206 -23.2694    9.9  55.2 -145.1   1.1896   1.2 ------	UNKNOWN
Pre-slew background subtracted image of 15-350 keV band
Time interval of the image:
-0.052000 1.540000

# RAcent  DECcent POSerr Theta    Phi  PeakCts   SNR AngSep     Name
#  [deg]    [deg]    ['] [deg]  [deg]                   [']
 83.7295  21.8776    3.7   6.3  144.7   0.0378   3.1    9.8	Crab
112.2932  49.1206    1.9  34.1   46.9   0.1335   6.2 ------	UNKNOWN
 87.0282  -8.7987    2.5  36.2  174.0   0.0857   4.6 ------	UNKNOWN
 71.9899  12.5922    2.7  15.5 -145.7   0.0537   4.3 ------	UNKNOWN
 56.9245  34.6259    2.2  20.7  -54.5   0.0757   5.3 ------	UNKNOWN
 42.4667  40.4973    1.3  33.3  -48.7   0.1755   9.1 ------	UNKNOWN
Post-slew image of 15-350 keV band
Time interval of the image:
952.852600 962.360800

# RAcent  DECcent POSerr Theta    Phi  PeakCts   SNR AngSep     Name
#  [deg]    [deg]    ['] [deg]  [deg]                   [']
 83.6297  22.0684    2.4  54.9 -153.5   0.5287   4.8    3.2	Crab
207.8815  51.7674    2.8  37.6   41.6   0.2118   4.1 ------	UNKNOWN
 96.6873  16.0286    3.0  56.6 -170.0   0.4749   3.8 ------	UNKNOWN