Analysis Summary
Notes:
- 1) No attempt has been made to eliminate the non-significant decimal places.
- 2) This batgrbproduct analysis is done using the HEASARC data.
- 3) This batgrbproduct analysis is using the flight position for the mask-weighting calculation.
======================================================================
                  BAT GRB EVENT DATA PROCESSING REPORT
    Process Script Ver: batgrbproduct v2.46
    Process Start Time: Fri Jun 12 01:54:47 EDT 2015
             Host Name: bat1
   Current Working Dir: /local/data/bat1/alien/Swift_3rdBATcatalog/event/batevent_reproc/trigger519256
======================================================================

  Trigger: 00519256      Segment: 000

  BAT Trigger Time: 355178044.544   [s; MET]
      Trigger Stop: 355178046.592   [s; MET]
               UTC: 2012-04-03T20:33:56.481060    [includes UTCF correction]
       Where From?: TDRSS position message

  BAT
    RA: 54.8088242661129   Dec: -89.0369268415211  [deg; J2000]

     Catalogged Source?: NO
     Point Source?:      YES
     GRB Indicated?:     YES    [ by BAT flight software ]
     Image S/N Ratio:    7.17
     Image Trigger?:     NO
     Rate S/N Ratio:     13  [ if not an image trigger ]
     Image S/N Ratio:    7.17

  Analysis Position:   [ source = BAT ]
    RA: 54.8088242661129   Dec: -89.0369268415211  [deg; J2000]

  Refined Position:   [ source = BAT pre-slew burst ]
    RA: 54.3070003273007   Dec: -89.0291744260173  [deg; J2000]
        { 03h 37m 13.7s , -89d 01' 45.0" }
         +/- 2.44072116868332 [arcmin] (estimated 90% radius based on SNR)
         +/- 1.33412987402905 [arcmin] (formal 1-sigma fit error)
    SNR: 8.50199797779882

  Angular difference between the analysis and refined position is 0.688866 arcmin

  Partial Coding Fraction: 0.4765625    [ including projection effects ]

  Duration
     T90: 7.28399991989136 +/- 1.919334249261
        Measured from: -2.60000002384186
                   to: 4.6839998960495     [s; relative to TRIGTIME]
     T50: 2.27199995517731 +/- 2.14724098740904
        Measured from: -0.636000037193298
                   to: 1.63599991798401     [s; relative to TRIGTIME]


  Fluence
     Peak Flux  (peak 1 second)
        Measured from: 0.915999948978424
                   to: 1.91599994897842     [s; relative to TRIGTIME]
     Total Fluence
        Measured from: -2.96000003814697
                   to: 5.32799994945526     [s; relative to TRIGTIME]

             Band 1     Band 2     Band 3     Band 4
              15-25      25-50     50-100    100-350     keV
 Total     0.142074   0.114404   0.104750  -0.030197
           0.022381   0.022587   0.019270   0.016285 [error]
 Peak      0.029840   0.032613   0.045793   0.002905
           0.008140   0.008556   0.007579   0.005806 [error]

     [ fluence units of on-axis counts / fully illuminated detector ]

======================================================================


====== Table of the duration information =============================

        Value   tstart    tstop
T100    8.288   -2.960    5.328
T90     7.284   -2.600    4.684
T50     2.272   -0.636    1.636
Peak    1.000    0.916    1.916


====== Spectral Analysis Summary =====================================

Model      : spectral model: simple power-law (PL) and cutoff power-law (CPL)
Ph_index   : photon index: E^{Ph_index}
Ph_90err   : 90% error of the photon index
Epeak      : Epeak in keV
Epeak_90err: 90% error of Epeak
Norm       : normalization at 50 keV in both the PL model and CPL model
Nomr_90err : 90% error of the normalization
chi2       : Chi-Squared
dof        : degree of freedo

=== Time-averaged spectral analysis ===
(Best model with acceptable fit: PL)

Model Ph_index Ph_90err_low Ph_90err_hi  Epeak  Epeak_90err_low  Epeak_90err_hi  Norm       Nomr_90err_low    Norm_90err_hi    chi2    dof
PL      -1.785    -0.323      0.304       -           -               -         2.72e-03     -5.67e-04          5.50e-04      47.170   57
CPL     -1.303    -0.786      1.216       65.597     -50.428       -65.597      5.02e-03     -5.02e-03          1.79e-02      46.470   56


=== 1-s peak spectral analysis ===
(Best model with acceptable fit: PL)

Model Ph_index Ph_90err_low Ph_90err_hi  Epeak  Epeak_90err_low  Epeak_90err_hi  Norm       Nomr_90err_low    Norm_90err_hi    chi2    dof
PL      -1.302     -0.343     0.347       -           -               -         7.93e-03     -1.65e-03          1.64e-03      53.370   57
CPL     -0.526     -0.973     1.917      105.624      N/A           N/A         1.81e-02        N/A               N/A         52.430   56


=== Fluence/Peak Flux Summary ===

              Model    Band1     Band2     Band3     Band4     Band5     Total
                       15-25     25-50    50-100    100-350    15-150    15-350    keV
Fluence         PL   3.77e-08  5.82e-08  6.76e-08  1.51e-07  2.08e-07  3.14e-07   erg/cm2
      90%_error_low -9.60e-09 -1.04e-08 -1.84e-08 -6.87e-08 -4.33e-08 -9.09e-08   erg/cm2
      90%_error_hi   1.00e-08  1.04e-08  1.87e-08  9.84e-08  4.44e-08  1.14e-07   erg/cm2
Peak flux       PL   2.70e-01  3.06e-01  2.48e-01  3.36e-01  9.47e-01  1.16e+00   ph/cm2/s
      90%_error_low -9.58e-02 -7.33e-02 -6.00e-02 -1.41e-01 -2.03e-01 -2.45e-01   ph/cm2/s
      90%_error_hi   1.07e-01  7.17e-02  5.88e-02  1.89e-01  2.04e-01  2.49e-01   ph/cm2/s

Fluence        CPL   3.58e-08  6.20e-08  6.84e-08  7.03e-08  2.00e-07  2.37e-07   erg/cm2
      90%_error_low -1.08e-08 -1.24e-08 -2.03e-08 -5.56e-08 -4.51e-08 -7.58e-08   erg/cm2
      90%_error_hi   1.08e-08  1.34e-08  2.03e-08  1.07e-07  4.69e-08  1.23e-07   erg/cm2
Peak flux      CPL   2.25e-01  3.22e-01  2.72e-01  1.74e-01  9.20e-01  9.93e-01   ph/cm2/s
      90%_error_low -1.22e-01 -8.22e-02 -7.27e-02 -1.74e-01 -2.11e-01 -2.58e-01   ph/cm2/s
      90%_error_hi   1.31e-01  8.47e-02  7.77e-02  2.24e-01  2.09e-01  3.18e-01   ph/cm2/s

======================================================================
Image
Pre-slew 15.0-350.0 keV image (Event data)
#   RAcent    DECcent   POSerr    Theta     Phi              Peak Cts       SNR   Name
   54.3070   -89.0292   0.0227    30.6493  -115.8824         0.3581574      8.502 TRIG_00519256

Foreground time interval of the image:
 -2.960   5.328 (delta_t =   8.288 [sec])
Background time interval of the image:
-239.544  -2.960 (delta_t = 236.584 [sec])
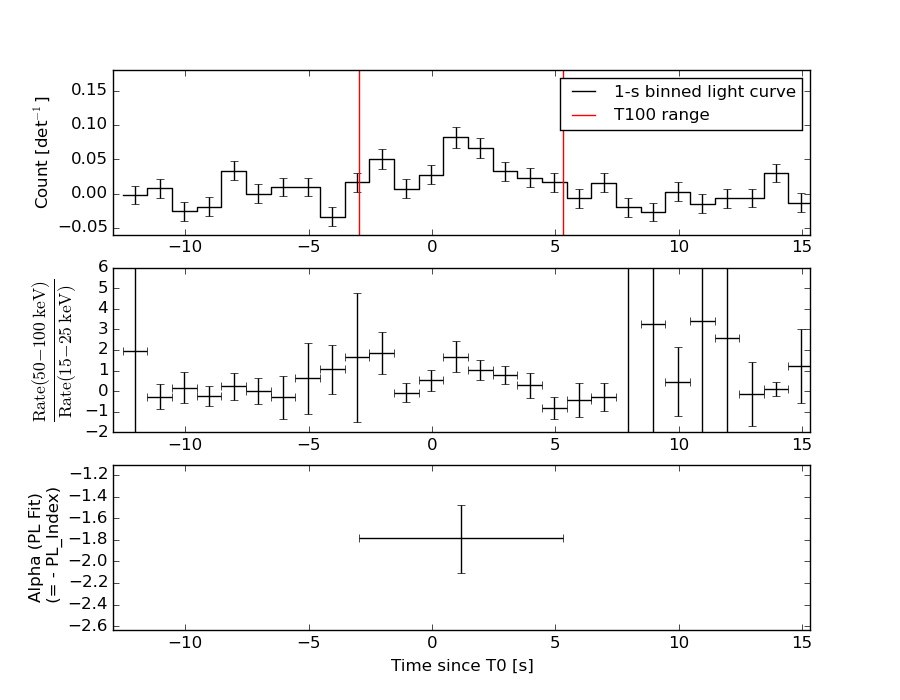
Light Curves
Note: The mask-weighted lightcurves have units of either count/det or counts/sec/det, where a det is 0.4 x 0.4 = 0.16 sq cm.
Full-time range; 1 s binning
Other quick-look light curves:
- 64 ms binning (zoomed)
- 16 ms binning (zoomed)
- 8 ms binning (zoomed)
- 2 ms binning (zoomed)
- SN=5 or 10 s binning (full-time range)
- Raw light curve
Spectra
- 64 ms binning (zoomed)
- 16 ms binning (zoomed)
- 8 ms binning (zoomed)
- 2 ms binning (zoomed)
- SN=5 or 10 s binning (full-time range)
- Raw light curve
Spectra
Notes:
- 1) The fitting includes the systematic errors.
- 2) When the burst includes telescope slew time periods, the fitting uses an average response file made from multiple 5-s response files through out the slew time plus single time preiod for the non-slew times, and weighted by the total counts in the corresponding time period using addrmf. An average response file is needed becuase a spectral fit using the pre-slew DRM will introduce some errors in both a spectral shape and a normalization if the PHA file contains a lot of the slew/post-slew time interval.
- 3) For fits to more complicated models (e.g. a power-law over a cutoff power-law), the BAT team has decided to require a chi-square improvement of more than 6 for each extra dof.
Time averaged spectrum fit using the average DRM
Power-law model
Time interval is from   -2.960 sec. to    5.328 sec.

Spectral model in power-law:
------------------------------------------------------------
Parameters  : value       lower 90%   higher 90%
Photon index: -1.78539     ( -0.323164   0.3044 )
Norm@50keV  : 2.72359E-03    ( -0.000566875   0.000550322 )
------------------------------------------------------------
#Fit statistic : Chi-Squared =          47.17 using 59 PHA bins.
# Reduced chi-squared =         0.8275 for     57 degrees of freedom
# Null hypothesis probability =   8.203205e-01

Photon flux (15-150 keV)    in 8.288 sec: 0.373219 ( -0.066773  0.066804 ) ph/cm2/s
Energy fluence (15-150 keV)             : 2.0796e-07 ( -4.32918e-08  4.43763e-08 ) ergs/cm2
Cutoff power-law model
Time interval is from   -2.960 sec. to    5.328 sec.
Spectral model in the cutoff power-law:
------------------------------------------------------------
Parameters  : value       lower 90%   higher 90%
Photon index: -1.30275     ( -0.788425   1.2137 )
Epeak [keV] : 65.5973      ( -50.3606 -65.53 )
Norm@50keV  : 5.02233E-03    ( -0.00503294   0.0179071 )
------------------------------------------------------------
#Fit statistic : Chi-Squared =          46.47 using 59 PHA bins.
# Reduced chi-squared =         0.8299 for     56 degrees of freedom
# Null hypothesis probability =   8.140275e-01

Photon flux (15-150 keV)    in 8.288 sec: 0.367942 ( -0.067493  0.067596 ) ph/cm2/s
Energy fluence (15-150 keV)             : 2.0024e-07 ( -4.51405e-08  4.68642e-08 ) ergs/cm2
1-s peak spectrum fit
Power-law model
Time interval is from    0.916 sec. to    1.916 sec.

Spectral model in power-law:
------------------------------------------------------------
Parameters  : value       lower 90%   higher 90%
Photon index: -1.30185     ( -0.343366   0.347462 )
Norm@50keV  : 7.93181E-03    ( -0.0016454   0.00164409 )
------------------------------------------------------------
#Fit statistic : Chi-Squared =          53.37 using 59 PHA bins.
# Reduced chi-squared =         0.9364 for     57 degrees of freedom
# Null hypothesis probability =   6.119647e-01

Photon flux (15-150 keV)    in 1 sec: 0.946617 ( -0.20268  0.203503 ) ph/cm2/s
Energy fluence (15-150 keV)             : 7.83556e-08 ( -1.75589e-08  1.7706e-08 ) ergs/cm2
Cutoff power-law model
Time interval is from    0.916 sec. to    1.916 sec.
Spectral model in the cutoff power-law:
------------------------------------------------------------
Parameters  : value       lower 90%   higher 90%
Photon index: -0.525831     ( -0.97253   1.91715 )
Epeak [keV] : 105.624      (   )
Norm@50keV  : 1.81230E-02    (     )
------------------------------------------------------------
#Fit statistic : Chi-Squared =          52.43 using 59 PHA bins.
# Reduced chi-squared =         0.9363 for     56 degrees of freedom
# Null hypothesis probability =   6.107376e-01

Photon flux (15-150 keV)    in 1 sec: 0.920419 ( -0.210968  0.209471 ) ph/cm2/s
Energy fluence (15-150 keV)             : 7.61868e-08 ( -1.80809e-08  1.82519e-08 ) ergs/cm2
Time-resolved spectra
Distribution
T90 vs. Hardness ratio plot
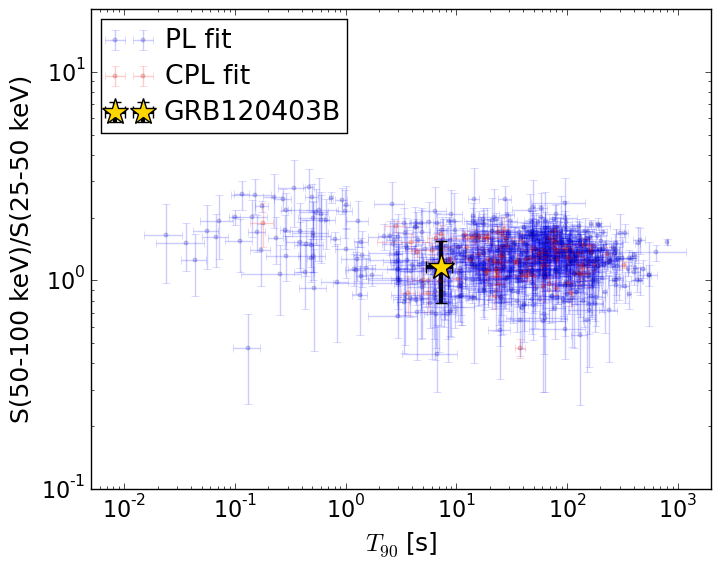
T90                                   = 7.284 sec.
Hardness ratio (energy fluence ratio) = 1.16043269564
S(15-50 keV) vs. S(50-150 keV) plot
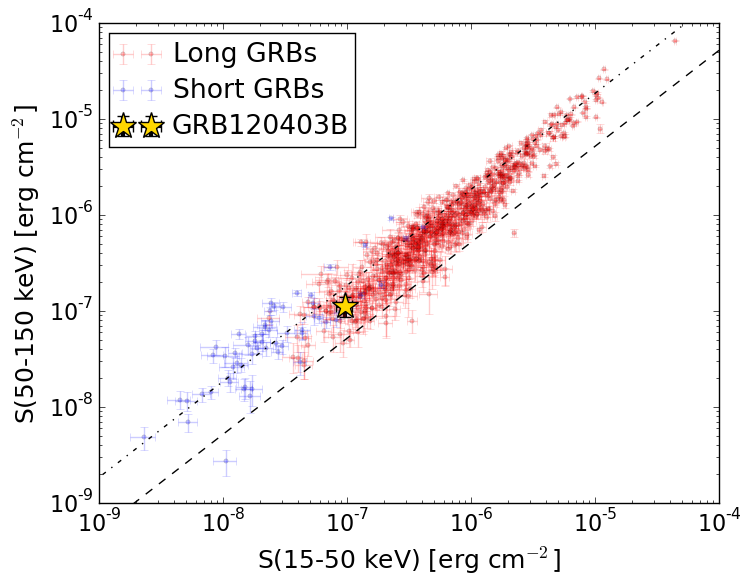
S(15-50 keV)  = 9.593555e-08
S(50-150 keV) = 1.1202332e-07
The dash-dotted line and the dashed line traces the fluences calculated from the Band function with Epeak = 15 and 150 keV, respectively. Both lines assume a canonical values of alpha = -1 and beta = -2.5.
Mask shadow pattern
IMX = -2.586676173132431E-01, IMY = 5.331216493044129E-01
Spacecraft aspect plot
Bright source in the pre-burst/pre-slew/post-slew images
Pre-burst image of 15-350 keV band
Time interval of the image:
-239.544000 -2.960000

# RAcent  DECcent POSerr Theta    Phi  PeakCts   SNR AngSep     Name
#  [deg]    [deg]    ['] [deg]  [deg]                   [']
135.5427 -40.5474    1.0  24.9   10.9   2.2412  11.7    0.8	Vela X-1
170.2062 -60.6001   26.2   4.6  168.2  -0.0773  -0.4    3.5	Cen X-3
186.6561 -62.7860    0.8  12.6  177.6   2.7218  15.2    0.9	GX 301-2
156.7784 -18.6250    3.0  41.1   55.9   2.0402   3.8 ------	UNKNOWN
179.6549 -68.7470    2.4  12.0 -151.1   0.7711   4.9 ------	UNKNOWN
 80.9007 -41.4260    4.3  50.6  -44.7   2.4650   2.7 ------	UNKNOWN
 81.6671 -39.1189    3.1  52.0  -42.2   3.3412   3.8 ------	UNKNOWN
Pre-slew background subtracted image of 15-350 keV band
Time interval of the image:
-2.960000 5.328000

# RAcent  DECcent POSerr Theta    Phi  PeakCts   SNR AngSep     Name
#  [deg]    [deg]    ['] [deg]  [deg]                   [']
135.3861 -40.4508   11.6  25.0   10.7  -0.0291  -1.0    9.0	Vela X-1
169.9757 -60.7215    6.6   4.5  169.9   0.0460   1.7   11.6	Cen X-3
186.2994 -62.9017    0.0  12.4  178.2  -0.0332  -1.2   12.6	GX 301-2
210.9721 -33.3879    2.9  41.6  135.9   0.2961   4.0 ------	UNKNOWN
204.3173 -61.4376    2.3  20.9  175.9   0.1409   5.1 ------	UNKNOWN
 54.3051 -89.0291    1.4  30.6 -115.9   0.3582   8.5 ------	UNKNOWN
286.4167 -68.8699    2.5  45.6 -142.1   0.2853   4.6 ------	UNKNOWN
Post-slew image of 15-350 keV band
Time interval of the image: