Analysis Summary
Notes:
- 1) No attempt has been made to eliminate the non-significant decimal places.
- 2) This batgrbproduct analysis is done using the HEASARC data.
- 3) This batgrbproduct analysis is using the flight position for the mask-weighting calculation.
======================================================================
BAT GRB EVENT DATA PROCESSING REPORT
Process Script Ver: batgrbproduct v2.46
Process Start Time: Mon Jan 13 04:43:55 EST 2014
Host Name: batevent1
Current Working Dir: /local/data/batevent/batevent_reproc/trigger519380
======================================================================
Trigger: 00519380 Segment: 000
BAT Trigger Time: 355236670.464 [s; MET]
Trigger Stop: 355236674.56 [s; MET]
UTC: 2012-04-04T12:51:02.398680 [includes UTCF correction]
Where From?: TDRSS position message
BAT
RA: 235.011568820105 Dec: 12.8818416005109 [deg; J2000]
Catalogged Source?: NO
Point Source?: YES
GRB Indicated?: YES [ by BAT flight software ]
Image S/N Ratio: 11.42
Image Trigger?: NO
Rate S/N Ratio: 9.1104335791443 [ if not an image trigger ]
Image S/N Ratio: 11.42
Analysis Position: [ source = BAT ]
RA: 235.011568820105 Dec: 12.8818416005109 [deg; J2000]
Refined Position: [ source = BAT pre-slew burst ]
RA: 235.001396175834 Dec: 12.8823655625681 [deg; J2000]
{ 15h 40m 00.3s , +12d 52' 56.5" }
+/- 1.23657011549787 [arcmin] (estimated 90% radius based on SNR)
+/- 0.504010405914631 [arcmin] (formal 1-sigma fit error)
SNR: 22.4583224717566
Angular difference between the analysis and refined position is 0.595826 arcmin
Partial Coding Fraction: 0.4921875 [ including projection effects ]
Duration
T90: 38.7239999175072 +/- 4.09199215645658
Measured from: -4.42399996519089
to: 34.2999999523163 [s; relative to TRIGTIME]
T50: 17.4879999756813 +/- 2.87687884838602
Measured from: 2.41600000858307
to: 19.9039999842644 [s; relative to TRIGTIME]
Fluence
Peak Flux (peak 1 second)
Measured from: 3.28799998760223
to: 4.28799998760223 [s; relative to TRIGTIME]
Total Fluence
Measured from: -7.30799996852875
to: 38.4520000219345 [s; relative to TRIGTIME]
Band 1 Band 2 Band 3 Band 4
15-25 25-50 50-100 100-350 keV
Total 0.833233 1.050652 0.624662 0.161767
0.059704 0.059428 0.052816 0.048608 [error]
Peak 0.040435 0.054232 0.031727 0.015041
0.009051 0.009143 0.007988 0.007330 [error]
[ fluence units of on-axis counts / fully illuminated detector ]
======================================================================
====== Table of the duration information =============================
Value tstart tstop
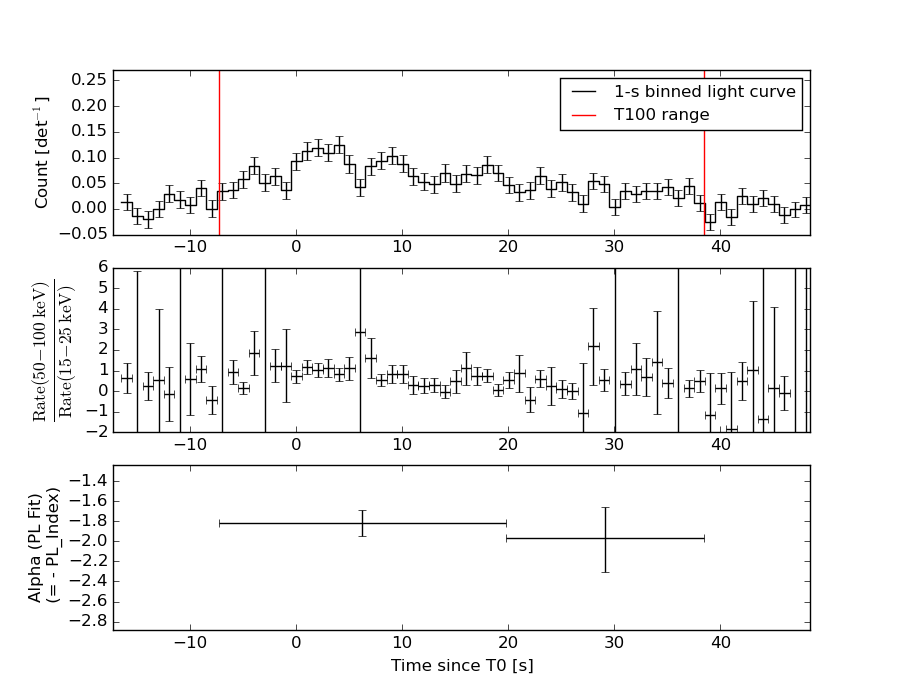
T100 45.760 -7.308 38.452
T90 38.724 -4.424 34.300
T50 17.488 2.416 19.904
Peak 1.000 3.288 4.288
====== Spectral Analysis Summary =====================================
Model : spectral model: simple power-law (PL) and cutoff power-law (CPL)
Ph_index : photon index: E^{Ph_index}
Ph_90err : 90% error of the photon index
Epeak : Epeak in keV
Epeak_90err: 90% error of Epeak
Norm : normalization at 50 keV in both the PL model and CPL model
Nomr_90err : 90% error of the normalization
chi2 : Chi-Squared
dof : degree of freedo
=== Time-averaged spectral analysis ===
(Best model with acceptable fit: N/A)
Model Ph_index Ph_90err_low Ph_90err_hi Epeak Epeak_90err_low Epeak_90err_hi Norm Nomr_90err_low Norm_90err_hi chi2 dof
PL -1.853 -0.132 0.129 - - - 3.75e-03 -2.86e-04 2.82e-04 72.830 57
CPL -1.814 -0.633 0.500 226.294 -226.283 -226.294 3.93e-03 -1.83e-03 3.21e-03 72.810 56
=== 1-s peak spectral analysis ===
(Best model with acceptable fit: PL)
Model Ph_index Ph_90err_low Ph_90err_hi Epeak Epeak_90err_low Epeak_90err_hi Norm Nomr_90err_low Norm_90err_hi chi2 dof
PL -1.839 -0.391 0.367 - - - 8.28e-03 -1.97e-03 1.90e-03 70.040 57
CPL -1.828 -1.469 1.791 664.752 N/A N/A 8.41e-03 N/A N/A 70.040 56
=== Fluence/Peak Flux Summary ===
Model Band1 Band2 Band3 Band4 Band5 Total
15-25 25-50 50-100 100-350 15-150 15-350 keV
Fluence PL 3.05e-07 4.52e-07 5.01e-07 1.05e-06 1.58e-06 2.30e-06 erg/cm2
90%_error_low -3.35e-08 -3.10e-08 -5.24e-08 -2.12e-07 -1.20e-07 -2.62e-07 erg/cm2
90%_error_hi 3.46e-08 3.10e-08 5.24e-08 2.46e-07 1.21e-07 2.87e-07 erg/cm2
Peak flux PL 4.73e-01 3.89e-01 2.18e-01 1.80e-01 1.16e+00 1.26e+00 ph/cm2/s
90%_error_low -1.44e-01 -7.95e-02 -6.64e-02 -8.86e-02 -2.37e-01 -2.55e-01 ph/cm2/s
90%_error_hi 1.54e-01 7.92e-02 6.66e-02 1.30e-01 2.38e-01 2.56e-01 ph/cm2/s
Fluence CPL 3.03e-07 4.54e-07 5.02e-07 9.79e-07 1.57e-06 2.24e-06 erg/cm2
90%_error_low -3.90e-08 -3.27e-08 -5.27e-08 -5.29e-07 -1.37e-07 -5.51e-07 erg/cm2
90%_error_hi 3.82e-08 3.86e-08 5.35e-08 6.20e-08 1.25e-07 4.90e-07 erg/cm2
Peak flux CPL 4.73e-01 3.89e-01 2.18e-01 1.80e-01 1.16e+00 1.26e+00 ph/cm2/s
90%_error_low -1.59e-01 -7.86e-02 -6.56e-02 -9.78e-02 -2.43e-01 -3.23e-01 ph/cm2/s
90%_error_hi 1.56e-01 8.08e-02 6.86e-02 1.72e-01 2.37e-01 2.52e-01 ph/cm2/s
======================================================================
Image
Pre-slew 15.0-350.0 keV image (Event data)
#   RAcent    DECcent   POSerr    Theta     Phi              Peak Cts       SNR   Name
  235.0014    12.8824   0.0086    41.6928  -175.8384         2.7893551     22.458 TRIG_00519380

Foreground time interval of the image:
 -7.308  35.637 (delta_t =  42.945 [sec])
Background time interval of the image:
-239.464 -177.424 (delta_t =  62.040 [sec])
-119.464  -7.308 (delta_t = 112.156 [sec])
Light Curves
Note: The mask-weighted lightcurves have units of either count/det or counts/sec/det, where a det is 0.4 x 0.4 = 0.16 sq cm.
Full-time range; 1 s binning
Other quick-look light curves:
- 64 ms binning (zoomed)
- 16 ms binning (zoomed)
- 8 ms binning (zoomed)
- 2 ms binning (zoomed)
- SN=5 or 10 s binning (full-time range)
- Raw light curve
Spectra
- 64 ms binning (zoomed)
- 16 ms binning (zoomed)
- 8 ms binning (zoomed)
- 2 ms binning (zoomed)
- SN=5 or 10 s binning (full-time range)
- Raw light curve
Spectra
Notes:
- 1) The fitting includes the systematic errors.
- 2) When the burst includes telescope slew time periods, the fitting uses an average response file made from multiple 5-s response files through out the slew time plus single time preiod for the non-slew times, and weighted by the total counts in the corresponding time period using addrmf. An average response file is needed becuase a spectral fit using the pre-slew DRM will introduce some errors in both a spectral shape and a normalization if the PHA file contains a lot of the slew/post-slew time interval.
- 3) For fits to more complicated models (e.g. a power-law over a cutoff power-law), the BAT team has decided to require a chi-square improvement of more than 6 for each extra dof.
Time averaged spectrum fit using the average DRM
Power-law model
Time interval is from   -7.308 sec. to   38.452 sec.

Spectral model in power-law:
------------------------------------------------------------
Parameters  : value       lower 90%   higher 90%
Photon index: -1.85266     ( -0.131618   0.128624 )
Norm@50keV  : 3.74612E-03    ( -0.000285902   0.000282385 )
------------------------------------------------------------
#Fit statistic : Chi-Squared =          72.83 using 59 PHA bins.
# Reduced chi-squared =          1.278 for     57 degrees of freedom
# Null hypothesis probability =   7.709865e-02

Photon flux (15-150 keV)    in 45.76 sec: 0.527156 ( -0.03705  0.037158 ) ph/cm2/s
Energy fluence (15-150 keV)             : 1.5764e-06 ( -1.20016e-07  1.21086e-07 ) ergs/cm2
Cutoff power-law model

Time interval is from   -7.308 sec. to   38.452 sec.
Spectral model in the cutoff power-law:
------------------------------------------------------------
Parameters  : value       lower 90%   higher 90%
Photon index: -1.81414     ( -0.633162   0.50068 )
Epeak [keV] : 226.294      ( -227.819 -227.829 )
Norm@50keV  : 3.92683E-03    ( -0.00182712   0.00320822 )
------------------------------------------------------------
#Fit statistic : Chi-Squared =          72.81 using 59 PHA bins.
# Reduced chi-squared =          1.300 for     56 degrees of freedom
# Null hypothesis probability =   6.503242e-02

Photon flux (15-150 keV)    in 45.76 sec: 0.526066 ( -0.039248  0.038014 ) ph/cm2/s
Energy fluence (15-150 keV)             : 1.571e-06 ( -1.36681e-07  1.25039e-07 ) ergs/cm2
1-s peak spectrum fit
Power-law model
Time interval is from    3.288 sec. to    4.288 sec.

Spectral model in power-law:
------------------------------------------------------------
Parameters  : value       lower 90%   higher 90%
Photon index: -1.83909     ( -0.39146   0.366896 )
Norm@50keV  : 8.28486E-03    ( -0.00197214   0.00189532 )
------------------------------------------------------------
#Fit statistic : Chi-Squared =          70.04 using 59 PHA bins.
# Reduced chi-squared =          1.229 for     57 degrees of freedom
# Null hypothesis probability =   1.149513e-01

Photon flux (15-150 keV)    in 1 sec: 1.15946 ( -0.237263  0.23775 ) ph/cm2/s
Energy fluence (15-150 keV)             : 7.62026e-08 ( -1.76926e-08  1.81644e-08 ) ergs/cm2
Cutoff power-law model
Time interval is from    3.288 sec. to    4.288 sec.
Spectral model in the cutoff power-law:
------------------------------------------------------------
Parameters  : value       lower 90%   higher 90%
Photon index: -1.8278     ( -1.45961   1.80023 )
Epeak [keV] : 664.752      (   )
Norm@50keV  : 8.40823E-03    (     )
------------------------------------------------------------
#Fit statistic : Chi-Squared =          70.04 using 59 PHA bins.
# Reduced chi-squared =          1.251 for     56 degrees of freedom
# Null hypothesis probability =   9.821779e-02

Photon flux (15-150 keV)    in 1 sec: 1.15966 ( -0.242934  0.23743 ) ph/cm2/s
Energy fluence (15-150 keV)             : 0 ( 0  0 ) ergs/cm2
Time-resolved spectra
Distribution
T90 vs. Hardness ratio plot
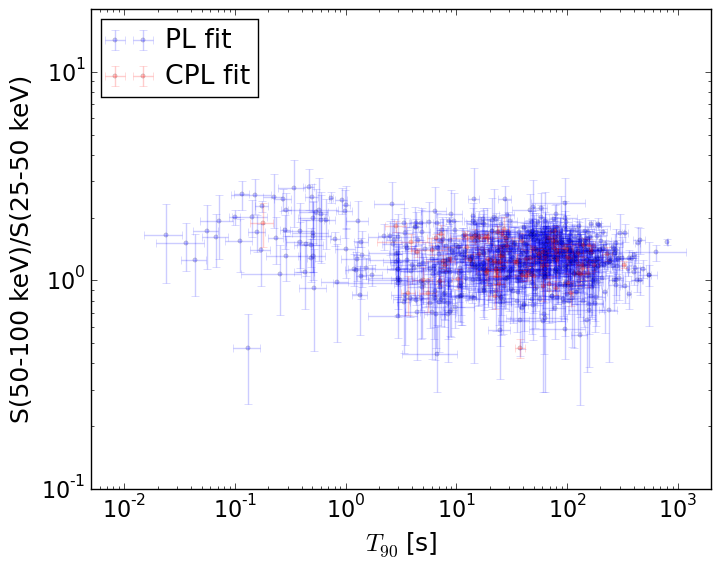
T90                                   = N/A sec.
Hardness ratio (energy fluence ratio) = N/A
S(15-50 keV) vs. S(50-150 keV) plot
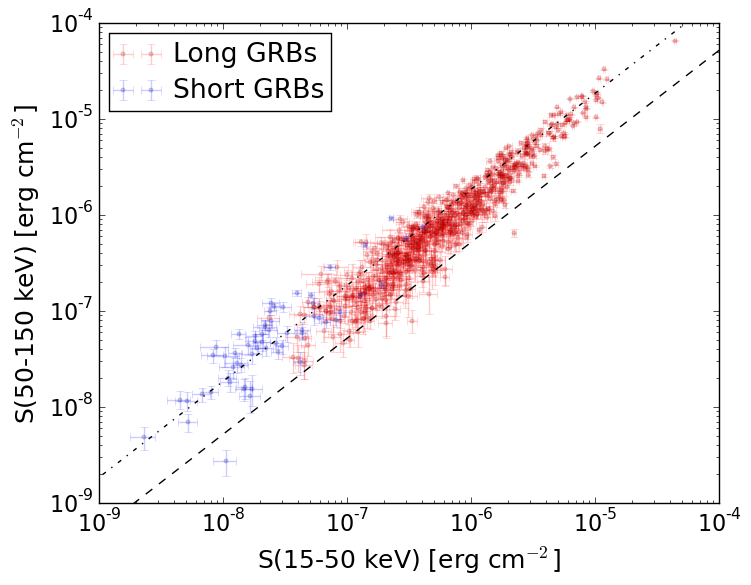
S(15-50 keV)  = N/A
S(50-150 keV) = N/A
The dash-dotted line and the dashed line traces the fluences calculated from the Band function with Epeak = 15 and 150 keV, respectively. Both lines assume a canonical values of alpha = -1 and beta = -2.5.
Mask shadow pattern
IMX = -8.883938367066269E-01, IMY = 6.464168030272782E-02
Spacecraft aspect plot
Bright source in the pre-burst/pre-slew/post-slew images
Pre-burst image of 15-350 keV band
Time interval of the image:
-239.464000 -177.423600
-119.464000 -7.308000

# RAcent  DECcent POSerr Theta    Phi  PeakCts   SNR AngSep     Name
#  [deg]    [deg]    ['] [deg]  [deg]                   [']
170.2736 -60.5507   12.9  50.1  -19.0   0.3526   0.9    4.5	Cen X-3
186.6687 -62.7966    3.9  47.3  -29.1   1.0874   2.9    1.6	GX 301-2
244.9715 -15.6364    0.3  37.3 -128.0  11.0429  36.4    0.5	Sco X-1
247.9035  22.4770    2.6  57.2 -173.9   4.0891   4.5 ------	UNKNOWN
220.0899 -21.0310    2.5  13.7 -113.7   0.7875   4.7 ------	UNKNOWN
Pre-slew background subtracted image of 15-350 keV band
Time interval of the image:
-7.308000 35.636600

# RAcent  DECcent POSerr Theta    Phi  PeakCts   SNR AngSep     Name
#  [deg]    [deg]    ['] [deg]  [deg]                   [']
170.4776 -60.6587    7.2  50.1  -19.2   0.2774   1.6    5.2	Cen X-3
186.3170 -62.7789    4.9  47.3  -28.9  -0.3893  -2.3    9.3	GX 301-2
244.9477 -15.5207    3.9  37.3 -128.2   0.3830   3.0    7.4	Sco X-1
177.3688  -7.3766    2.6  29.7   65.2   0.5514   4.5 ------	UNKNOWN
235.0014  12.8824    0.5  41.7 -175.8   2.7891  22.5 ------	UNKNOWN
237.5339 -43.4317    2.6  37.2  -79.9   0.8639   4.4 ------	UNKNOWN
214.2763 -67.3817    2.7  50.2  -45.1   1.5608   4.3 ------	UNKNOWN
241.6313 -46.2916    3.2  41.1  -78.7   1.1087   3.5 ------	UNKNOWN
Post-slew image of 15-350 keV band
Time interval of the image:
117.836600 962.610900

# RAcent  DECcent POSerr Theta    Phi  PeakCts   SNR AngSep     Name
#  [deg]    [deg]    ['] [deg]  [deg]                   [']
244.9706 -15.6411    0.1  30.1    3.2  54.6340  79.4    0.5	Sco X-1
254.4888  35.2964    1.3  28.5 -122.7   8.0306   9.2    3.2	Her X-1
256.0595 -37.8349    8.4  54.4    2.2   3.3680   1.4    3.5	4U 1700-377
256.5530 -36.4098    6.4  53.3    0.9   3.4134   1.8    5.7	GX 349+2
262.9196 -24.8333    9.8  46.5  -13.3   1.3106   1.2    7.2	GX 1+4
268.2701  -1.4241    4.1  35.9  -46.5   2.8160   2.8    6.1	SW J1753.5-0127
270.1953 -25.1654   16.1  51.2  -19.4  -1.0429  -0.7    7.1	GX 5-1
270.3946 -25.7172   22.6  51.7  -19.1  -0.7659  -0.5    5.2	GRS 1758-258
274.0848 -13.8263    0.0  47.0  -34.2   2.3569   1.8   13.4	GX 17+2
275.9249 -30.3671  108.5  58.4  -19.0   0.3595   0.1    0.0	H1820-303
262.8275 -33.7534    6.2  53.6   -6.2   3.0922   1.9    9.4	GX 354-0
250.5470 -31.5728    2.1  46.8    4.4   6.1882   5.5 ------	UNKNOWN
255.4572 -27.6126    2.5  45.0   -3.3   5.0088   4.6 ------	UNKNOWN
250.5416  28.1659    2.6  21.1 -116.5   3.0454   4.4 ------	UNKNOWN
251.8492  42.2852    3.3  32.8 -134.2   3.3419   3.5 ------	UNKNOWN