Analysis Summary
Notes:
- 1) No attempt has been made to eliminate the non-significant decimal places.
- 2) This batgrbproduct analysis is done using the HEASARC data.
- 3) This batgrbproduct analysis is using the flight position for the mask-weighting calculation.
======================================================================
BAT GRB EVENT DATA PROCESSING REPORT
Process Script Ver: batgrbproduct v2.46
Process Start Time: Mon Jan 13 04:39:17 EST 2014
Host Name: batevent1
Current Working Dir: /local/data/batevent/batevent_reproc/trigger520658
======================================================================
Trigger: 00520658 Segment: 000
BAT Trigger Time: 356771531.776 [s; MET]
Trigger Stop: 356771535.872 [s; MET]
UTC: 2012-04-22T07:12:03.648220 [includes UTCF correction]
Where From?: TDRSS position message
BAT
RA: 136.929034138057 Dec: 14.0064324830064 [deg; J2000]
Catalogged Source?: NO
Point Source?: YES
GRB Indicated?: YES [ by BAT flight software ]
Image S/N Ratio: 8.33
Image Trigger?: NO
Rate S/N Ratio: 11.8321595661992 [ if not an image trigger ]
Image S/N Ratio: 8.33
Analysis Position: [ source = BAT ]
RA: 136.929034138057 Dec: 14.0064324830064 [deg; J2000]
Refined Position: [ source = BAT pre-slew burst ]
RA: 136.929 Dec: 14.0064 [deg; J2000]
{ 09h 07m 43.0s , +14d 00' 23.0" }
+/- 2.14850083649 [arcmin] (estimated 90% radius based on SNR)
SNR: 10.2022479276
Angular difference between the analysis and refined position is 0.002784 arcmin
Partial Coding Fraction: 0.6875 [ including projection effects ]
Duration
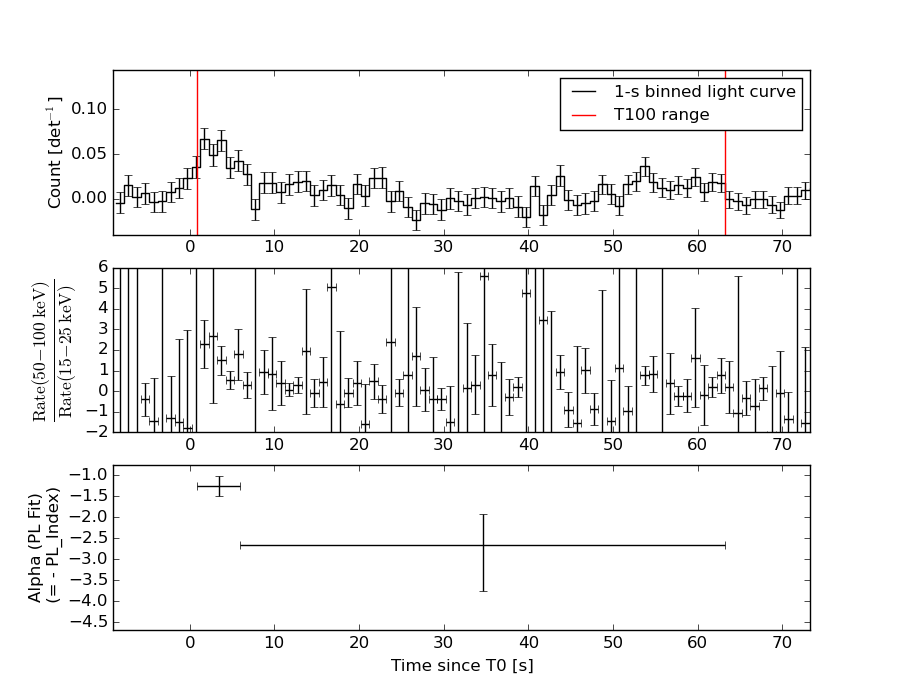
T90: 60.3520000576973 +/- 5.72791058369858
Measured from: 1.18399995565414
to: 61.5360000133514 [s; relative to TRIGTIME]
T50: 49.6000000238419 +/- 36.9015364662264
Measured from: 3.74399995803833
to: 53.3439999818802 [s; relative to TRIGTIME]
Fluence
Peak Flux (peak 1 second)
Measured from: 0.843999981880188
to: 1.84399998188019 [s; relative to TRIGTIME]
Total Fluence
Measured from: 0.863999962806702
to: 63.2639999985695 [s; relative to TRIGTIME]
Band 1 Band 2 Band 3 Band 4
15-25 25-50 50-100 100-350 keV
Total 0.227268 0.221272 0.138424 0.060864
0.046741 0.048558 0.043185 0.038802 [error]
Peak 0.017411 0.023975 0.026005 0.007563
0.006433 0.006483 0.006161 0.005544 [error]
[ fluence units of on-axis counts / fully illuminated detector ]
======================================================================
====== Table of the duration information =============================
Value tstart tstop
T100 62.400 0.864 63.264
T90 60.352 1.184 61.536
T50 49.600 3.744 53.344
Peak 1.000 0.844 1.844
====== Spectral Analysis Summary =====================================
Model : spectral model: simple power-law (PL) and cutoff power-law (CPL)
Ph_index : photon index: E^{Ph_index}
Ph_90err : 90% error of the photon index
Epeak : Epeak in keV
Epeak_90err: 90% error of Epeak
Norm : normalization at 50 keV in both the PL model and CPL model
Nomr_90err : 90% error of the normalization
chi2 : Chi-Squared
dof : degree of freedo
=== Time-averaged spectral analysis ===
(Best model with acceptable fit: PL)
Model Ph_index Ph_90err_low Ph_90err_hi Epeak Epeak_90err_low Epeak_90err_hi Norm Nomr_90err_low Norm_90err_hi chi2 dof
PL -1.986 -0.475 0.416 - - - 5.61e-04 -1.75e-04 1.66e-04 50.360 57
CPL -2.243 -0.116 2.444 97.009 N/A N/A 4.06e-04 N/A N/A 50.300 56
=== 1-s peak spectral analysis ===
(Best model with acceptable fit: PL)
Model Ph_index Ph_90err_low Ph_90err_hi Epeak Epeak_90err_low Epeak_90err_hi Norm Nomr_90err_low Norm_90err_hi chi2 dof
PL -1.002 -0.471 0.509 - - - 4.97e-03 -1.30e-03 1.28e-03 58.220 57
CPL -0.867 0.867 2.398 481.676 -481.676 -481.676 5.70e-03 N/A N/A 58.200 56
=== Fluence/Peak Flux Summary ===
Model Band1 Band2 Band3 Band4 Band5 Total
15-25 25-50 50-100 100-350 15-150 15-350 keV
Fluence PL 7.07e-08 9.67e-08 9.76e-08 1.79e-07 3.22e-07 4.44e-07 erg/cm2
90%_error_low -2.03e-08 -2.21e-08 -3.93e-08 -1.09e-07 -9.02e-08 -1.64e-07 erg/cm2
90%_error_hi 2.08e-08 2.16e-08 4.23e-08 1.91e-07 9.61e-08 2.31e-07 erg/cm2
Peak flux PL 1.27e-01 1.72e-01 1.72e-01 3.10e-01 5.72e-01 7.82e-01 ph/cm2/s
90%_error_low -6.28e-02 -5.79e-02 -4.93e-02 -1.59e-01 -1.51e-01 -2.15e-01 ph/cm2/s
90%_error_hi 7.67e-02 5.56e-02 4.80e-02 2.50e-01 1.52e-01 2.40e-01 ph/cm2/s
Fluence CPL 6.90e-08 9.56e-08 8.37e-08 1.99e-07 3.01e-07 4.58e-07 erg/cm2
90%_error_low -2.45e-08 -6.28e-08 -3.30e-08 -1.96e-07 -1.87e-07 -1.74e-07 erg/cm2
90%_error_hi 2.23e-08 2.34e-08 3.67e-08 6.49e-08 9.89e-08 1.33e-07 erg/cm2
Peak flux CPL 1.23e-01 1.73e-01 1.75e-01 2.68e-01 5.68e-01 7.39e-01 ph/cm2/s
90%_error_low -8.03e-02 -5.89e-02 -5.15e-02 -2.68e-01 -1.59e-01 -3.00e-01 ph/cm2/s
90%_error_hi 8.01e-02 6.08e-02 6.09e-02 1.72e-01 1.55e-01 2.73e-01 ph/cm2/s
======================================================================
Image
Pre-slew 25.0-100.0 keV image (Event data)
#RAcent DECcent POSerr Theta  Phi  Peak_Cts  SNR Name
136.929 14.006 0.000 23.543 -110.991 0.177 10.202 TRIG_00520658

Image time interval: 0.000 to 4.096 [sec]
Light Curves
Note: The mask-weighted lightcurves have units of either count/det or counts/sec/det, where a det is 0.4 x 0.4 = 0.16 sq cm.
Full-time range; 1 s binning
Other quick-look light curves:
- 64 ms binning (zoomed)
- 16 ms binning (zoomed)
- 8 ms binning (zoomed)
- 2 ms binning (zoomed)
- SN=5 or 10 s binning (full-time range)
- Raw light curve
Spectra
- 64 ms binning (zoomed)
- 16 ms binning (zoomed)
- 8 ms binning (zoomed)
- 2 ms binning (zoomed)
- SN=5 or 10 s binning (full-time range)
- Raw light curve
Spectra
Notes:
- 1) The fitting includes the systematic errors.
- 2) When the burst includes telescope slew time periods, the fitting uses an average response file made from multiple 5-s response files through out the slew time plus single time preiod for the non-slew times, and weighted by the total counts in the corresponding time period using addrmf. An average response file is needed becuase a spectral fit using the pre-slew DRM will introduce some errors in both a spectral shape and a normalization if the PHA file contains a lot of the slew/post-slew time interval.
- 3) For fits to more complicated models (e.g. a power-law over a cutoff power-law), the BAT team has decided to require a chi-square improvement of more than 6 for each extra dof.
Time averaged spectrum fit using the average DRM
Power-law model

Time interval is from    0.864 sec. to   63.264 sec.

Spectral model in power-law:
------------------------------------------------------------
Parameters  : value       lower 90%   higher 90%
Photon index: -1.98649     ( -0.474842   0.416196 )
Norm@50keV  : 5.60596E-04    ( -0.00017508   0.000165992 )
------------------------------------------------------------
#Fit statistic : Chi-Squared =          50.36 using 59 PHA bins.
# Reduced chi-squared =         0.8836 for     57 degrees of freedom
# Null hypothesis probability =   7.205352e-01

Photon flux (15-150 keV)    in 62.4 sec: 8.35774E-02 ( -0.0181224  0.0181286 ) ph/cm2/s
Energy fluence (15-150 keV)             : 3.2243e-07 ( -9.01692e-08  9.61272e-08 ) ergs/cm2
Cutoff power-law model
Time interval is from    0.864 sec. to   63.264 sec.
Spectral model in the cutoff power-law:
------------------------------------------------------------
Parameters  : value       lower 90%   higher 90%
Photon index: -2.24313     ( -0.116347   2.44409 )
Epeak [keV] : 97.0093      (   )
Norm@50keV  : 4.06243E-04    (     )
------------------------------------------------------------
#Fit statistic : Chi-Squared =          50.30 using 59 PHA bins.
# Reduced chi-squared =         0.8982 for     56 degrees of freedom
# Null hypothesis probability =   6.896278e-01

Photon flux (15-150 keV)    in 62.4 sec: 7.62196E-02 ( -0.0281952  0.0255684 ) ph/cm2/s
Energy fluence (15-150 keV)             : 3.0104e-07 ( -1.87454e-07  9.8909e-08 ) ergs/cm2
1-s peak spectrum fit
Power-law model
Time interval is from    0.844 sec. to    1.844 sec.

Spectral model in power-law:
------------------------------------------------------------
Parameters  : value       lower 90%   higher 90%
Photon index: -1.00229     ( -0.471181   0.508608 )
Norm@50keV  : 4.96750E-03    ( -0.00129734   0.00128291 )
------------------------------------------------------------
#Fit statistic : Chi-Squared =          58.22 using 59 PHA bins.
# Reduced chi-squared =          1.021 for     57 degrees of freedom
# Null hypothesis probability =   4.302537e-01

Photon flux (15-150 keV)    in 1 sec: 0.571971 ( -0.150646  0.151675 ) ph/cm2/s
Energy fluence (15-150 keV)             : 5.36785e-08 ( -1.50516e-08  1.53502e-08 ) ergs/cm2
Cutoff power-law model
Time interval is from    0.844 sec. to    1.844 sec.
Spectral model in the cutoff power-law:
------------------------------------------------------------
Parameters  : value       lower 90%   higher 90%
Photon index: -0.86663     ( 0.86663   2.39793 )
Epeak [keV] : 481.676      ( -481.675 -481.675 )
Norm@50keV  : 5.70315E-03    (     )
------------------------------------------------------------
#Fit statistic : Chi-Squared =          58.20 using 59 PHA bins.
# Reduced chi-squared =          1.039 for     56 degrees of freedom
# Null hypothesis probability =   3.943064e-01

Photon flux (15-150 keV)    in 1 sec: 0.568139 ( -0.15919  0.154767 ) ph/cm2/s
Energy fluence (15-150 keV)             : 5.32709e-08 ( -1.63017e-08  1.56419e-08 ) ergs/cm2
Time-resolved spectra
Distribution
T90 vs. Hardness ratio plot
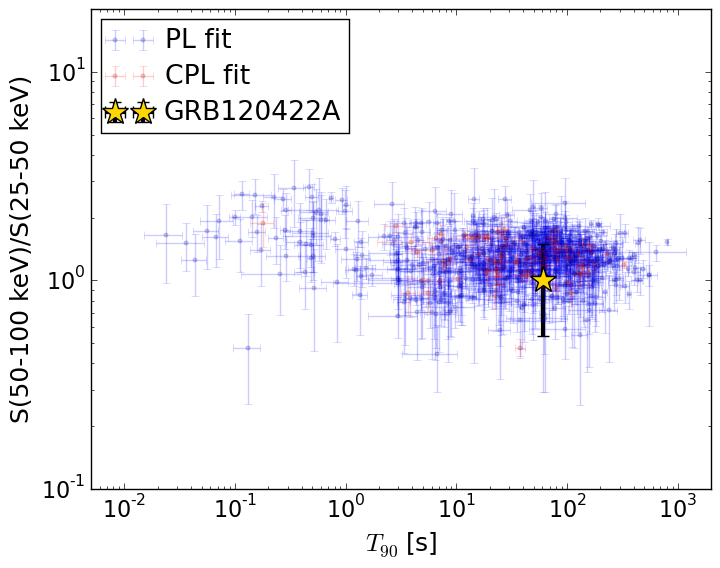
T90                                   = 60.352 sec.
Hardness ratio (energy fluence ratio) = 1.0094390603
S(15-50 keV) vs. S(50-150 keV) plot
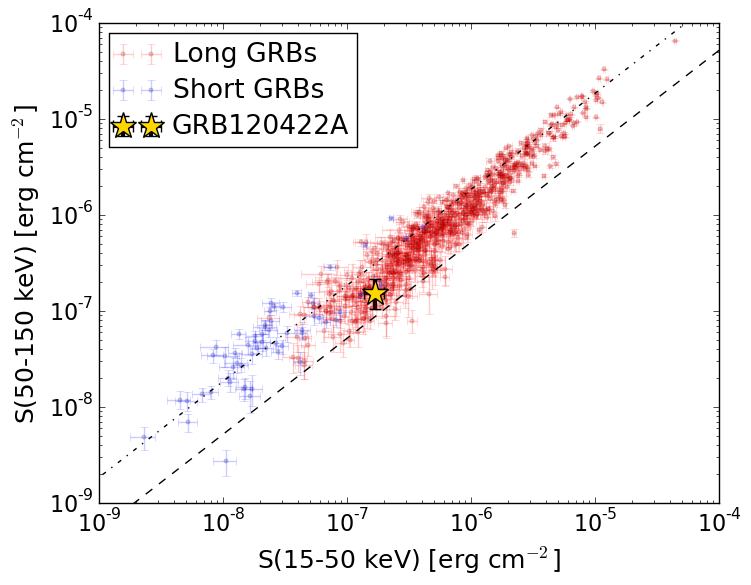
S(15-50 keV)  = 1.673422e-07
S(50-150 keV) = 1.5508798e-07
The dash-dotted line and the dashed line traces the fluences calculated from the Band function with Epeak = 15 and 150 keV, respectively. Both lines assume a canonical values of alpha = -1 and beta = -2.5.
Mask shadow pattern
IMX = -0.156082287016, IMY = 0.406797878943
Spacecraft aspect plot

Bright source in the pre-burst/pre-slew/post-slew images
Pre-burst image of 15-350 keV band
Time interval of the image:
-239.776000 0.864000

# RAcent  DECcent POSerr Theta    Phi  PeakCts   SNR AngSep     Name
#  [deg]    [deg]    ['] [deg]  [deg]                   [']
204.1511  14.9349    2.5  42.1   51.2   2.7104   4.6 ------	UNKNOWN
118.0222 -30.3914    3.7  58.9 -166.0   3.9058   3.1 ------	UNKNOWN
126.7742   6.6039    2.8  34.1 -124.8   1.1414   4.1 ------	UNKNOWN
Pre-slew background subtracted image of 15-350 keV band
Time interval of the image:
0.864000 38.124600

# RAcent  DECcent POSerr Theta    Phi  PeakCts   SNR AngSep     Name
#  [deg]    [deg]    ['] [deg]  [deg]                   [']
136.9113  14.0138    1.7  23.6 -111.0   0.5267   6.8 ------	UNKNOWN
Post-slew image of 15-350 keV band
Time interval of the image:
84.324590 962.238300

# RAcent  DECcent POSerr Theta    Phi  PeakCts   SNR AngSep     Name
#  [deg]    [deg]    ['] [deg]  [deg]                   [']
135.3829 -40.5700   21.7  54.6  165.3   1.4476   0.5    6.7	Vela X-1
176.0434  61.7297    2.4  55.2    5.1   9.6069   4.8 ------	UNKNOWN
142.5127  39.7415    2.8  26.2   -6.5   1.9477   4.1 ------	UNKNOWN
112.4325  55.4360    3.2  45.6  -35.5   3.6084   3.7 ------	UNKNOWN
 93.6995 -21.3549    4.1  55.3 -145.3  11.2192   2.9 ------	UNKNOWN