Analysis Summary
Notes:
- 1) No attempt has been made to eliminate the non-significant decimal places.
- 2) This batgrbproduct analysis is done using the HEASARC data.
- 3) This batgrbproduct analysis is using the flight position for the mask-weighting calculation.
======================================================================
                  BAT GRB EVENT DATA PROCESSING REPORT
    Process Script Ver: batgrbproduct v2.46
    Process Start Time: Mon Jan 13 04:24:10 EST 2014
             Host Name: batevent1
   Current Working Dir: /local/data/batevent/batevent_reproc/trigger522578
======================================================================

  Trigger: 00522578      Segment: 000

  BAT Trigger Time: 359272791.168   [s; MET]
      Trigger Stop: 359272791.68   [s; MET]
               UTC: 2012-05-21T05:59:42.937680    [includes UTCF correction]
       Where From?: TDRSS position message

  BAT
    RA: 148.69332117108   Dec: -49.4193802244313  [deg; J2000]

     Catalogged Source?: NO
     Point Source?:      YES
     GRB Indicated?:     YES    [ by BAT flight software ]
     Image S/N Ratio:    11.48
     Image Trigger?:     NO
     Rate S/N Ratio:     24.6981780704569  [ if not an image trigger ]
     Image S/N Ratio:    11.48

  Analysis Position:   [ source = BAT ]
    RA: 148.69332117108   Dec: -49.4193802244313  [deg; J2000]

  Refined Position:   [ source = BAT pre-slew burst ]
    RA: 148.686940886453   Dec: -49.4244012807195  [deg; J2000]
        { 09h 54m 44.9s , -49d 25' 27.8" }
         +/- 1.75349438379915 [arcmin] (estimated 90% radius based on SNR)
         +/- 0.740366609476014 [arcmin] (formal 1-sigma fit error)
    SNR: 13.6358919896314

  Angular difference between the analysis and refined position is 0.390856 arcmin

  Partial Coding Fraction: 1    [ including projection effects ]

  Duration
     T90: 0.51199996471405 +/- 0.143108374017273
        Measured from: -0.0079999566078186
                   to: 0.504000008106232     [s; relative to TRIGTIME]
     T50: 0.25600004196167 +/- 0.0640000104904175
        Measured from: 0.0559999942779541
                   to: 0.312000036239624     [s; relative to TRIGTIME]


  Fluence
     Peak Flux  (peak 1 second)
        Measured from: -0.187999963760376
                   to: 0.812000036239624     [s; relative to TRIGTIME]
     Total Fluence
        Measured from: -0.0079999566078186
                   to: 0.568000018596649     [s; relative to TRIGTIME]

             Band 1     Band 2     Band 3     Band 4
              15-25      25-50     50-100    100-350     keV
 Total     0.018330   0.042938   0.041515   0.015896
           0.004411   0.004847   0.004633   0.004105 [error]
 Peak      0.012586   0.046076   0.046788   0.018408
           0.005605   0.005971   0.005565   0.004875 [error]

     [ fluence units of on-axis counts / fully illuminated detector ]

======================================================================


====== Table of the duration information =============================

        Value   tstart    tstop
T100    0.576   -0.008    0.568
T90     0.512   -0.008    0.504
T50     0.256    0.056    0.312
Peak    1.000   -0.188    0.812


====== Spectral Analysis Summary =====================================

Model      : spectral model: simple power-law (PL) and cutoff power-law (CPL)
Ph_index   : photon index: E^{Ph_index}
Ph_90err   : 90% error of the photon index
Epeak      : Epeak in keV
Epeak_90err: 90% error of Epeak
Norm       : normalization at 50 keV in both the PL model and CPL model
Nomr_90err : 90% error of the normalization
chi2       : Chi-Squared
dof        : degree of freedo

=== Time-averaged spectral analysis ===
(Best model with acceptable fit: PL)

Model Ph_index Ph_90err_low Ph_90err_hi  Epeak  Epeak_90err_low  Epeak_90err_hi  Norm       Nomr_90err_low    Norm_90err_hi    chi2    dof
PL      -1.009    -0.219      0.225       -           -               -         1.27e-02     -1.59e-03          1.59e-03      47.100   57
CPL     -0.391    -0.714      1.014      142.866      N/A           N/A         2.44e-02        N/A               N/A         45.470   56


=== 1-s peak spectral analysis ===
(Best model with acceptable fit: PL)

Model Ph_index Ph_90err_low Ph_90err_hi  Epeak  Epeak_90err_low  Epeak_90err_hi  Norm       Nomr_90err_low    Norm_90err_hi    chi2    dof
PL      -0.864     -0.244     0.256       -           -               -         7.75e-03     -1.14e-03          1.13e-03      42.380   57
CPL      0.098     -0.973     1.283      127.855     -43.080      5269.475      2.00e-02     -1.21e-02          4.45e-02      39.570   56


=== Fluence/Peak Flux Summary ===

              Model    Band1     Band2     Band3     Band4     Band5     Total
                       15-25     25-50    50-100    100-350    15-150    15-350    keV
Fluence         PL   5.89e-09  1.46e-08  2.91e-08  1.44e-07  7.86e-08  1.94e-07   erg/cm2
      90%_error_low -1.40e-09 -2.17e-09 -4.28e-09 -4.26e-08 -1.11e-08 -4.57e-08   erg/cm2
      90%_error_hi   1.51e-09  2.13e-09  4.24e-09  5.44e-08  1.13e-08  5.62e-08   erg/cm2
Peak flux       PL   1.74e-01  2.56e-01  2.82e-01  5.82e-01  8.89e-01  1.29e+00   ph/cm2/s
      90%_error_low -5.01e-02 -4.82e-02 -4.25e-02 -1.70e-01 -1.30e-01 -2.05e-01   ph/cm2/s
      90%_error_hi   5.62e-02  4.76e-02  4.22e-02  2.14e-01  1.30e-01  2.21e-01   ph/cm2/s

Fluence        CPL   5.12e-09  1.53e-08  3.07e-08  6.40e-08  7.52e-08  1.15e-07   erg/cm2
      90%_error_low -1.70e-09 -2.43e-09 -4.84e-09 -3.98e-08 -1.23e-08 -4.14e-08   erg/cm2
      90%_error_hi   1.80e-09  2.51e-09  5.00e-09  9.68e-08  1.22e-08  9.82e-08   erg/cm2
Peak flux      CPL   1.32e-01  2.64e-01  3.11e-01  2.59e-01  8.52e-01  9.66e-01   ph/cm2/s
      90%_error_low -5.95e-02 -5.50e-02 -5.23e-02 -1.39e-01 -1.35e-01 -2.00e-01   ph/cm2/s
      90%_error_hi   6.86e-02  5.46e-02  5.42e-02  3.45e-01  1.36e-01  3.57e-01   ph/cm2/s

======================================================================
Image
Pre-slew 15.0-350.0 keV image (Event data)
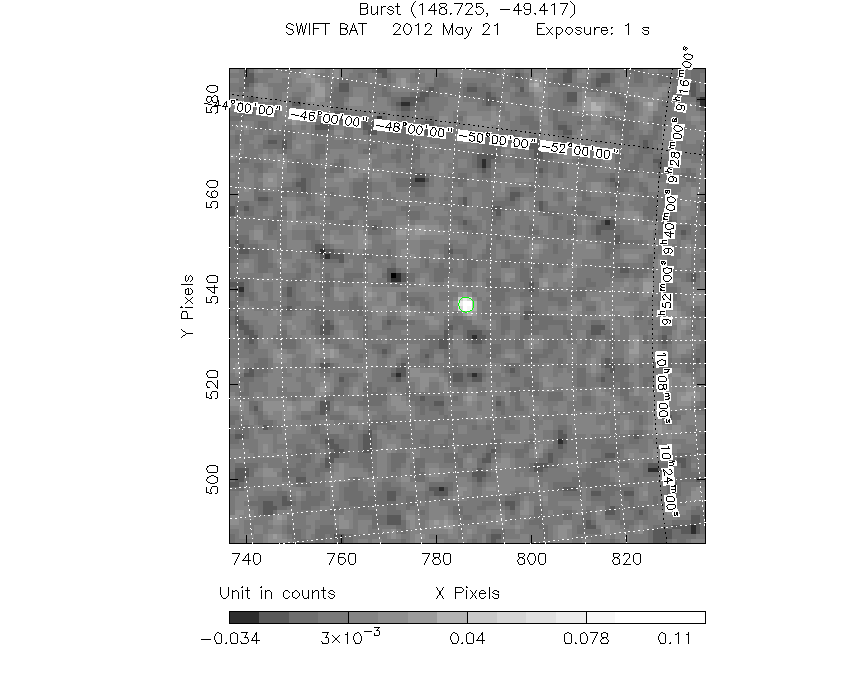
#   RAcent    DECcent   POSerr    Theta     Phi              Peak Cts       SNR   Name
  148.6869   -49.4244   0.0140    13.1385   -32.7837         0.1131131     13.636 TRIG_00522578

Foreground time interval of the image:
 -0.008   0.568 (delta_t =   0.576 [sec])
Background time interval of the image:
-597.067 -578.595 (delta_t =  18.472 [sec])
-239.168  -0.008 (delta_t = 239.160 [sec])
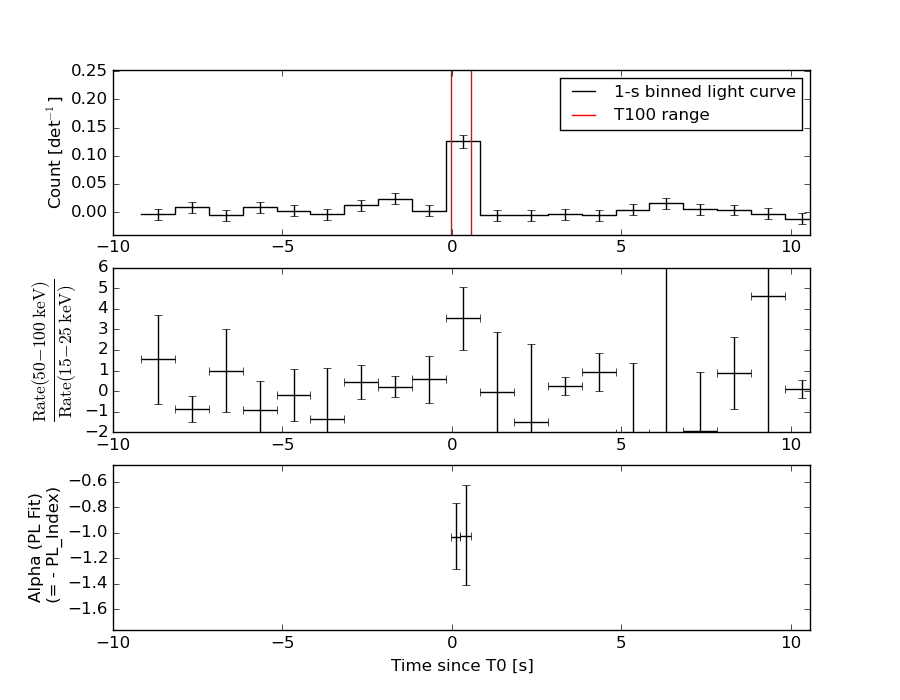
Light Curves
Note: The mask-weighted lightcurves have units of either count/det or counts/sec/det, where a det is 0.4 x 0.4 = 0.16 sq cm.
Full-time range; 1 s binning
Other quick-look light curves:
- 64 ms binning (zoomed)
- 16 ms binning (zoomed)
- 8 ms binning (zoomed)
- 2 ms binning (zoomed)
- SN=5 or 10 s binning (full-time range)
- Raw light curve
Spectra
- 64 ms binning (zoomed)
- 16 ms binning (zoomed)
- 8 ms binning (zoomed)
- 2 ms binning (zoomed)
- SN=5 or 10 s binning (full-time range)
- Raw light curve
Spectra
Notes:
- 1) The fitting includes the systematic errors.
- 2) When the burst includes telescope slew time periods, the fitting uses an average response file made from multiple 5-s response files through out the slew time plus single time preiod for the non-slew times, and weighted by the total counts in the corresponding time period using addrmf. An average response file is needed becuase a spectral fit using the pre-slew DRM will introduce some errors in both a spectral shape and a normalization if the PHA file contains a lot of the slew/post-slew time interval.
- 3) For fits to more complicated models (e.g. a power-law over a cutoff power-law), the BAT team has decided to require a chi-square improvement of more than 6 for each extra dof.
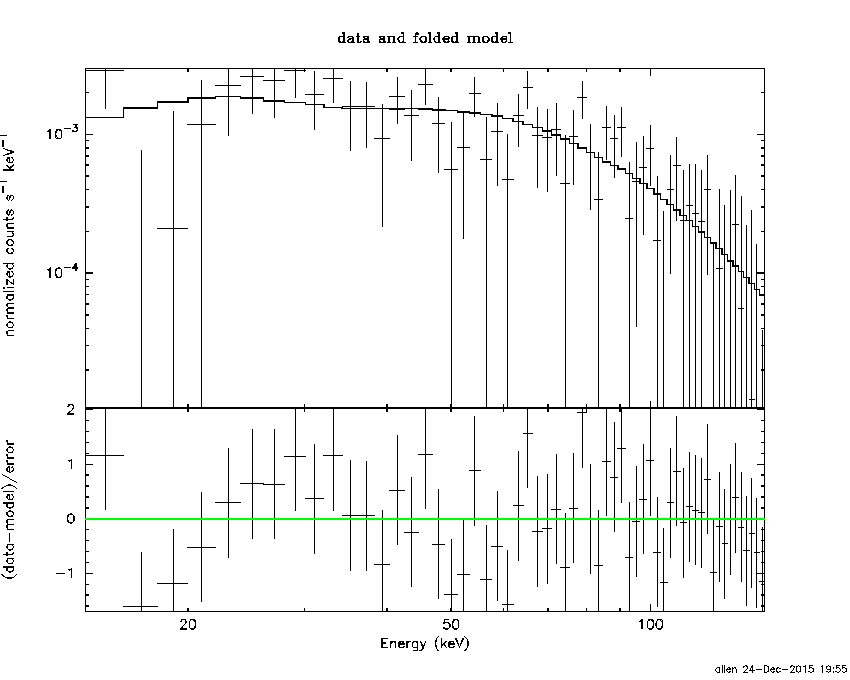
Time averaged spectrum fit using the average DRM
Power-law model
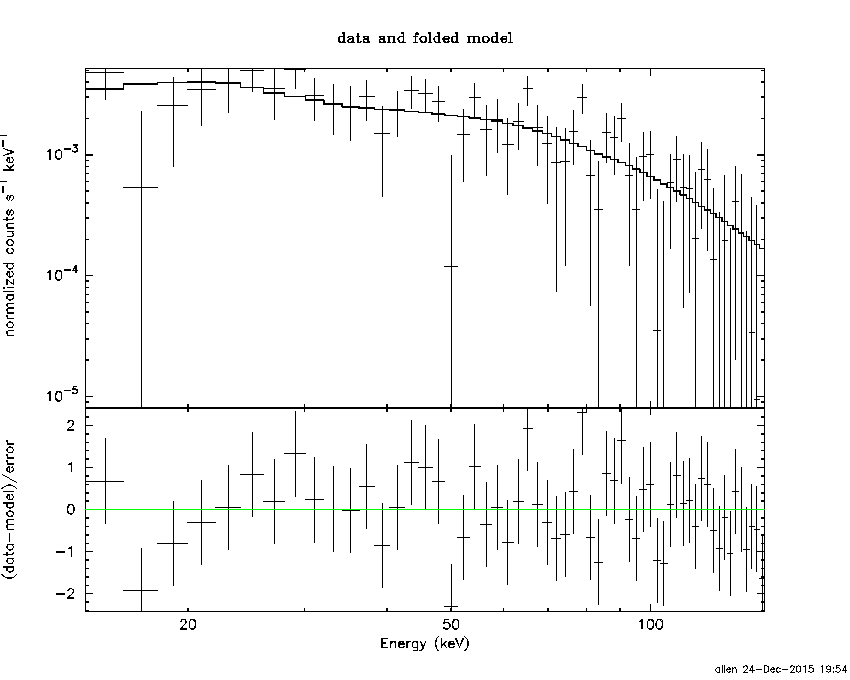
Time interval is from   -0.008 sec. to    0.568 sec.

Spectral model in power-law:
------------------------------------------------------------
Parameters  : value       lower 90%   higher 90%
Photon index: -1.00943     ( -0.218693   0.224853 )
Norm@50keV  : 1.26532E-02    ( -0.0015916   0.00158927 )
------------------------------------------------------------
#Fit statistic : Chi-Squared =          47.10 using 59 PHA bins.
# Reduced chi-squared =         0.8264 for     57 degrees of freedom
# Null hypothesis probability =   8.220801e-01

Photon flux (15-150 keV)    in 0.576 sec: 1.45750 ( -0.18518  0.18546 ) ph/cm2/s
Energy fluence (15-150 keV)             : 7.85583e-08 ( -1.11238e-08  1.12719e-08 ) ergs/cm2
Cutoff power-law model
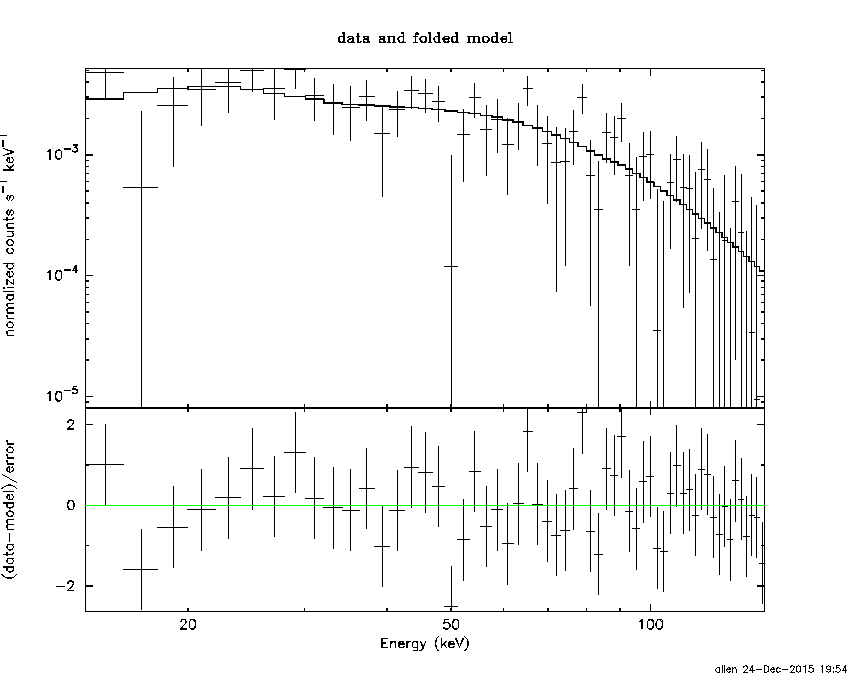
Time interval is from   -0.008 sec. to    0.568 sec.
Spectral model in the cutoff power-law:
------------------------------------------------------------
Parameters  : value       lower 90%   higher 90%
Photon index: -0.391057     ( -0.713982   1.01425 )
Epeak [keV] : 142.866      (   )
Norm@50keV  : 2.44151E-02    (     )
------------------------------------------------------------
#Fit statistic : Chi-Squared =          45.47 using 59 PHA bins.
# Reduced chi-squared =         0.8120 for     56 degrees of freedom
# Null hypothesis probability =   8.415114e-01

Photon flux (15-150 keV)    in 0.576 sec: 1.41602 ( -0.19392  0.19355 ) ph/cm2/s
Energy fluence (15-150 keV)             : 7.51836e-08 ( -1.22949e-08  1.22348e-08 ) ergs/cm2
1-s peak spectrum fit
Power-law model
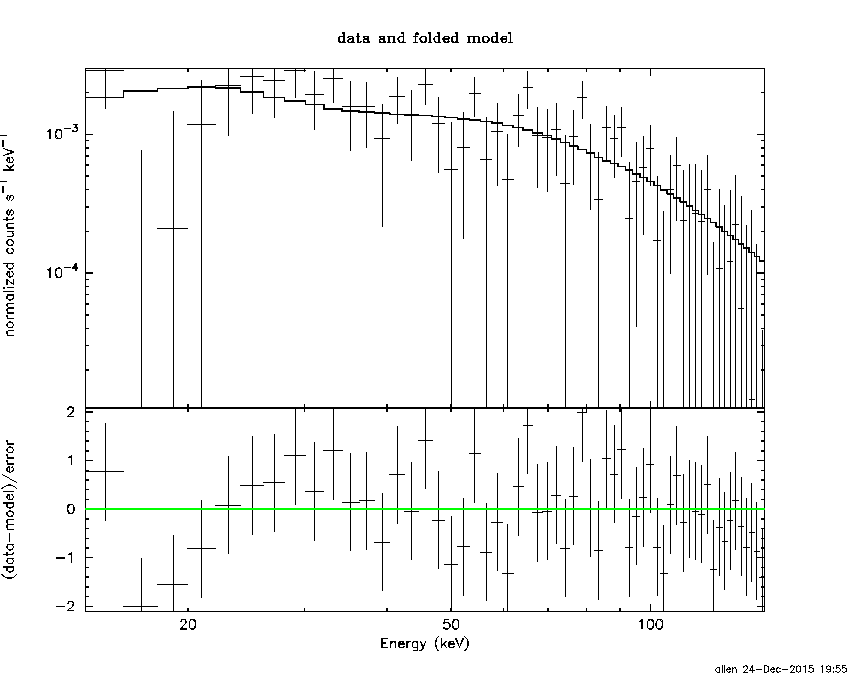
Time interval is from   -0.188 sec. to    0.812 sec.

Spectral model in power-law:
------------------------------------------------------------
Parameters  : value       lower 90%   higher 90%
Photon index: -0.863632     ( -0.244189   0.256454 )
Norm@50keV  : 7.74876E-03    ( -0.0011408   0.00113154 )
------------------------------------------------------------
#Fit statistic : Chi-Squared =          42.38 using 59 PHA bins.
# Reduced chi-squared =         0.7435 for     57 degrees of freedom
# Null hypothesis probability =   9.255783e-01

Photon flux (15-150 keV)    in 1 sec: 0.889364 ( -0.129577  0.130106 ) ph/cm2/s
Energy fluence (15-150 keV)             : 8.82247e-08 ( -1.35678e-08  1.37025e-08 ) ergs/cm2
Cutoff power-law model
Time interval is from   -0.188 sec. to    0.812 sec.
Spectral model in the cutoff power-law:
------------------------------------------------------------
Parameters  : value       lower 90%   higher 90%
Photon index: 0.0977731     ( -0.972499   1.28316 )
Epeak [keV] : 127.855      ( -43.0823 5269.48 )
Norm@50keV  : 2.00404E-02    ( -0.0121298   0.0445452 )
------------------------------------------------------------
#Fit statistic : Chi-Squared =          39.57 using 59 PHA bins.
# Reduced chi-squared =         0.7065 for     56 degrees of freedom
# Null hypothesis probability =   9.528179e-01

Photon flux (15-150 keV)    in 1 sec: 0.851633 ( -0.134807  0.1355 ) ph/cm2/s
Energy fluence (15-150 keV)             : 8.38012e-08 ( -1.47438e-08  1.46906e-08 ) ergs/cm2
Time-resolved spectra
Distribution
T90 vs. Hardness ratio plot
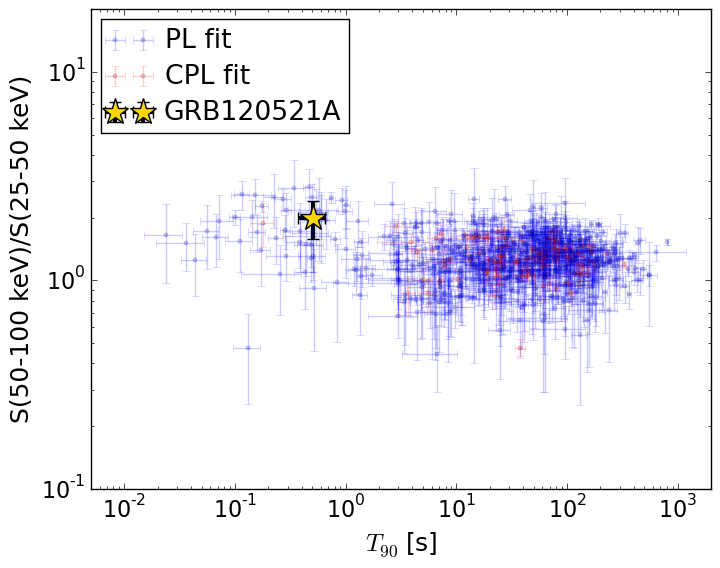
T90                                   = 0.512 sec.
Hardness ratio (energy fluence ratio) = 1.98701015688
S(15-50 keV) vs. S(50-150 keV) plot
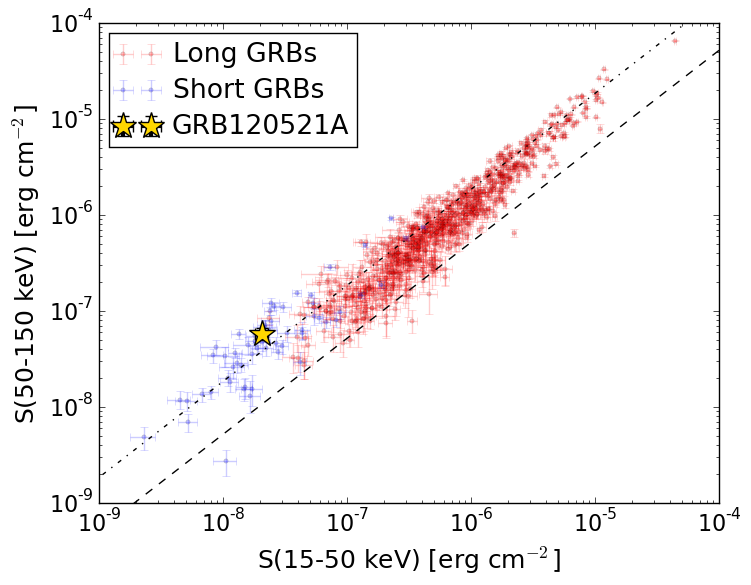
S(15-50 keV)  = 2.0528323e-08
S(50-150 keV) = 5.80295e-08
The dash-dotted line and the dashed line traces the fluences calculated from the Band function with Epeak = 15 and 150 keV, respectively. Both lines assume a canonical values of alpha = -1 and beta = -2.5.
Mask shadow pattern
IMX = 1.962374582997249E-01, IMY = 1.263874497532329E-01
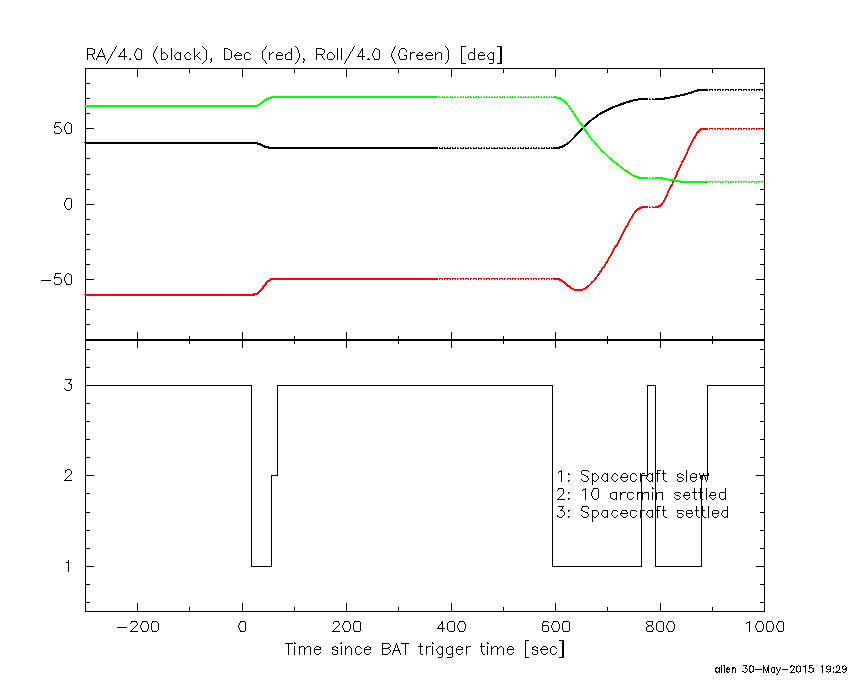
Spacecraft aspect plot
Bright source in the pre-burst/pre-slew/post-slew images
Pre-burst image of 15-350 keV band
Time interval of the image:
-597.067410 -578.595400
-239.168000 -0.008000

# RAcent  DECcent POSerr Theta    Phi  PeakCts   SNR AngSep     Name
#  [deg]    [deg]    ['] [deg]  [deg]                   [']
135.5277 -40.5514    1.0  25.6  -42.5   2.5028  11.3    0.2	Vela X-1
170.4156 -60.6790    1.4   4.0  115.7   1.4754   8.3    4.5	Cen X-3
186.7592 -62.6451    6.8  11.9  124.5   0.3270   1.7    8.0	GX 301-2
167.4864 -34.4646    2.5  25.6   20.0   0.9599   4.6 ------	UNKNOWN
147.5821  -5.8994    2.3  55.2   -7.6   3.2874   5.0 ------	UNKNOWN
140.2208  -4.7615    3.0  57.7  -16.0   3.5497   3.9 ------	UNKNOWN
  4.9577 -61.0240    3.7  57.9 -156.7   4.4599   3.1 ------	UNKNOWN
Pre-slew background subtracted image of 15-350 keV band
Time interval of the image:
-0.008000 0.568000

# RAcent  DECcent POSerr Theta    Phi  PeakCts   SNR AngSep     Name
#  [deg]    [deg]    ['] [deg]  [deg]                   [']
135.5011 -40.5285 1689.7  25.6  -42.5  -0.0001  -0.0    2.0	Vela X-1
170.1877 -60.5702    6.3   3.8  114.4   0.0174   1.8    4.9	Cen X-3
186.6296 -62.9368  189.5  11.8  126.0   0.0006   0.1   10.0	GX 301-2
148.6869 -49.4244    0.8  13.1  -32.8   0.1131  13.6 ------	UNKNOWN
134.4507  -5.0158    2.4  58.9  -22.6   0.2787   4.8 ------	UNKNOWN
 82.0477 -61.8363    2.2  36.7 -118.2   0.0897   5.2 ------	UNKNOWN
124.1715 -15.2011    2.2  52.7  -38.3   0.2162   5.2 ------	UNKNOWN
Post-slew image of 15-350 keV band
Time interval of the image:
56.732610 594.832600

# RAcent  DECcent POSerr Theta    Phi  PeakCts   SNR AngSep     Name
#  [deg]    [deg]    ['] [deg]  [deg]                   [']
135.5129 -40.5572    0.5  12.8  -64.5   8.1953  23.6    0.7	Vela X-1
170.2281 -60.6152    1.8  16.5  127.7   2.2579   6.3    2.6	Cen X-3
186.5374 -62.6991    4.6  24.4  124.0   1.0219   2.5    5.4	GX 301-2
 39.2723 -61.6824    2.7  55.5 -160.3   5.7018   4.3 ------	UNKNOWN
132.4172   3.0568    4.1  54.3  -33.3   6.0986   2.8 ------	UNKNOWN
 86.2622 -40.5752    3.6  43.7 -116.2   5.5674   3.2 ------	UNKNOWN